SIMBA’s view of the Eri disk††thanks: Based on observations collected at the European Southern Observatory, La Silla, Chile (71.C-0001)
We present the first observational confirmation for an extended circumstellar dust disk around $ϵ$~Eri. The observations were obtained with the bolometer array SIMBA at the 15 m radio telescope SEST in Chile and measure the dust continuum at 1.2 mm. The emission, with a total flux of 21.4 mJy and a rms of 2.2 mJy/beam, is resolved to a deconvolved size of 274 which corresponds to 88 AU. No clear indication for a ring-like disk structure is seen, possibly also due to the telescope’s large beam width of 24′′. Models of the object’s spectral energy distribution from IR to mm-wavelengths show that the emission can also be explained by a simple disk model. We further demonstrate the strong influence of noise and propose to be cautious with interpretations of the ring substructure.
Key Words.:
Stars: individual: Eri – circumstellar matter – planetary systems – submillimeter1 Introduction
Circumstellar disks are an ubiquitous product of the formation of stars and planetary systems. In these disks planets are believed to form from planetesimals that in turn are created through coagulation of dust and gas (Beckwith et al. Beckwith (2000)). The final stages of this process remain to be characterised but observations suggest that previous protoplanetary accretion disks turn into debris disks at the end of planet formation.
Photometric measurements with the IRAS satellite (Aumann Aumann (1988)) provided first hints for dust around the 800 Myr old star $ϵ$~Eri, a K2V dwarf at 3.22 pc distance to the Sun. From varying sub-mm flux densities in single-beam observations with different beam sizes (Chini et al. Chini90 (1990), Chini et al. Chini91 (1991), Zuckerman & Becklin Zuckerman (1993)), an extended – possibly ring-like – disk structure was assumed. In SCUBA observations at 850 m Greaves et al. (Greaves (1998)) found the dust emission peaking in a ring-like distribution between 35–75 AU distance from the star. The central cleared region and an asymmetrical substructure in the ring were explained by the influence of orbiting planets. Now a planet with a semi-major half axis of 3.4 AU is known (Hatzes et al. Hatzes (2000)), which for more than a decade was controversial because of the star’s high chromospheric activity. Quillen & Thorndike (Quillen (2002)) explained the ring substructure with a further hypothetical planet at 40 AU distance. CO line observations at the Swedish-ESO Submillimeter Telescope (SEST) concluded that the disk of $ϵ$~Eri is likely devoid of any gas (Liseau Liseau (1999)). With ISO no features from dust were found in mid-IR spectra between 6 and 12 m, and in maps at 60 and 90 m no resolved emission was seen (Walker & Heinrichsen Walker (2000)). A partially resolved region in IRAS data, quoted by some authors, was thus not confirmed. Several attempts to reveal the disk (in scattered light) with coronographic imaging at near-IR and optical wavelengths have been tried without success, including HST observations. Recently, Li et al. (Li (2003)) calculated a disk model from the IR to sub-mm spectral energy distribution (SED) of $ϵ$~Eri, but different disk and grain parameters were used than in our simulations. Furthermore, our calculations now also include observations at 1.2 mm. An overview of the fluxes used in this work is given in Table 1.
| Wavelength [m] | Flux [mJy] | Error | Reference |
|---|---|---|---|
| 12 | 9520 | 4 % | IRAS |
| 25 | 2650 | 6 % | IRAS |
| 60 | 1660 | 8 % | IRAS |
| 100 | 1890 | 9 % | IRAS |
| 450 | 185 | 103 mJy | Greaves (1998) |
| 850 | 40 | 3 mJy | Greaves (1998) |
| 1200 | 21.4 | 5.1 mJy | this work |
We present the first observational confirmation of an extended dust disk around Eri found with the Sest IMaging Bolometer Array (SIMBA). With results from numerical simulations for the target’s SED we set constraints on dust properties and discuss whether a continuous disk with an inner radius given by the dust sublimation temperature could be considered alternatively.
2 Observation
The observations of Eri were obtained in July 2003 with the 37-channel bolometer array SIMBA at the SEST in La Silla (Chile) using the fast scanning mode at 250 GHz ( mm). Skydips were taken every 2 to 3 hours to correct for the atmospheric zenith opacity, which was between and . We followed the SEST pointing model (rms 25) and checked the telescope pointing regularly. No significant deviation from the pointing model was seen. The flux calibration is based on observations of Uranus. In total, 180 maps of Eri were integrated which correspond to a total on-source time of 15 hours.
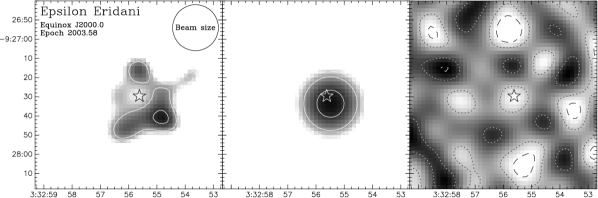
Data reduction was performed with MOPSI111MOPSI has been developed and is maintained by R. Zylka, IRAM, Grenoble, France and included despiking, baseline fitting, suppression of the correlated sky noise, opacity and gain-elevation correction as well as co-adding the 180 single maps to a final one, which is shown in Fig. 2. The residual root mean square error (rms) amounts to 2.2 mJybeam.
Observing at 1.2 mm with the 15 m dish of the SEST results in a nominal beam size of 24′′. This value can slightly vary with the elevation and other authors occasionally report 23′′ or 25′′. In principle, the beam size can be derived from a point source like, e.g., the planet Uranus. Averaging over various telescope positions we obtained a beam width of 242 02. The resolved emission of $ϵ$ Eri can be fitted by an extended, circular Gaussian intensity distribution with a full width half maximum (FWHM) of 364. This fit and its centering is achieved with a routine in MOPSI. Relative to the beam width we resolve the dust emission around Eri consistent with a deconvolved total extent of 274 corresponding to 88 AU. An elliptical shape of the intensity distribution – indicating an inclination of the disk – cannot be excluded, but is not apparent from our measurements. Greaves et al. (Greaves (1998)) reported = 25°. At 1.2 mm, after subtracting a photosphere contribution of 0.9 mJy, the total disk flux amounts to 21.4 mJy with a peak flux of 9.7 mJy/beam and 2.2 mJy/beam noise. As can be seen in Fig. 2 (central panel), the peak of the Gaussian lies 7′′ southwest of the star. This is not necessarily a physical effect, since the accuracy of the centering routine is within 5′′ (corresponding to 2.5 pixel in this figure).
3 Numerical simulations
The disk model is derived from the target’s SED with the fluxes shown in Table 1. Since especially the mid-IR fluxes contain a contribution from the stellar continuum, this is treated separately in the simulated SEDs.
We apply a model of an optically thin disk with the simple radial density profile (for the calculation of the dust temperature distribution see Wolf & Hillenbrand Wolf (2003), Eq. 5). The following stellar parameters are used for Eri: K, and (e.g. Soderblom & Däppen Soderblom (1989)). We select a circular disk with an extension from AU (corresponding to the radius given by the dust sublimation temperature) up to the observed AU. Other choices for the inner disk radius and their consequences are discussed in the next chapter.

Spherical homogeneous dust grains were used with radii according to a size distribution . This describes the equilibrium size distribution resulting from a collisional cascade of dust (Tanaka et al. Tanaka (1996)) and has often been used for the interstellar medium (ISM) and modelling of circumstellar disks. The best approximation to the observed SED is obtained for a minimum grain size m which is displayed in Fig. 1. SEDs for m and m are shown for comparison. We use an upper grain size of 1 mm. The disk mass, given in the next section, refers to this upper size limit, since we have no direct observational hints for cm-sized grains. Simulations are performed with a dust mixture deduced from the ISM: 62.5% silicate grains (according to Draine & Lee Draine (1984) and Weingartner & Draine Weingartner (2001)) mixed with 37.5% graphite. The dust grain density amounts to (silicate) = 2.7 g cm-3 and (graphite) = 2.24 g cm-3.
4 Discussion
Disk temperature and dust mass:
Submillimeter observations probe the cold dust towards the outer part of the disk. From a fit to the observed fluxes between far-IR and mm-wavelenghts we determine for the cold dust component a temperature of K using = 0 and (1.2 mm) = 1.7 cm2g-1 (a value often used for Vega-type disks, e.g. Sylvester et al. Sylvester (2001)). With the numerical simulations described above we obtain a dust mass of = , which lies about a factor of three under the lower mass limit given in Greaves et al. (Greaves (1998)).
Dust ring or a continuous disk:
We are able to explain the observed SED with a simple disk model, an inner disk radius given by the dust sublimation temperature and a minimum of free parameters, i.e. without further assumptions. However, we do not exclude other disk models. With the limited resolution of the SEST beam only a very sharp ring would have been detectable. Even for SCUBA the reported central cavity is close to the resolution limit. To explain however the mid-IR IRAS fluxes, some amount of hot circumstellar dust must be present at regions relatively close to the star. From modelling the observed SED no statement can be made to which extent the inner disk region may be depopulated of dust. Due to the large parameter space in any dust disk model (disk density profile, dust grain radii, grain size distribution, dust mineralogy, grain shapes, etc.) several solutions may exist to interpret the observed SED. Li et al. (Li (2003)) find their model in good agreement with Greaves et al. (Greaves (1998)) for disk radii 28 AU, while an additional “zodiacal” dust component would be required to explain the possible emission from the inner parts of the disk. This inner region was not clearly resolved by previous mid- and far-IR satellite cameras, but can be better studied with upcoming SIRTF observations (see Li et al. Li (2003) for a discussion on this). An alternative approach would be interferometric observations with the IRAM Plateau de Bure Interferometer operating at 1.3 mm wavelength with a resolution up to .
Influence of noise on the observed disk substructure:
Fig. 2 (left panel) shows our final co-added map of $ϵ$~Eri. The pixel sampling with 2′′ is justified because of SIMBA’s image sampling of 15 ms in azimuthal scan direction. With 80′′/s scanning speed this results in a spatial sampling of 12. In right ascension and declination we obtain a similar value due to the large coverage of maps taken at different phase angles. Our final image resembles a disk with a cleared central region and substructures in the ring. However, we can show that these details are most likely caused by remnant noise. The resolved emission of $ϵ$ Eri can be fitted by an extended Gaussian intensity distribution with a FWHM of 364 (central panel). A subtraction of this fit from the final map only results in pure residual noise, while a real central cavity should cause a clear negative peak after subtraction. The occurence of a minimum exactly at the position of the star leaves speculations whether this is a contribution of a real gap. However, this minimum is even less prominent than the noise minima above and below the star’s position. Similarly, the knots in the outer disk part can be explained by noise maxima. To verify this, we simulated a ring-like disk with artificial noise but without intrinsic ring substructures, and obtained a comparable result.
The knots in the SCUBA ring were attributed by some authors to be traps of dust due to orbital resonances of Jovian planets. However, most of these are smaller than the resolution of the SCUBA beam. We speculate that these structures may be explained similar to our observations.
5 Conclusions
Since several publications calculate planetary parameters from the knots in the $ϵ$~Eri ring structure, we intended to perform the first confirmation of this disk shape. Our observation with the bolometer array SIMBA operating at 1.2 mm is the first verification of an extended disk around this star. However, these data do not provide clear indications for the previously reported ring substructure. In our case the knots can be explained with remnant noise effects. We are able to model the observed SED with a simple, gap-free disk, but do not rule out the existence of a possible central cavity.
Acknowledgements.
We thank the SEST staff for their helpful support. SE is supported under Marie-Curie Fellowship contract HDPMD-CT-2000-5.References
- (1) Aumann, H.H. 1988, AJ, 96, 1415
- (2) Beckwith, S.V.W., Henning, Th., & Nakagawa, Y. 2000, in “Protostars and Planets IV”, eds. V. Manning, A.P. Boss, & S.S. Russel (Tucson: Univ. Arizona Press), 533
- (3) Chini, R., Krügel, E., & Kreysa, E. 1990, A&A, 227, L5
- (4) Chini, R., Krügel, E., Kreysa, E., Shustov, B., & Tutukov, A. 1991, A&A, 252, 220
- (5) Draine, B.T., & Lee, H.M. 1984, ApJ, 285, 89
- (6) Greaves, J.S., Holland, W.S., Moriarty-Schieven, G., et al. 1998, ApJ, 506, L133
- (7) Hatzes, A.P., Cochran, W.D., McArthur, B., et al. 2000, ApJ, 544, L145
- (8) Li, A., Lunine, J.I., & Bendo, G.J. 2003, ApJ, 598, L51
- (9) Liseau, R. 1999, A&A, 348, 133
- (10) Perryman, M.A.C., Lindegren, L., Kovalevsky, J., et al. 1997, A&A, 323, L49
- (11) Quillen, A.C., & Thorndike, S. 2002, ApJ, 578, L149
- (12) Soderblom, D.R., & Däppen, W. 1989, ApJ, 342, 945
- (13) Sylvester, R.J., Dunkin, S.K., & Barlow, M.J. 2001, MNRAS, 327, 133
- (14) Tanaka, H., Inaba, S., & Nakazawa, K. 1996, Icarus, 123, 450
- (15) Walker, H.J., & Heinrichsen, I. 2000, Icarus, 143, 147
- (16) Weingartner, J.C., & Draine, B.T. 2001, ApJ, 548, 296
- (17) Wolf, S., & Hillenbrand, L.A. 2003, ApJ, 596, 603
- (18) Zuckerman, B., & Becklin, E.E. 1993, ApJ, 414, 793