On Position Angle Errors in the Tremaine-Weinberg Method
Abstract
I show that Tremaine-Weinberg (TW) measurements of bar pattern speeds are sensitive to errors in the position angle of the disc, PAdisc. I use an -body experiment to measure these errors; for typical random PAdisc errors, the resulting scatter in the measured values of the dimensionless bar speed parameter (defined as the ratio of the corotation radius to the bar semi-major axis) is of order the observational.
I also consider how the systematic PAdisc errors produced by disc ellipticities affect TW measurements. The scatter produced by these errors may be significant, depending on the ellipticity distribution. Conversely, by using the sample of TW observations, I find that an upper limit of the typical disc (density) ellipticity is at the 90 per cent confidence level, which is in good agreement with previous measurements.
Taken together, the random and systematic scatter suggest that the intrinsic distribution of of gas-poor early-type barred galaxies may be as narrow as that of the gas-rich later-types.
keywords:
galaxies: elliptical and lenticular, cD — galaxies: kinematics and dynamics — galaxies: structure — methods: observational1 Introduction
Barred (SB) galaxies account for more than half of all high surface brightness disc galaxies (Knapen 1999; Eskridge et al. 2000). Recent observational and theoretical studies have focused on the pattern speed of bars, . The quantity of greatest interest is , where is the corotation radius and is the semi-major axis of the bar. A self-consistent bar must have (Contopoulos 1980); bars with are termed fast, while slow bars have larger . Because bars have strong quadrupole moments, they lose angular momentum efficiently in the presence of a dense dark matter halo (Weinberg 1985), slowing down in the process; fast bars therefore have been interpreted as evidence for maximum discs (Debattista & Sellwood 1998, 2000, but see also Valenzuela & Klypin 2002). Thus the accurate measurement of in SB galaxies is of interest.
Bar pattern speeds can be most reliably measured when kinematic data are available. One method relies on the dependence of the gas flow pattern on , particularly at the shocks in the bar region. Hydrodynamical simulations can therefore recover ; these find fast bars (e.g. van Albada & Sanders 1982; Athanassoula 1992; Lindblad & Kristen 1996; Lindblad et al. 1996; Weiner et al. 2001). An alternative method, which measures directly, was developed by Tremaine & Weinberg (1984). Until now, the Tremaine-Weinberg (hereafter TW) method has been applied to a small, but growing, number of SB galaxies (published measurements are listed in Table LABEL:tab:tw_measurements); all cases are consistent with fast bars.
Using 2-D absorption-line spectroscopy of the SB0 galaxy NGC 7079, Debattista & Williams (2003, in progress) show that the value of obtained with the TW method is sensitive to small errors in the position angle of the disc, PAdisc. This raises the possibility that small errors in PAdisc introduce a significant scatter in TW measurements of .
Errors in PAdisc can be either simple random ones, or systematic ones, produced, for example, by deprojecting an intrinsically elliptical disc assuming it is axisymmetric. Constraints on the ellipticities111In this paper, disc ellipticity refers to the ellipticity, , of the disc’s density in its main plane. Expressions relating and , the ellipticity of the potential in the disc plane, can be found in Franx et al. (1994). Where the disc dominates the potential, of discs come from a variety of measurements. The observed axes-ratios of galaxies show a deficit of apparently circular discs, from which one concludes that perfect oblate spheroids are poor fits to the data (Binney & de Vaucouleurs 1981; Grosbøl 1985). Nevertheless, such studies find that typical ellipticities must be small, (Magrelli et al. 1992; Huizinga & van Albada 1992; Lambas et al. 1992; Fasano et al. 1993). Constraints on are improved when kinematic data are included. Rix & Zaritsky (1995) defined a sample of 18 kinematically face-on galaxies from the Tully-Fisher relation (Tully & Fisher 1977, hereafter the TF relation). Using -band photometry, they estimated typical , with two arm spirals possibly accounting for some of this signal. Franx & de Zeeuw (1992) showed that the small scatter in the TF relation requires that . Since it is highly unlikely that all the TF scatter is due to disc ellipticities alone, they concluded that a more likely limit is . By analysing the residuals in the velocity-field of the gas ring around the S0 galaxy IC 2006, Franx et al. (1994) found for this galaxy. This approach has also been used by Schoenmakers et al. (1997) ( for 2 galaxies) and Beauvais & Bothun (1999), ( for 6 galaxies). An important uncertainty in this method is the viewing angle of any ellipticity. Andersen et al. (2001), therefore, measured from the discrepancies between photometric and kinematic disc parameters of nearly face-on galaxies, finding an average for 7 galaxies; using the same method on a larger sample of 28 galaxies, Andersen & Bershady (2002) were able to fit a log-normal distribution, with (). In all these studies, spirals may be responsible for some or all of the signal seen (Barnes & Sellwood 2003). Finally, in the Milky Way Galaxy, a variety of constraints, local and global, independently suggest , with the Sun close to the minor-axis of the potential (Kuijken & Tremaine 1994).
This paper studies the effect of PAdisc errors on TW measurements. In Section 2 I describe the TW method and its main sources of uncertainty. Most of these uncertainties can be quantified directly from observations. However, this is not generally true for errors due to PAdisc uncertainties, so that some modelling is required. Section 3 therefore is devoted to setting up an -body model for studying the impact of PAdisc errors on TW measurements. In Section 4 I demonstrate the sensitivity of the TW method to small PAdisc errors and estimate the scatter in expected for the observational level of PAdisc uncertainty. In Section 5, I consider the scatter in due to non-axisymmetric outer discs on TW measurements. I also obtain a novel constraint on of early-type SB galaxies, based on the requirement that none of the TW measurements thus far would have found a value of outside some range. The result is in agreement with previous determinations of for unbarred galaxies. In Section 6, I present my conclusions. Throughout, I pay particular attention to obtaining a conservative estimate of the scatter in due to PAdisc errors.
2 The TW method and its sources of errors
The TW method requires a tracer population which satisfies the continuity equation, and assumes that the time-dependence of the surface density, , can be expressed, in terms of cylindrical coordinates in the disc plane, as:
| (1) |
While not all non-axisymmetric structures obviously satisfy the condition of equation 1 (e.g. warps), bars are well approximated by this assumption. The TW method is then contained in the following expression:
| (2) |
Here, , , is the disc inclination (I use the convention for face-on), is an arbitrary weighting function, is the line-of-sight velocity (minus the systemic velocity) and are galaxy-centered coordinates measured along the disc’s major (i.e. inclination/line-of-nodes) and minor axes, respectively. Equation 2 holds even when , as it must, since the continuity equation is purely kinematic.
| Galaxy | References | |||
|---|---|---|---|---|
| NGC 936 | K87; MK95 | |||
| NGC 4596 | GKM99 | |||
| NGC 1023 | DCA02 | |||
| ESO 139-G009 | ADC03 | |||
| IC 874 | ADC03 | |||
| NGC 1308 | ADC03 | |||
| NGC 1440 | ADC03 | |||
| NGC 3412 | ADC03 |
Hydrodynamical studies find a narrow range in . The quoted errors and spread in when measured with the TW method are larger (see Table LABEL:tab:tw_measurements). Important sources of uncertainty in TW measurements are:
-
1.
Uncertainty in . To obtain with the TW method, the most commonly used strategy is to obtain several absorption-line slit spectra, for each of which and are measured. Then plotting versus , one obtains as the slope of the best-fitting straight line. The values of are usually quite well defined; however values of tend to be noisy, and are the main source of uncertainty in . This problem can be partly alleviated by projecting slit spectra along the spatial direction, thereby increasing the signal-to-noise () ratio (Merrifield & Kuijken 1995).
-
2.
Uncertainty in . Once is measured, can be approximated as , where may be assumed flat. However, because the tracer population must satisfy the continuity equation, the TW method is applied to early-type galaxies, which lack substantial patchy obscuring dust. Unfortunately, their velocity dispersions are large, so that measurements of require correction for the asymmetric drift (unless gas is present outside the bar region [Gerssen 2002]).
-
3.
Uncertainty in . The bar semi-major axis is sometimes hard to measure in early-type galaxies since their bars often gradually blend into the disc. The presence of massive bulges further complicates measurement of .
For concreteness, note that the mean fractional uncertainties in , and for the ADC sample (defined in Table LABEL:tab:tw_measurements) are 30, 7 and 19 per cent, respectively. The resulting 67 per cent uncertainty in , averaged over all the galaxies of Table LABEL:tab:tw_measurements, is . (Meanwhile, the scatter of for the full sample, which includes both an observational error part and an intrinsic distribution part, is . I measured this value by using Monte-Carlo experiments in which I varied and uniformly in their error intervals, and varied assuming its errors are Gaussian.)
Another source of error in the TW method is errors in the position angle of the disc, PAdisc. Consider a slit observation: the right-hand side of equation 2 then measures the flux of the tracer across the slit. However, this requires that the slit be exactly parallel to the axis; for any other orientation, the observed velocities do not measure the full flux. At the same time, , the luminosity-weighted average position along the slit, is rotated by the PAdisc error. The combination of these two effects leads to an error in the measured . Indeed, it is surprising just how sensitive the TW method is to errors in PAdisc: using 2-D Fabry-Perot observations of NGC 7079, Debattista & Williams (2003, in preparation) show that errors of as little as in PAdisc can lead to errors in of up to 100 per cent. Published values of PAdisc often have uncertainties of this order. While uncertainties in , and can be quantified directly from observations, errors in due to PAdisc errors can only be modelled.
3 Model and TW Measurements
3.1 The -body system


To quantify better the sensitivity of the TW method to errors in PAdisc, I applied it to a high resolution -body bar. In numerical simulations, can be measured accurately directly from the time evolution, which makes possible a comparison with TW measurements at various disc and bar orientations and errors in PAdisc. The simulation which produced the model of an early-type galaxy consisted of live disc and bulge components inside a frozen halo. The frozen halo was represented by a spherical logarithmic potential
| (3) |
where is the core-radius and is the asymptotic circular velocity. The initially axisymmetric disc was modelled by an exponential disc with a Gaussian thickening
| (4) |
where is the fraction of the active mass which is in the disc and is the radius at which the disc is truncated. The bulge was generated using the method of Prendergast & Tomer (1970), where a distribution function is integrated iteratively in the global potential, until convergence. For this application, I used the distribution function of a lowered, , polytrope, truncated at
| (5) |
Here is a mass normalization constant and , the total potential at in the disc plane. Disc kinematics were set up using the epicyclic approximation to give Toomre , a value appropriate for an early-type disc galaxy; this leads to weak spirals, which do not interfere substantially with measurements of . Vertical equilibrium was obtained by integrating the vertical Jeans equation. The disc and bulge were represented by equal-mass particles, giving a mass ratio . Further details of the setup methods used can be found in Debattista & Sellwood (2000).
In units where , which gives a unit of time , the values chosen for the various parameters are given in Table 2. This choice of parameters gives a flat rotation curve out to large radii, as shown in Fig. 1.
The simulation was run on a 3-D cylindrical polar grid code (described in Sellwood & Valluri [1997]) with . The radial spacing of grid cells increases logarithmically from the center, with the outer edge of the grid at just over . The vertical spacing of the grid planes, , was set to . I used Fourier terms up to in the potential, which was softened with the standard Plummer kernel, of softening length . Time integration was performed with a leapfrog integrator using a fixed time-step .
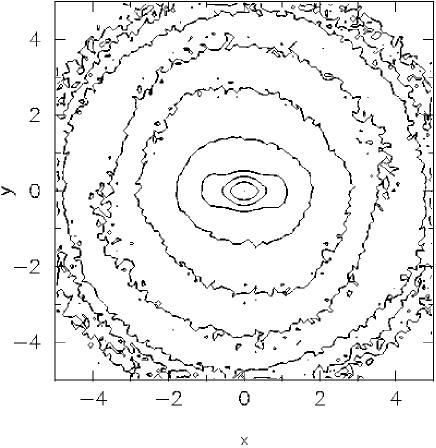
The equilibrium set up using epicyclic theory is rather approximate at this high ; nonetheless, the system quickly relaxes to a new equilibrium close to the initial conditions. The resulting axisymmetric system is unstable and forms a rapidly rotating bar by . Fig. 2 shows the system at , the time I chose for this analysis; by this time, the bar had gone through a period of growth and had settled to a well defined value. The bar is strong in the disc, with a weaker triaxiality in the bulge. The values of the bar’s parameters at this time are given in Table 2. Note that the resulting -body model of an SB0 galaxy is reasonable, with a bar which is neither too weak nor too strong, having towards the upper limit of, but within, the range of the ADC sample.
Since the dark matter halo is frozen, remains constant except for small oscillations produced by interference with weak spirals. I chose because the spirals were relatively weak at this time, allowing me to measure with a minimum of interference.
| Halo core radius | ||
| Halo circular velocity | ||
| Disc scaleheight | ||
| Disc truncation radius | ||
| Bulge truncation radius | ||
| Bar semi-major axis | ||
| Bar pattern speed | ||
| Bar speed parameter |
3.2 Pattern speed measurements
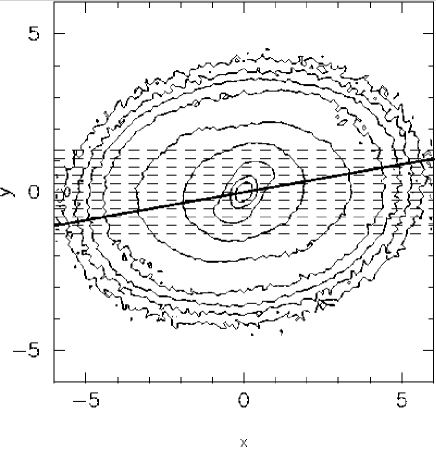
For TW measurements on the -body system, I began with the disc in the -plane with the bar along the -axis, as in Fig. 2. For an observer at positive , viewing the system at an arbitrary orientation requires three rotations. Rotating the system (rather than the frame), the first rotation is about the -axis through an angle , followed by a rotation about the -axis to give an inclination . At this point, the frame of the TW integrals is identical to the frame. A third rotation, through an angle about the -axis, introduces an error in PAdisc if the observer continues to identify with . (Note that, in this definition, moves the assumed disc major-axis away from the bar’s major-axis.) From here on, for notational convenience, I refer to the and axes as the assumed major and minor axes of the system (i.e. the and axes), even when . Fig. 3 shows an example of the system after such a series of rotations.
I measured and for , and in 11 slits covering the region . Here is the largest of the projections onto the -axis of the bar’s 3 principal axes. This limited range in mimics the typical observational setup, and reduces the noise in the measurement. The values of and for each slit were obtained as:
| (6) |
where and are the line-of-sight velocity and coordinate of particle , is the weight assigned to each particle and (which corresponds to , so that and are the luminosity-weighted average position and velocity of each slit, as in observations). Except where noted, I used for all particles, whether disc or bulge; thus , the number of particles in the slit. If and represent the integrals extending from to , then error estimates and were obtained by considering their maximum variation with outside the bar radius. Because the number of particles in each slit was high, these radial variations are due only to weak non-axisymmetric structure at large radius. In Fig. 4, I show and for a typical slit.
To measure the pattern speed from a set of such slits, I fit a straight line to as a function of , as in observations, using least-squares weights . The principal observational uncertainty is in and is due to photon statistics; I therefore used .
The slope of this fitted line is , where I use the notation to distinguish from the pattern speed measured through the time evolution. An example of such a fit is shown in Fig. 5, which reveals that and increase with increasing , until they reach a maximum, and then decrease. Observational requirements of high in modest time usually restricts slit offsets to ones at, or inside, the maximum in (e.g. Aguerri et al. 2003).
I verified that the TW method accurately measures when : in the range and , fractional errors, , are smaller than 20 per cent, in agreement with Tremaine & Weinberg (1984).
Besides this experiment, I tried various others. For example, in two experiments, I set and for the bulge particles, leaving for the disc ones. The results were consistent with those presented above, leading me to conclude that any plausible difference between the stellar mass-to-light ratio of the bulge and disc does not introduce large errors in .
4 Simple PAdisc errors
4.1 Sensitivity to errors in PAdisc
Fig. 4 also plots and for . It is clear that these small errors in PAdisc change the values of and substantially, while qualitatively looking similar to the case. Moreover, these changes are at all , particularly in the case of ; thus, limiting the integrals to small does not diminish the error (although it does not increase it, either, unless is well within the bar). For this one slit, these changes gave an which is in error by up to 100 per cent.

In Fig. 6, I again plot the integrals as a function of , but this time for . Both and reach a smaller (larger) maximum in the case of ( ), while at larger offsets, the decrease in the values of the integrals is faster (slower) than in the case; for , even switches sign.
To begin to understand these changes, I consider an axisymmetric system. For a slit at , when , the contribution to and from is exactly cancelled by that from . When , several changes occur. First, is always closer to the galaxy center (in the disc’s own plane), and at a smaller angle from the intrinsic major-axis, than is . Therefore , if the rotation curve is flat, giving a positive perturbation, which is further enhanced if the density profile of the disc decreases radially, as is generally the case. The changes in are due solely to the radial variation of the surface density; when this is constant everywhere, is exactly zero at all . Conversely, an exponential disc with small scale-length (relative to the slit offset) gives large values of when . The change in is large already at small (see Fig. 4), whereas the changes in are more distributed over . This behavior is due to the fact that the integrand grows more rapidly with than does . Indeed, for a flat rotation curve is largest at .
Fig. 7 plots and at for the axisymmetric disc produced by randomizing the azimuthal coordinate of all the particles in the -body model (preserving the average radial density profile). Even in the absence of any non-axisymmetric structure, misaligned slits produce non-zero and , which may plausibly be fit to a pattern speed where none is present.
These extra contributions to and will still be present in the barred case, modified by the presence of the bar (e.g. will still change even when the azimuthally averaged radial profile is constant, and changes sign if the bar crosses the -axis), but fundamentally of the same character. It is then easy to imagine that some combination of Fig. 5 and Fig. 7 produces the bottom panels of Fig. 6, at least qualitatively. For , the signs of and in Fig. 7 would be reversed, which then combines with Fig. 5 to produce something like the top panels of Fig. 6.
Fig. 6 suggests that, when , it may be possible to recognize by the large in the linear regression. Unfortunately the most discrepant points are the ones at large offset; in observations, their will certainly be (fractionally) much larger than here, in which case is not likely to be greatly increased by these points. Moreover, the two most discrepant points are at small and are thus unlikely to have been chosen for observation in the first place. It therefore seems likely that, in the absence of considerable investment in telescope time (which anyway would not catch ), the error in PAdisc would go unnoticed.
The errors of Fig. 6 give errors in as large as 48 per cent. In Fig. 8, I present the largest errors permitted to guarantee accurate to 30 per cent. The limits on are quite stringent: is needed at and the limit is smaller at other inclinations. (Note, however, that for to be larger than 30 per cent, it is necessary, but not sufficient for to be larger than the values given in Fig. 8, since can be either positive or negative.)


4.2 Scatter from random PAdisc errors
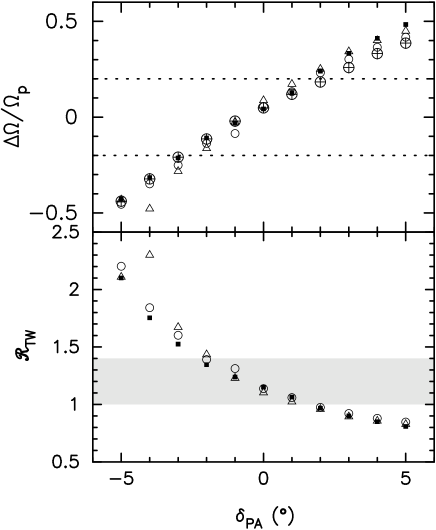
Fig. 9 plots and as functions of . (This definition of ignores the errors in and due to . These errors change by only a small amount for the inclinations of interest here.) The shaded region in the bottom panel indicates the region of fast bars; it is clear that once becomes larger than about , values of scatter outside this region. Uncertainties in PAdisc must therefore also contribute to the scatter in measurements of . Assuming Gaussian errors in PAdisc with zero mean and FWHM of (), I found a scatter in , , (defined as the 67 per cent interval about the median), of (), as shown in Fig. 10; this is substantially larger than the intrinsic measurement scatter at , which is only . Since, for the ADC sample, the observational root-mean-square uncertainty in PAdisc is , measurements of with the TW method cannot directly resolve the intrinsic distribution of if it is as narrow as hydrodynamical simulations require, even before other sources of scatter are considered.
An important characteristic of the scatter is that may result. Since is physically impossible (Contopoulos 1980), this may help in distinguishing the effects of PAdisc errors from the intrinsic distribution of .
5 Additional Non-Axisymmetries
If the disc contains additional non-axisymmetric structure besides the bar, then this will interfere with the measurement of . If the disc non-axisymmetric density can be decomposed into 2 components, with different pattern speeds, then is a luminosity and asymmetry weighted average of the two pattern speeds (Debattista et al. 2002b). I assume that the second component is a weaker non-axisymmetric structure and/or is at larger radius and therefore lower surface brightness, so that this type of interference will be relatively small and can be ignored. (This can also be justified by noting that the weak spiral structure at large radius in the -body model does not introduce substantial errors in .) Instead, I concentrate only on the effect these secondary non-axisymmetric structures have on due to the errors they introduce in the measurement of PAdisc.
5.1 Elliptical discs
In all cases in which the TW method has been used, PAdisc has been measured from surface photometry under the assumption that the disc is intrinsically circular. When the disc is elliptical, deprojecting with this assumption gives rise to errors in and PAdisc, as shown in Fig. 11. These errors lead to further scatter in .
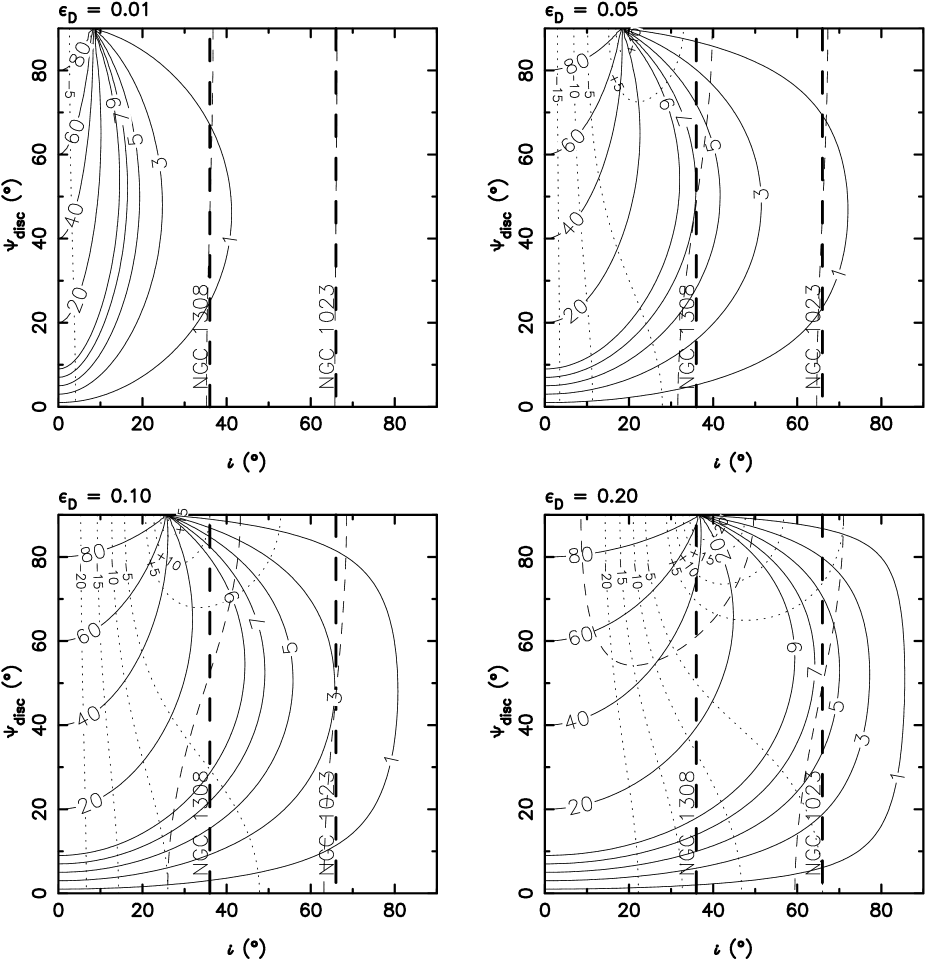
To study this scatter, I assumed that, at large radii, and (where is the angle of the elliptical disc in the plane of the disc relative to the line-of-nodes) are both constant, and computed the apparent PAdisc (PAapp) and apparent () resulting from the assumption of a circular disc. I used these to measure the apparent circular velocity () and bar semi-major axis (). I then obtained as the slope of the best-fitting line to , from which I measured . By assuming that the bar is infinitely narrow, I measured the apparent bar PA in the disc plane, , and then averaged over , and . Fig. 12 plots the resulting distributions of obtained for various constant . The ellipticity-induced scatter, , grows rapidly with (, and for , and respectively), with most measurements of outside the range once . The distinctive peak to for the larger values of is due to the fact that the distribution of , at fixed , has peaks near . The peak at is higher than that at because .
Fig. 12 also shows the distribution of resulting from the ellipticity distribution of Andersen & Bershady (2002) for later-type unbarred galaxies. The two largest values of in their sample of 28 were and (Andersen 2002, private communication). As can be seen in Fig. 11, large values of produce PAdisc errors as large as in the (apparent) inclination range of interest, which would result in very large errors in . Therefore I truncated their distribution at and . The resulting scatter is and respectively.

To compute an upper limit for the characteristic of SB0 galaxies, I define as the probability that all measurements will result in , a range outside which, at the 67 per cent interval, none of the measurements of Table LABEL:tab:tw_measurements fall. Then, for that sample, I compute by matching and to the observed values and averaging over , obtaining Fig. 13. The probability of having found less than or greater than for one or more of these galaxies exceeds 90 per cent (75 per cent for ) if for all of them. (The strongest constraints come from the low inclination galaxies, while NGC 1023, which has the largest inclination of this sample, does not constrain at all, up to .) This upper limit on the disc ellipticity is in rough agreement with previous measurements (e.g. Franx & de Zeeuw 1992) for unbarred galaxies.

5.2 Rings
In Section 5.1, I assumed that is uncorrelated with . Correlations between and may be introduced by the outer rings often seen in SB galaxies. Two main types of outer rings are possible (e.g. Buta 1995): , which are aligned perpendicular to the bar, and , which line up with the bar. Galaxies selected for TW measurement do not contain strong rings, but conceivably weak rings might have been overlooked. To consider their effect on TW measurements, I simply set (for rings of type ) and (for rings of type ) and proceeded as for Fig. 12. The results, unsurprisingly, showed that rings of type , which lead to , produce , while rings of type lead to . Buta (1995) found mean of and for rings of type and respectively. If such rings had been present in the sample of Table LABEL:tab:tw_measurements, then the scatter in would have been significantly higher.
5.3 Spirals
Recently, Barnes & Sellwood (2003) have questioned the interpretation of discrepancies between photometric and kinematic inclinations and PA’s as resulting from disc ellipticities. Instead, they found evidence that spirals, or similar non-axisymmetries, produce these discrepancies. They reported an average PAdisc uncertainty of about for earlier-type galaxies.
PAdisc errors of this type will produce scatter in in much the same way as do random PAdisc errors. For , I found a resulting scatter . However, the sample of galaxies used by Barnes & Sellwood (taken from Palunas & Williams [2000]), excluded galaxies as early as S0, so this value is somewhat uncertain and is probably an over-estimate.
5.4 Warps
While most disc galaxies are coplanar inside (Briggs 1990), examples of warps inside this radius are not unknown. One extreme case is the interacting galaxy NGC 3718, which has a warp of about at (Schwarz 1985). However, such strongly interacting galaxies are usually not selected for TW studies. Furthermore, the large velocity dispersions of early-type galaxies serve to stiffen their stellar discs (Debattista & Sellwood 1999), so that any warps inside are generally small. Therefore warps probably do not introduce significant scatter in TW measurements.
6 Discussion and Conclusions
6.1 How realistic are the error estimates?
How realistic are these estimates of and the ’s? Since, for , the values of and are not all close to a straight line (see Fig. 6), a poor choice of could lead to excess scatter. At , I obtained the smallest with , which is defined only from the variations of with . This is unsurprising, since represents the full uncertainty in . All other definitions of produced larger errors. In particular, while gives a mean of 3 per cent, produces a mean of 7 per cent.
However, when , favoring slits with small offset, which generally acquire fractionally smaller perturbations, produces smaller scatter. Fig. 10 compares the distributions of from random Gaussian PAdisc errors of FWHM as obtained using and . The former produces a smaller scatter, due mostly to the reduced noise at , i.e. at . I tried other definitions of , including , equal weights, , and various combinations of these. I also tried using only 3 slits (the central one and either the two with the largest or the two flanking slits), as is often done in observations. These always gave larger scatter, typically by per cent or more. I therefore used everywhere in this paper to compute and the ’s. Thus I am assured of a conservative estimate of the scatter, while also matching better the main source of noise in the observations: the photon statistics.
Since I have used only one simulation to estimate the scatter, I need to show that this simulation does not over-estimate the errors in that real galaxies would suffer. Perhaps the most important parameter affecting the size of the scatter in is , as described in Section 2. A series of experiments with razor-thin, flat rotation curve, axisymmetric exponential discs showed that, indeed, the scatter in due to random PAdisc errors increases as decreases. Since my model SB0 has a value of that is towards the upper end of those in the ADC sample, my measurements of and probably underestimate somewhat the scatter which the same PAdisc errors would produce in real galaxies. The same conclusion resulted from a test with a lower quality ( particle) simulation having a larger bar (); for random Gaussian errors of FWHM , this bar produced versus for the shorter bar used in this paper.
The trend with seen in Fig. 6 is in the same sense as was found by Debattista & Williams (2002) for NGC 7079. Fig. 9 plots for the same projection as NGC 7079. The errors in due to for NGC 7079 () reported by Debattista & Williams are perhaps a little larger than those computed here. Gratifyingly, the error estimates produced by the -body model are not unrealisticly large.
6.2 The ellipticity of early-type barred galaxies
The ellipticities of S0 galaxies are poorly constrained. From photometry only, Fasano et al. (1993) found that they could not rule out that they are perfectly oblate. The two S0 galaxies with directly measured ellipticities, IC 2006 (Franx et al. 1994) and NGC 7742 (Rix & Zaritsky 1995) both have small, possibly zero, ellipticity ( and respectively). The ellipticities of SB galaxies are not much better constrained, undoubtedly because they require a distinction between the inner, bar-dominated, region and the outer parts. Photometry alone, therefore, is of limited use, and kinematics also are needed. Unfortunately, most TF studies have avoided SB galaxies. Debattista & Sellwood (2000) showed that the small fraction of bright () SB galaxies contaminating the sample of Mathewson & Ford (1996), who selected against SB galaxies, satisfies the same TF relation, and has the same scatter, as the unbarred (SA) galaxies. Sakai et al. (2000) calibrated the TF relation of nearby galaxies with Cepheid distances; their sample of 21 galaxies contained a more representative fraction of SB galaxies, at per cent. The resulting TF relation, including the scatter, also was identical for SA and SB galaxies. Thus we may suppose that the TF-based constraint of Franx & de Zeeuw (1992), , also holds for SB galaxies.
The constraint obtained here, , is in rough agreement with the constraints for SA galaxies. However, an important possible bias needs to be pointed out. The ADC sample of 6 galaxies explicitly excluded galaxies for which, at large radius, the observed PAdisc changes substantially with radius. From a sample of 11 galaxies for which they obtained surface photometry, one (Aguerri 2002, private communication) was excluded for this reason. If either or changes with radius, then the observed changes in PAdisc will typically be greater in galaxies with larger mean . Thus the cut on the size of PAdisc variations may have introduced a bias in the ellipticity distribution of the ADC sample; on the other hand, large variations in PAdisc may have been caused instead by spirals or by a warp.
Although these constraints on SB galaxy ellipticities are consistent with the constraints on SA galaxy ellipticities, this does not mean that their ellipticity distributions are the same, since both the TF and the TW constraint obtain only upper limits on .
6.3 The intrinsic distribution of
Hydrodynamical simulations of SB galaxies find a narrow range of . The presently observed distribution of is dominated by the observational uncertainties in , and . Nevertheless, it is clear that all 8 galaxies measured so far are consistent with the range found in hydrodynamical simulations. In their -body simulations with cosmologically motivated initial conditions, Valenzuela & Klypin (2002) found that bars with were produced, which they considered to be consistent with the observations. Indeed, for 4 of the 8 galaxies listed in Table LABEL:tab:tw_measurements, is within the error interval. However, 3 of these 4 galaxies are the ones with the largest error bars, and the fourth galaxy is only just barely consistent with this value. For the ADC sample, which have well-determined PAdisc uncertainties, the root-mean-square uncertainty in PAdisc is . From the results of Section 2, the corresponding scatter in , excluding any contribution due to disc ellipticity, should be . Allowing for this scatter, it seems possible that is outside the intrinsic range of .
For a crude estimate of the intrinsic range of , suppose we can write , where is the observed scatter, is the intrinsic range of , is the scatter due to random PAdisc errors, is the scatter due to disc ellipticity and is the scatter induced by uncertainties in the measurements of , and . All these ’s are assumed to be 67 per cent intervals. (Other sources of scatter, such as direct interference from spiral or other structure, small errors in slit orientation, etc., may be present but are assumed here to be unimportant.) From Section 2 I get that and , while from Section 4 I get . If for all galaxies, then , while the distribution of of Andersen & Bershady (2002), truncated at , produces . If, on the other hand, the interpretation of Barnes & Sellwood (2003) is correct, then , but it is replaced by . It therefore seems possible that the intrinsic range of for early-type galaxies spans a range similar to the later-type galaxies.
Unfortunately, the sample size is still too small for a proper statistical test of this suggestion. If correct, then the fact that SB galaxies have the same distribution of as the more gas-rich later-type SB galaxies requires that gas is not dynamically very important for the evolution of .
6.4 Future work and conclusions
The current sample of TW measurements is still quite small, so it is not unlikely that, in the future, more measurements will be obtained. The results of this paper can be read as an endorsement of careful surface photometry of target galaxies to accurately measure PAdisc. Inclinations in the range are preferable, since they are less sensitive to errors in PAdisc. For statistical studies, especially to constrain the distribution of , it would be very useful if future studies were to report their uncertainty in PAdisc. Galaxies with strong outer rings do not make good candidates for TW measurement because of the inherent uncertainty in PAdisc, and should be avoided. If the TW method is ever to be used on late-type galaxies, perhaps in the infra-red (e.g. Baker et al. 2001), care must be taken that the presence of spirals does not lead to excess errors in PAdisc.
The pattern speed of triaxial elliptical galaxies is a matter of theoretical speculation. Because of the large velocity dispersions and low stellar streaming velocities, it is generally thought that their pattern speeds must be small. Measurement of their pattern speeds would be very interesting, but unfortunately, application of the TW method to elliptical galaxies is likely to be accompanied by significant uncertainty in their intrinsic orientations (amongst other difficulties). Thus TW measurements of their pattern speeds may have large uncertainties.
I have shown that errors in PAdisc lead to significant error in TW measurements. For the observational level of random Gaussian errors, the resulting scatter in is . If barred galaxies are also modestly elliptical, then the total scatter increases further, depending on the distribution of . Given the observed range of , this suggests, therefore, that the gas-poor early-type galaxies have a narrow distribution of , not much different from gas-rich late-type galaxies, as determined by independent means. This result would imply that gas is not dynamically important for the evolution of bar pattern speeds.
Acknowledgments.
This work has been made possible by support from the Schweizerischer Nationalfonds through grant 20-64856.01. I thank Enrico Maria Corsini, Joris Gerssen, Dave Andersen, Jerry Sellwood, Alfonso Aguerri and Niranjan Sambhus for comments and discussion.
References
- [1] Aguerri J. A. L., Debattista V. P., Corsini E. M., 2003, MNRAS, 338, 465
- [2] Andersen D. R., Bershady M. A., Sparke L. S., Gallagher J. S., Wilcots E. M., 2001, ApJ, 551, L131
- [3] Andersen D. R., Bershady M. A., 2002, in E. Athanassoula, A. Bosma & R. Mujica, eds, ASP Conf. Ser. Vol. 275, Disks of Galaxies: Kinematics, Dynamics and Perturbations. Astron. Soc. Pac., San Francisco, pg. 39
- [4] Athanassoula E., 1992, MNRAS, 259, 345
- [5] Baker A. J., Schinnerer E., Scoville N. Z., Englmaier P. P., Tacconi L. J., Tacconi-Garman L. E., Thatte N., 2001, in J. H. Knapen, J. E. Beckman, I. Shlosman & T. J. Mahoney, eds, ASP Conf. Ser. Vol. 249, The Central Kiloparsec of Starbursts and AGN: The La Palma Connection. Astron. Soc. Pac., San Francisco, pg. 78.
- [6] Barnes I. C., Sellwood, J. A., 2003, AJ, 125, 1164
- [7] Beauvais C., Bothun G., 1999, ApJS, 125, 99
- [8] Binney J., de Vaucouleurs G., 1981, MNRAS, 194, 679
- [9] Briggs F. H., 1990, ApJ, 352, 15
- [10] Buta R., 1995, ApJS, 96, 39
- [11] Contopoulos G., 1980, A&A, 81, 198
- [12] Debattista V. P., Sellwood J. A., 1998, ApJ, 493, L5
- [13] Debattista V. P., Sellwood J. A., 1999, ApJ, 513, L107
- [14] Debattista V. P., Sellwood J. A., 2000, ApJ, 543, 704
- [15] Debattista V. P., Corsini E. M., Aguerri J. A. L., 2002a, MNRAS, 332, 65
- [16] Debattista V. P., Gerhard O., Sevenster M. N., 2002b, MNRAS, 334, 355
- [17] England M. N., Gottesman S. T., Hunter J. H., 1990, ApJ, 348, 456
- [18] Eskridge P. B. et al., 2000, AJ, 119, 536
- [19] Fasano G., Amico P., Bertola F., Vio R., Zeilinger W. W., 1993 MNRAS, 262, 109
- [20] Franx M., de Zeeuw T., 1992, ApJ, 392, L47
- [21] Franx M., van Gorkom J. H., de Zeeuw T., 1994, ApJ, 436, 642
- [22] Gerssen J., 2002, in E. Athanassoula, A. Bosma & R. Mujica, eds, ASP Conf. Ser. Vol. 275, Disks of Galaxies: Kinematics, Dynamics and Perturbations. Astron. Soc. Pac., San Francisco, pg. 197
- [23] Gerssen J., Kuijken K., Merrifield M. R., 1999, MNRAS, 306, 926
- [24] Grosbøl P. J., 1985, A&AS, 60, 261
- [25] Huizinga J. E., van Albada T. S., 1992, MNRAS, 254, 677
- [26] Kent S. M., 1987, AJ, 93, 1062
- [27] Knapen J. H., 1999, in J. E. Beckman, & T. J. Mahoney, eds, ASP Conf. Ser. Vol. 187, The Evolution of Galaxies on Cosmological Timescales. Astron. Soc. Pac., San Francisco, p. 72
- [28] Kuijken K., Tremaine S., 1994, ApJ, 421, 178
- [29] Lambas D. G., Maddox S. J., Loveday J., 1992, MNRAS, 258, 404
- [30] Lindblad P. A. B., Kristen H., 1996, A&A, 313, 733
- [31] Lindblad P. A. B., Lindblad P. O., Athanassoula E., 1996, A&A, 313, 65
- [32] Magrelli G., Bettoni D., Galletta G., 1992, MNRAS, 256, 500
- [33] Mathewson D. S., Ford V. L., 1996, ApJS, 109, 97
- [34] Merrifield M. R., Kuijken K., 1995, MNRAS, 274, 933
- [35] Palunas P., Williams, T. B., 2000, AJ, 120, 2884
- [36] Prendergast K. H., Tomer E., 1970, AJ, 75, 674
- [37] Rix H.-W., Zaritsky D., 1995, ApJ, 447, 82
- [38] Sakai S. et al., 2000, ApJ, 529, 698
- [39] Schoenmakers R. H. M., Franx M., de Zeeuw T., 1997, MNRAS, 292, 349
- [40] Schwarz U. J., 1985, A&A, 142, 273
- [41] Sellwood J. A., Valluri M., 1997, MNRAS, 287, 124
- [42] Tremaine S., Weinberg M. D., 1984, ApJ, 282, L5
- [43] Tully R. B., Fisher J. R., 1977, A&A, 54, 661
- [44] Valenzuela O., Klypin A., 2002, MNRAS, submitted (astro-ph/0204028)
- [45] van Albada T. S., Sanders R. H., 1982, MNRAS, 201, 303
- [46] Weinberg M. D., 1985, MNRAS, 213, 451
- [47] Weiner B. J., Sellwood J. A., Williams T. B., 2001, ApJ, 546, 931