Fact: Many SCUBA galaxies harbour AGNs
Fact: Many SCUBA galaxies harbour AGNs
Abstract
Deep SCUBA surveys have uncovered a large population of ultra-luminous galaxies at . These sources are often assumed to be starburst galaxies, but there is growing evidence that a substantial fraction host an AGN (i.e., an accreting super-massive black hole). We present here possibly the strongest evidence for this viewpoint to date: the combination of ultra-deep X-ray observations (the 2 Ms Chandra Deep Field-North) and deep optical spectroscopic data. We argue that upward of 38% of bright ( 5 mJy) SCUBA galaxies host an AGN, a fraction of which are obscured QSOs (i.e., erg s-1). However, using evidence from a variety of analyses, we argue that in almost all cases the AGNs are not bolometrically important (i.e., %). Thus, star formation appears to dominate their bolometric output. A substantial fraction of bright SCUBA galaxies show evidence for binary AGN activity. Since these systems appear to be interacting and merging at optical/near-IR wavelengths, their super-massive black holes will eventually coalesce.
1 Introduction
Blank-field SCUBA surveys have uncovered a large population of submillimetre (submm; = 300–1000 m) emitting galaxies ( 1000–10000 sources deg-2 at 1–5 mJy; e.g., [5,12,13,22,27,39]). The majority of these sources are faint at all other wavelengths, hindering source identification studies. However, due to a considerable amount of intensive multi-wavelength follow-up effort, it is becoming clear that almost all are dust-enshrouded galaxies at (e.g., [17,30,41,47]). With estimated bolometric luminosities of – , these galaxies outnumber comparably luminous local galaxies by several orders of magnitude.
Central to the study of submm galaxies is the physical origin of their extreme luminosities (i.e., starburst or AGN activity). If these sources are shown to be ultra-luminous starburst galaxies then their derived star-formation rates suggest a huge increase in star-formation activity at . Conversely, if these sources are shown to be ultra-luminous AGNs then they will outnumber comparably luminous optical QSOs by 1–2 orders of magnitude. Both of these scenarios provide challenges to models of galaxy formation and evolution.
2 Searching for AGN activity in SCUBA galaxies
It was initially expected that deep SCUBA surveys would identify large numbers of high-redshift ultra-luminous starburst galaxies. However, the first SCUBA source to be unambiguously identified via optical/near-IR spectroscopy was actually found to contain an obscured AGN, probably a BALQSO (i.e., the source SMMJ02399–0136; [28,44]); subsequent moderately deep Chandra observations showed that this AGN is luminous at X-ray energies ( erg s-1; [11]). Although clearly containing a powerful AGN, sensitive CO (3–2) observations of SMMJ02399–0136 suggested that star formation contributes 50% of the total bolometric luminosity [25]. The lesson learnt from SMMJ02399–0136 is that the identification of an AGN at optical/near-IR wavelengths does not necessarily imply that the AGN is bolometrically dominant.
Extensive optical follow-up observations of other SCUBA sources have revealed further AGNs, a few starburst galaxies, and many sources with uncertain classifications (e.g., [17,29,41]). Although clearly successful in identifying the presence of an AGN in some SCUBA galaxies, optical spectroscopy has a number of limitations for AGN identification in all SCUBA galaxies:
-
•
The large positional uncertainty of SCUBA sources often makes it challenging to identify an optical counterpart securely.
-
•
A large fraction of the SCUBA sources with secure optical counterparts are optically faint (), making optical source classification challenging despite success in redshift identification (e.g., [17]).
-
•
AGNs do not always show clear AGN signatures at optical wavelengths due to dust absorption and dilution by host-galaxy light (e.g., [20]).
Arguably the best discriminator of AGN activity is the detection of luminous hard X-ray emission (i.e., 2 keV).111Radio observations can also be useful in identifying AGNs in SCUBA galaxies; however, not all AGNs are bright at radio wavelengths, and radio emission from strong star formation can easily mask the radio emission from a radio-quiet AGN. Hard X-ray emission is relatively insensitive to obscuration (at least for sources that are Compton thin; i.e., cm-2), and any hard X-ray emission from star formation in the host galaxy is often insignificant when compared to that produced by the AGN. Hard X-ray observations can even provide a secure AGN identification in sources where the optical signatures and counterparts are weak or even non existent (e.g., [1]). Due to their high-energy X-ray coverage, high X-ray sensitivity, and excellent positional accuracy, the Chandra and XMM-Newton observatories offer the best opportunities for the X-ray investigation of SCUBA galaxies.
3 The promise of Chandra and XMM-Newton
The first cross-correlation studies of moderately deep X-ray surveys with deep SCUBA surveys yielded no overlap between the X-ray and submm detected source populations (10–20%; [24,26,38]).222Further cross-correlation studies with moderately deep X-ray observations have revealed some overlap [4,6,30,46]. This is probably due to the larger areal coverage of the SCUBA observations. This was somewhat contrary to expectations given that some submm galaxies clearly host an AGN. However, in retrospect, considering that the two most obvious AGNs identified via optical spectroscopy were both detected by Chandra (i.e., SMMJ02399–0134 and SMMJ02399–0136; [11,41]), AGN identification with moderately-deep X-ray observations had not performed any worse than that achieved via optical spectroscopy. These early studies concluded that a reasonable fraction of bolometrically dominant AGNs can only be present in the submm galaxy population if they are obscured by Compton-thick material. In this scenario, almost all of the direct emission from the AGN is obscured at X-ray wavelengths.
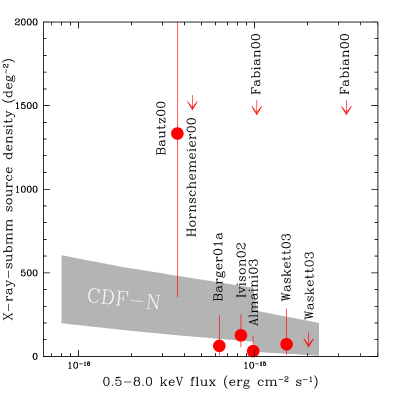
Later studies with the Chandra Deep Field-North (CDF-N; 1 Ms exposure: [15], 2 Ms exposure: [2]) survey showed that a significant fraction of submm galaxies are detected in ultra-deep X-ray observations [3,7]. In the 2 Ms Chandra exposure, seven (%) bright SCUBA galaxies ( 5 mJy; S/N4) had an X-ray counterpart in a 70.3 arcmin2 region centred around the CDF-N aim-point [3].333The X-ray sources were matched to radio-detected SCUBA and radio-undetected SCUBA sources using 1′′ and 4′′ search radii, respectively; the respective probabilities of projected chance associations are 1% and 4% per SCUBA source. At the time of this study, complete SCUBA observations across the 70.3 arcmin2 region were not available and only a lower limit on the X-ray-submm fraction could be placed. The X-ray detected submm galaxy fraction is 54% when the most complete SCUBA observations of [14] are used.
Figure 1 shows the X-ray detected submm galaxy source density versus X-ray flux for the X-ray-submm cross-correlation studies to date. Clearly, the detection of significant numbers of submm galaxies at X-ray energies requires deep or wide-area observations. For example, 15 ( 10–20%) SCUBA sources should have X-ray counterparts in the forthcoming 0.25 deg2 SHADES survey (P.I. J. Dunlop) of the XMM-Newton Subaru Deep Survey (XMM-SDS) region, even though the X-ray coverage is only moderately deep (50–100 ks XMM-Newton exposures; P.I. M. Watson).
4 The fraction of bright SCUBA galaxies hosting an AGN
On the basis of radio constraints, the expected X-ray luminosity from star formation in bright submm galaxies is – erg s-1 [3,9]. Since it is possible to detect sources of this luminosity out to 1–3 with the 2 Ms CDF-N survey, the detection of X-ray emission from a submm galaxy does not necessarily imply that it hosts an AGN. Indeed, two of the seven X-ray detected submm galaxies in [3] have X-ray properties consistent with those expected from star formation activity (i.e., soft and comparatively low luminosity X-ray emission that is correlated with the radio emission; see §3.2 in [3]). With X-ray luminosities of erg s-1, these would be the most X-ray luminous starburst galaxies known. The other five X-ray detected submm galaxies have X-ray properties consistent with those of obscured AGNs [i.e., hard (), luminous ( erg s-1) X-ray emission that is in excess of that expected from star formation]. Only one of these sources would have been classified as an AGN based on its optical properties, underlining the potency of ultra-deep X-ray observations in AGN identification. On the basis of these classifications at least 38% of bright ( 5 mJy) SCUBA galaxies host AGNs.
Interestingly, all of the radio-detected submm galaxies are X-ray detected while relatively few of the radio-undetected submm galaxies are X-ray detected. This X-ray-radio dichotomy is unlikely to be due to AGN activity since in almost all cases the radio emission appears to be dominated by star formation. Possible explanations for the X-ray-radio dichotomy are
-
1.
Some of the radio-undetected submm galaxies may be spurious. Due to the steep number counts at submm wavelengths most SCUBA sources are detected at a comparatively low significance.
-
2.
The radio emission from the radio-undetected submm galaxies may be extended and therefore “resolved out” in the radio observations.
-
3.
The radio-undetected submm galaxies might contain a cooler dust component, detected at submm wavelengths but corresponding to lower bolometric and radio luminosities when compared to hotter star-formation regions (e.g., cirrus emission; [13,23]).
-
4.
The radio-undetected submm galaxies may be essentially the same as the radio-detected submm galaxies but lie at higher redshifts.
A combination of these effects might explain the X-ray-radio dichotomy of submm galaxies. Explanation 1 is unlikely to affect significantly the results of [3] since only SCUBA sources with S/N4 were investigated. Explanations 2 and 3 would imply that the radio-undetected submm galaxies are different beasts to the radio-detected submm galaxies and might not typically host AGNs. Explanation 4 justifies the non detection of the radio-undetected submm galaxies at X-ray and radio wavelengths as due to a lack of sensitivity. Under this assumption in particular, the fraction of bright SCUBA galaxies hosting AGNs could be considerably higher than 38% (i.e., 75% if explanation 4 is correct and half of all bright submm galaxies are radio detected).
The closest local analogs to SCUBA galaxies are ultra-luminous infrared galaxies (ULIRGs: 1012 ; [37]). Based on spectroscopic classifications (optical: [43], mid-IR: [32]), it has been found that the fraction of ULIRGs hosting an AGN increases with luminosity [from 25% ( 1012–1012.3 ) to 50% ( 1012.3 )]. These AGN fractions are generally consistent with that found here for bright SCUBA galaxies.
5 What powers bright SCUBA galaxies?
The ultra-deep CDF-N studies showed that a significant fraction of submm galaxies host obscured AGNs. As discussed in §2 and §3, in order to determine if these AGNs are bolometrically dominant it is crucial to determine if the obscuration toward the AGN is Compton thick or Compton thin. The most direct discrimination between Compton-thick and Compton-thin absorption is made with X-ray spectral analyses. The X-ray spectrum of a Compton-thick AGN is generally characterised by a large equivalent width Iron K emission line ( 1 keV; e.g., [8,34]) and a flat or inverted () X-ray spectral slope, due to pure reflection.444A minority of Compton-thick AGNs have 0.5–1.0 keV [8]. By contrast, the X-ray spectrum of a Compton-thin AGN is usually well fitted by an absorbed power-law model and a smaller equivalent width Iron K emission line (generally 0.1–0.5 keV; e.g., [8,35]).
Basic X-ray spectral analyses were performed on the five submm galaxies hosting AGNs in the 2 Ms CDF-N study of [3]. Three of the sources showed the characteristics of Compton-thin absorption, one source was likely to be Compton thick, and the constraints for the other source were poor. A comparison of the X-ray-to-submm spectral slopes of these submm galaxies to those of three nearby luminous galaxies (Arp 220, a starburst galaxy; NGC 6240, an obscured AGN; 3C273, a quasar) suggested that the AGNs contributed only a small fraction of the bolometric luminosity (i.e., a few percent). However, although the study of [3] provided the tightest X-ray constraints on submm galaxies to date, only one source had a spectroscopic redshift [the rest of the sources had redshifts determined with the considerably less certain radio-submm photometric redshift technique (e.g., [16]), restricting more accurate and quantitative conclusions].
5.1 The X-ray properties of AGNs in bright SCUBA galaxies
Considerable progress in the optical identification of SCUBA galaxies has been recently made due to the pioneering deep optical spectroscopic work of [17,19]. By targeting radio and/or X-ray detected SCUBA galaxies, source redshifts for a sizable fraction of the submm galaxy population have now been obtained. CO emission line observations have confirmed that both the redshift and counterpart are correct in many cases (e.g., [36]; R. Genzel et al., these proceedings). The CDF-N field was one of the fields targeted for this intensive spectroscopic follow-up: optical spectroscopic redshifts have been obtained for 24 SCUBA galaxies in the CDF-N. The combination of this deep spectroscopic data with the 2 Ms CDF-N observations provides powerful constraints on AGNs in submm galaxies. In particular, reliable spectroscopic redshifts improve the accuracy of the X-ray spectral analyses through the identification of subtle X-ray spectral features and making comparisons in rest-frame energy bands. In these analyses we will focus on the sources, which are more typical of the general submm galaxy population [17].
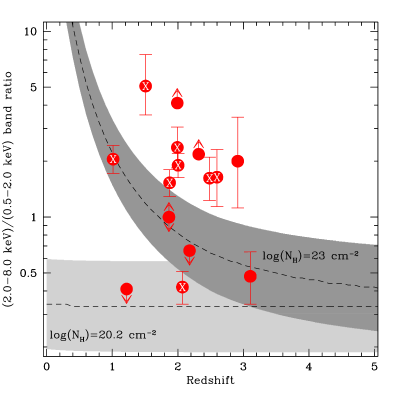
Fifteen of the 20 submm galaxies have X-ray counterparts: 12 ( 75%) of the 16 radio-detected submm galaxies have X-ray counterparts, continuing the X-ray-radio trend (see §4). Since some of the X-ray detected submm galaxies do not have enough counts for X-ray spectral analyses, we will first compare their X-ray band ratios [defined as the ratio of the hard-band (2–8 keV) to soft-band (0.5–2 keV) count rate] to those expected from a simple AGN model; see Figure 2. This figure has limited diagnostic utility because AGNs often have more complex spectra than that of power-law emission with differing amounts of absorption; however, it suggests that few of the sources are unabsorbed.
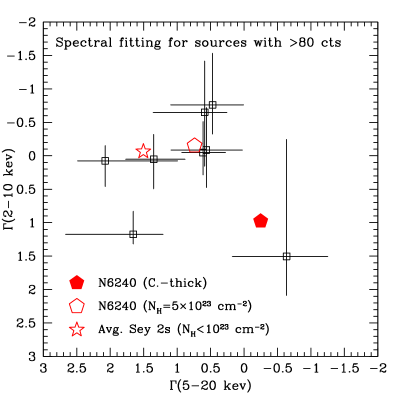
We have performed more detailed X-ray spectral analyses for the eight submm galaxies with X-ray counts; the X-ray spectra were extracted following the procedure outlined in [10]. In Figure 3 we compare their fitted rest-frame spectral slopes (in the 2–10 keV and 5–20 keV bands) to those found for nearby AGNs with differing amounts of absorption. Although this is still a relatively crude diagnostic, there are distinctions between Compton-thin and Compton-thick sources. Based on this analysis, the majority of the sources appear to be heavily obscured but still only Compton thin (i.e., few cm-2). We also searched for the presence of Iron K emission lines. The rest-frame equivalent-width constraints are generally quite weak: Iron K emission lines are possibly detected in two sources (with 0.7 keV and 1.7 keV) while the other six only have upper limits (all have 1.8 keV and five have 1.0 keV). From these analyses it appears unlikely that more than 3 of these 8 submm galaxies contain a Compton-thick AGN. We cannot say much about the individual X-ray properties of the seven X-ray-submm galaxies with X-ray counts; however, we note that since their band ratios are consistent with the sources for which we have performed X-ray spectral analyses, they probably have similar amounts of absorption (see Figure 2).
5.2 The bolometric AGN contribution to bright SCUBA galaxies
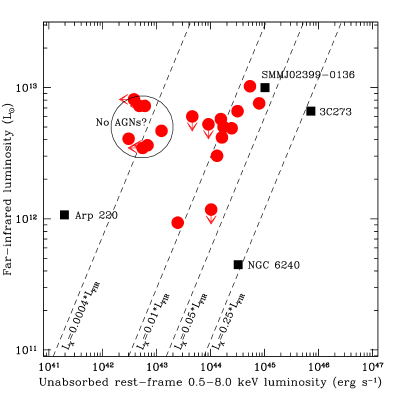
Based on these analyses, the full range of unabsorbed X-ray luminosities is – erg s-1; see Figure 4.555The corrections for absorption are generally a factor of 3. While a number of the sources have X-ray luminosities consistent with those of X-ray luminous starburst galaxies (i.e., no AGNs), the majority clearly host AGNs. The AGNs generally have X-ray luminosities consistent with those of Seyfert galaxies; however, three could be considered obscured QSOs (i.e., erg s-1).
We calculated rest-frame far-IR luminosities for all of the sources, following Equation 2 in [3] and assuming the local radio-far-IR correlation. The comparison of rest-frame far-IR luminosity with unabsorbed X-ray luminosity is shown in Figure 4. This figure provides an indicator of the AGN contribution to the bolometric luminosity.666When the radio emission has a large AGN component the far-IR luminosity will be overestimated and the AGN bolometric contribution will be underestimated; however, in general the radio emission appears to be star-formation dominated. Assuming that the far-IR emission from NGC 6240 and 3C273 is dominated by AGN activity, the AGNs in these submm galaxies contribute at most 20% of the bolometric luminosity and more typically a few percent. If instead we determine the AGN bolometric contributions based on the spectral energy distribution of SMMJ02399–0136 (i.e., 50%: [11,25]; see §2) then the AGN contributions increase by a factor of 2.5. Clearly, there is a range of X-ray to bolometric luminosity conversions for AGNs; however, on average the AGNs are unlikely to contribute more than 10–20% of the bolometric luminosity. Hence, although a large fraction of bright SCUBA galaxies host an AGN (i.e., at least 38%), in general, star formation is likely to dominate their bolometric output.
6 Evidence for binary AGN activity
An unexpected result in the 2 Ms study of [3] was that two ( 30%) of the seven X-ray detected submm galaxies were individually associated with X-ray pairs. The small angular separations of these pairs ( 2–3′′) correspond to just 20 kpc at (approximately one galactic diameter); the probability of a projected chance association is 1%. From HST imaging, it has been shown that the majority of SCUBA sources appear to be galaxies involved in major mergers (e.g., [18,21,29,40]). At X-ray energies we are presumably witnessing binary AGN activity fuelled by galaxy mergers that will ultimately lead to the coalescence of the super-massive black holes. Recent X-ray studies are only just beginning to show the late stages of binary AGN activity in AGNs at much lower redshifts (e.g., NGC 6240; [31]); however, in this ultra-deep X-ray observation we have good evidence that this is occurring at ! Since the smallest linear separation we can resolve with Chandra at 2 is 10 kpc, many of the other X-ray detected submm galaxies could be binary AGNs with smaller separations (e.g., the linear separation of the two AGNs in NGC 6240 is 1 kpc). Five ( 3%) of the 193 X-ray sources in this region are close X-ray pairs, showing that binary AGN behaviour appears to be closely associated with submm galaxies (see also [42]). Qualitatively, this picture is consistent with that expected for major merger activity.
References
- (1) Alexander, D. M., Brandt, W. N., Hornschemeier, A. E., et al. 2001, AJ, 122, 2156
- (2) Alexander, D. M., Bauer, F. E., Brandt, W. N., et al. 2003a, AJ, 126, 539
- (3) Alexander, D. M., Bauer, F. E., Brandt, W. N., et al. 2003b, AJ, 125, 383
- (4) Almaini, O., Scott, S. E., Dunlop, J. S., et al. 2003, MNRAS, 338 303
- (5) Barger, A. J., Cowie, L. L., Sanders, D. B. 1999, ApJ, 518, L5
- (6) Barger, A. J., Cowie, L. L., Mushotzky, R. F., et al. 2001a, AJ, 121, 662
- (7) Barger, A. J., Cowie, L. L., Steffen, A. T., et al. 2001b, ApJ, 560, L23
- (8) Bassani, L., Dadina, M., Maiolino, R., et al. 1999, ApJS, 121, 473
- (9) Bauer, F. E., Alexander, D. M., Brandt, W. N., et al. 2002, AJ, 124, 2351
- (10) Bauer, F. E., Vignali, C., Alexander, D. M., et al. 2003, Adv. Space Res., in press (astro-ph/0209415)
- (11) Bautz, M. W., Malm, M. R., Baganoff, F. K., et al. 2000, ApJ, 543, L119
- (12) Blain, A. W., Smail, I., Ivison, R. J., et al. 1999, MNRAS, 302, 632
- (13) Blain, A. W., Smail, I., Ivison, R. J., et al. 2002, Physics Reports, 369, 111
- (14) Borys, C., Chapman, S., Halpern, M., et al. 2003, MNRAS, 344, 385
- (15) Brandt, W. N., Alexander, D. M., Hornschemeier, A. E., et al. 2001, AJ, 122, 2810
- (16) Carilli, C. L., Yun, M. S. 1999, ApJ, 513, L13
- (17) Chapman, S. C., Blain, A. W., Ivison, R. J., Smail, I. R. 2003a, Nature, 422, 695
- (18) Chapman, S. C., Windhorst, R., Odewahn, S., et al. 2003b, ApJ, 599, 92
- (19) Chapman, S. C., et al. 2004, ApJ, submitted
- (20) Comastri, A., Mignoli, M., Ciliegi, P., et al. 2002, ApJ, 571, 771
- (21) Conselice, C. J., Chapman, S. C., Windhorst, R. A. 2003, ApJ, 596, L5
- (22) Cowie, L. L., Barger, A. J., Kneib, J.-P. 2002, AJ, 123, 2197
- (23) Efstathiou, A., Rowan-Robinson, M. 2003, MNRAS, 343, 322
- (24) Fabian, A. C., Smail, I., Iwasawa, K., et al. 2000, MNRAS, 315, L8
- (25) Frayer, D. T., Ivison, R. J., Scoville, N. Z., et al. 1998, ApJ, 506, L7
- (26) Hornschemeier, A. E., Brandt, W. N., Garmire, G. P., et al. 2000, ApJ, 541, 49
- (27) Hughes, D. H., Serjeant, S., Dunlop, J., et al. 1998, Nature, 394, 241
- (28) Ivison, R. J., Smail, I., Le Borgne, J.-F., et al. 1998, MNRAS, 298, 583
- (29) Ivison, R. J., Smail, I., Barger, A. J., et al. 2000, MNRAS, 315, 209
- (30) Ivison, R. J., Greve, T. R., Smail, I., et al. 2002, MNRAS, 337, 1
- (31) Komossa, S., Burwitz, V., Hasinger, G., et al. 2003, ApJ, 582, L15
- (32) Lutz, D., Spoon, H. W. W., Rigopoulou, D., et al. 1998, ApJ, 505, L103
- (33) Malizia, A., Bassani, L., Stephen, J. B., et al. 2003, ApJ, 589, L17
- (34) Matt, G., Brandt, W. N., Fabian, A. C. 1996, MNRAS, 280, 823
- (35) Nandra, K., George, I. M., Mushotzky, R. F., et al. 1997, ApJ, 477, 602
- (36) Neri, R. et al. 2003, ApJ, 597, L113
- (37) Sanders, D. B. & Mirabel, I. F. 1996, ARA&A, 34, 749
- (38) Severgnini, P., Maiolino, R., Salvati, M., et al. 2000, A&A, 360, 457
- (39) Smail, I., Ivison, R. J., Blain, A. W. 1997, ApJ, 490, L5
- (40) Smail, I., Ivison, R. J., Blain, A. W., Kneib, J.-P. 1998, ApJ, 507, L21
- (41) Smail, I., Ivison, R. J., Blain, A. W., et al. 2002, MNRAS, 331, 495
- (42) Smail, I., Scharf, C. A., Ivison, R. J., et al. 2003, ApJ, 599, 86
- (43) Veilleux, S., Kim, D.-C., Sanders, D. B. 1999, ApJ, 522, 113
- (44) Vernet, J., Cimatti, A. 2001, A&A, 380, 409
- (45) Vignati, P., Molendi, S., Matt, G., et al. 1999, A&A, 349, L57
- (46) Waskett, T. J., Eales, S. A., Gear, W. K., et al. 2003, MNRAS, 341, 1217
- (47) Webb, T. M. A., Lilly, S. J., Clements, D. L., et al. 2003, ApJ, 597, 680