[O iii]/[N ii] as an abundance indicator at high redshift
Abstract
Among ‘empirical’ methods of estimating oxygen abundances in extragalactic H ii regions, the use of the ratio of nebular lines of [O iii] and [N ii], first introduced by Alloin et al. in 1979, is reappraised with modern calibration data and shown to have certain advantages over ([O ii] + [O iii])/H and [N ii] /H, particularly when applied to star-forming galaxies at high redshifts.
keywords:
galaxies: abundances – ISM: abundances – H ii regions1 Introduction
Extragalactic H ii regions are central to the study of chemical abundances in the universe (e.g. Garnett 2004). Accurate abundance measurements require the determination of the electron temperature, which in turn is usually obtained from the ratios of auroral to nebular line intensities, such as [O iii] . This is often referred to as the ‘direct’ method. A well-known difficulty, however, arises from the fact that, as the metallicity increases, the electron temperature decreases (since the cooling is via metal lines) and the auroral lines eventually become too faint to measure. Detailed modelling can overcome this problem. For example, Kewley & Dopita (2002) have recently used a combination of stellar population synthesis and photoionization models to develop a set of ionization parameter and abundance diagnostics based only on the strong optical emission lines. Their ‘optimal’ method uses ratios of [N ii], [O ii], [O iii], [S ii], [S iii] and the Balmer lines, that is the full complement of strong nebular lines accessible from the ground. They also recommended procedures for the derivation of abundances in cases where only a subset of these lines is available.
The advent of 8-10 m class telescopes has made it possible to extend observations of these lines to galaxies at high redshifts (e.g. Teplitz et al. 2000; Pettini et al. 2001; Kobulnicky et al. 2003; Lilly, Carollo, & Stockton 2003; Steidel et al. 2004). At high redshift, however, the study of nebular emission encounters new obstacles. The first and obvious difficulty is that, given the much larger distances involved, the line fluxes are reduced dramatically. The problem is compounded by the fact that the lines are redshifted into the near-infrared wavelength region, where the sky background is orders of magnitude higher than in the optical. Second, at a given redshift only a subset of the strong lines will fall within an atmospheric window and thus be accessible from the ground. Even at particularly favourable redshifts, such as which shifts [O ii], [O iii] and H, and H and [N ii] respectively into the middle range of the , and bands, it is not possible to record all these lines in a single exposure. Rather, different spectrograph settings are normally required, and this can easily introduce additional errors in the relative flux calibrations. For all of these reasons, there are practical limitations to the accuracy with which emission line ratios can be measured in high redshift objects.
There is thus an incentive to explore simpler abundance indicators based on only a few emission lines—preferably close in wavelength—which, while admittedly less accurate than the full treatments mentioned above, may still be adequate to characterise the chemical enrichment of distant galaxies. The idea of such indicators goes back to a fundamental paper by Searle (1971) who, noting some measurements of nebular [O iii] lines in M33 by Aller (1942), himself found a systematic increase in [O iii]/H and a corresponding decrease in [N ii]/H with galactocentric distance as a generic property of giant H ii regions in late-type spiral galaxies. Searle pointed out that these trends were most likely due to radial abundance gradients, thereby raising the possibility of using these line ratios more generally as indicators of abundance. Such indicators can be calibrated against more secure abundance determinations, based on auroral line measurements or on detailed photoionization models, to establish their typical accuracy; for this reason they are often referred to as ‘empirical’ methods. The first exploration of such a method was by Jensen, Strom & Strom (1976) who considered the ratio [O iii]/H. The subsequent extension of this idea by Pagel et al. (1979), who included [O ii], led to the most widely used abundance indicator, the index which relates the abundance of oxygen to the ratio of ([O ii] + [O iii]) to H. In the last 25 years there have been many efforts to refine the calibration of . The most successful are the calibration by McGaugh (1991) which is based on photoionisation models and the empirical one by Pilyugin (2003); both improve the accuracy by making use of the [O iii]/[O ii] ratio as an ionisation parameter. Even so, systematic differences of up to 0.5 dex remain between the oxygen abundances derived from the index and those deduced from the ‘direct’ method (e.g. Skillman, Côté, & Miller 2003; Kennicutt, Bresolin, & Garnett 2003). When compounded with the well-known double-valued behaviour of (O/H) vs. , this can lead to order of magnitude uncertainties in (O/H) in galaxies at (Pettini et al. 2001).
Partly to circumvent this latter problem, analogous ([S ii] + [S iii])/H (Vílchez & Esteban 1996; Christensen, Petersen, & Gammelgaard 1997; Díaz & Pérez-Montero 2000) and ([S ii] + [S iii]+ [S iv])/H (Oey et al. 2002) indices have been proposed. Although these sulphur-line based indices turn over at higher metallicities than , the sulphur lines are weaker than their oxygen counterparts and their red and infrared rest wavelengths place them beyond the reach of ground-based observations at redshifts .
More promising are methods which involve [N ii] and H. In this paper we reconsider the index ( log{[N ii] /H}) recently discussed by Denicoló, Terlevich, & Terlevich (2002), and show how its accuracy can be further improved in the high abundance regime by comparison with [O iii] /H.
2 The index
Following up on earlier work by Storchi-Bergmann, Calzetti, & Kinney (1994) and by Raimann et al. (2000), Denicoló et al. (2002) have focussed attention again on the index, pointing out its usefulness in the search for low metallicity galaxies. The [N ii]/H ratio is highly sensitive to the ‘metallicity’, as measured by the oxygen abundance (O/H), through a combination of two effects. As (O/H) decreases below solar, there is a tendency for the ionization to increase (either from hardness of the ionizing spectrum or from the ionization parameter, or both), decreasing the ratio [N ii]/[N iii], and, furthermore, the (N/O) ratio itself decreases at the high-abundance end because of the secondary nature of nitrogen (e.g. Henry, Edmunds, & Köppen 2000; Pettini et al. 2002a). From the ground, H and [N ii] can be followed all the way to redshift (the limit of the band). With thousands of galaxies now known at (Madgwick et al. 2003; Steidel et al. 2004; Abraham et al., in preparation), the index offers the means to determine metallicities in a wholesale manner over look-back times which span most of the age of the universe. It is thus worthwhile reconsidering its accuracy.
Denicoló et al. (2002) compiled an extensive sample of nearby extragalactic H ii regions which could be used to calibrate vs. (O/H). We have revised their database by: (i) including only H ii regions with values of (O/H) determined either via the method or with detailed photoionization modelling, and excluding the untabulated estimates for H ii regions from the catalogue of Terlevich et al. (1991), because for many of these (O/H) had been estimated from ‘empirical’ (i.e. or ) indices; (ii) updating it with recent measurements by Kennicutt et al. (2003) for H ii regions in M 101 and by Skillman et al. (2003) for dwarf irregular galaxies in the Sculptor Group.
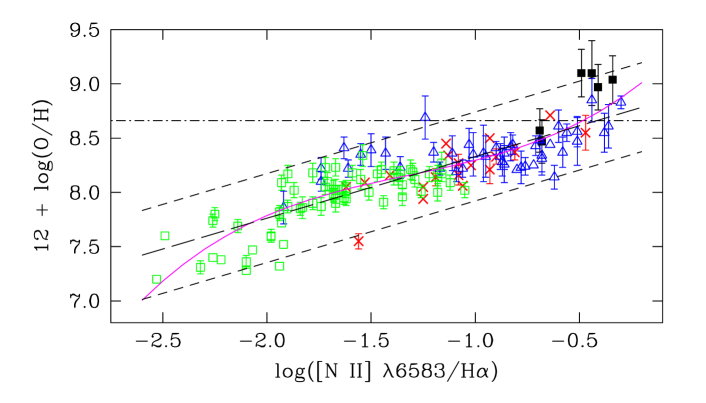
The total sample, shown in Figure 1, consists of 137 extragalactic H ii regions with well determined values of (O/H) and . In all but six cases (shown with filled symbols) the oxygen abundance was determined with the method. References to the original works are given in the Figure caption. It can be readily appreciated from Figure 1 that, while does indeed increase monotonically with , a linear relationship is only an approximate representation of the data, which rather tend to lie along an S-shaped curve. In particular, when (O/H) , the value of can span one order of magnitude, from to , whereas at solar metallicity and beyond [N ii] tends to saturate (Baldwin, Phillips & Terlevich 1981) because it comes to dominate the cooling (Kewley & Dopita 2002). Forcing a linear fit to the sample,111We performed an unweighted least squares fit to the data because in compilations such as this the error estimates are highly heterogeneous. However, a weighted least squares fit gives very similar results. we obtain a line of best fit according to the relation:
| (1) |
shown with the long-dash line in Figure 1. Both the slope and the intercept are lower than the values of the fit by Denicoló et al. (2002) who proposed . While the formal statistical errors on the slope and intercept are small (0.03 and 0.04 respectively), of more interest is the dispersion of the points about the line of best fit in Figure 1. Specifically, 95% (68%) of the measurements of lie within () of the line defined by eq. (1); the limits are shown as short-dash lines in Figure 1. Only a marginally better fit to the data is provided by a third order polynomial of the form:
| (2) |
(valid in the range ), with 95% (68%) of the measurements being within () of the values given by eq. (2). This cubic fit is indicated by the continuous line in Figure 1. We conclude that with the calibrator it is possible to estimate the abundance of oxygen to within a factor of at the 95% confidence level. This accuracy is comparable to that of the method.
3 The Index
We now consider to what degree the accuracy in the determination of (O/H) can be improved by considering two ratios, [N ii]/H and [O iii]/H. Alloin et al. (1979) were the first to introduce the quantity {([O iii] /H)/ ([N ii] /H)},222This definition is slightly different from the original one proposed by Alloin et al. (1979) who included both [O iii] doublet lines in the numerator of the first ratio. but since then the index has been comparatively neglected in nebular abundance studies. There is now a sufficient body of high quality data to reassess its merits. We expect the inclusion of [O iii] to be most useful in the high metallicity regime where [N ii] saturates but the strength of [O iii] continues to decrease with increasing metallicity.
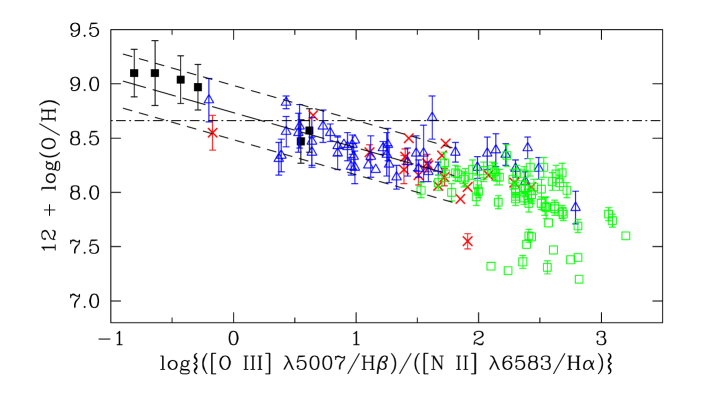
Figure 2 shows how varies with (O/H) for the 137 extragalactic H ii regions in our sample. Clearly this method is of little use when , but at lower values there appears to be a relatively tight, linear and steep relationship between and . A least squares linear fit to the data in the range yields the relation:
| (3) |
which is shown by the long-dash line in Figure 2, with 95% (68%) of the measurements within 0.25 (0.14) dex of the best fit line; the short-dash lines in Figure 2 show the limits. The caveats are that the statistics are somewhat limited, with only 65 out of the 137 H ii regions in our sample satisfying the condition , and that the relationship defined by eq. (3) relies heavily on the four data points with deduced from photoionisation models rather than the ‘direct’ method. Nevertheless, in the high metallicity regime the method appears promising and it would be very worthwhile extending the database of nearby H ii region measurements to improve its statistics.
4 Conclusions
In this note we have reassessed the usefulness of ‘empirical’ methods based on the [N ii]/H ratio for determining the oxygen abundance in H ii regions, particularly with an eye to their application to the analysis of star-forming galaxies at high redshift. We have revised the extensive compilation prepared by Denicoló et al. (2002) to include only H ii regions where the oxygen abundance is believed to be known reliably, either because the electron temperature has been determined with high precision, or through detailed modelling of the ionisation of the nebula. Our main conclusions are as follows.
1. The relationship between ([N ii] /H) and is only approximately linear and yields (with the revised data set considered here) estimates of (O/H) which are only accurate to within dex at the 95% confidence level. This level of precision is comparable to that of the more widely used method.
2. At moderate to high metallicities, greater than solar, the oxygen abundance can be deduced to within a factor of dex (again at the 95% confidence level) if {([O iii] /H)/([N ii] /H)} is lower than . The index is particularly useful at solar and super-solar metallicities, where saturates.
When applied to high redshift galaxies, the and indices offer several advantages compared to the more familiar method. First, the N-based indices have a monotonic behaviour with (O/H), overcoming the ambiguities introduced by the double-valued character of . Second, both and rely on ratios of emission lines which are close in wavelength, so that corrections for reddening, and accurate flux calibration of the spectra, are not necessary. Third, both indices are highly sensitive to the oxygen abundance and are thus particularly well suited to the analysis of data of only moderate signal-to-noise ratio. Specifically, the slope of 0.57 of the relationship between and implies that one only needs to measure the [N ii]/H ratio with an accuracy of about 25%. Better precision would not improve the estimate of (O/H) since the random error would then be of minor importance relative to the systematic uncertainty of dex in the method. Similar considerations apply to the index which is inherently more accurate in the high metallicity regime and varies even more steeply with .
The high sensitivity of to the oxygen abundance also helps to mitigate another complication which may arise preferentially at high redshift. The galaxies accessible to detailed spectroscopic studies at redshifts support very high rates of star formation, one to two orders of magnitude higher than those seen in the local universe (e.g. Steidel et al. 2003, 2004). There are also mounting indications that, even at these early epochs, such galaxies have already reached near-solar metallicities (e.g. Pettini 2004). When galactic chemical evolution proceeds at such a fast pace, the production of primary nitrogen from intermediate and low mass stars can lag behind that of oxygen from Type II supernovae, as found by Pettini et al. (2002b) in the Lyman break galaxy MS1512-cB58 (see also Matteucci & Pipino 2002). How far (N/O) is ‘out of equilibrium’ depends on the metallicity, the star formation rate, and the yet poorly constrained timescale for the release of primary nitrogen (e.g. Meynet & Pettini 2003). However, even in cases where N is over-deficient relative to O by factors of 2–3, as in MS1512-cB58, the slope of in the relation vs. limits the error in to (given that ([N ii]/H) varies linearly or slower with the nitrogen abundance in this regime).
Finally, it is encouraging
that abundance calibrators developed from measurements
in individual extragalactic H ii regions seem to be
fairly robust when applied to the integrated light
of galaxies (Kobulnicky, Kennicutt, & Pizagno 1999;
Moustakas & Kennicutt, in preparation).
Thus, we propose that, with the aid of the index,
it should be possible to measure the oxygen abundances
of star forming galaxies at
to better than a factor of two with only a relatively modest
investment in observing time.
We are grateful to Chris Akerman, Mike Irwin and Samantha Rix for help with the production of the figures, and to Mike Dopita, Lisa Kewley and Chuck Steidel for valuable comments.
References
- [] Allende-Prieto, C., Lambert, D. L. & Asplund, M. 2001, ApJ, 556, L63
- [] Aller, L. H. 1942, ApJ, 95, 52
- [] Alloin, D., Collin-Souffrin, S., Joly, M., & Vigroux, L. 1979, A&A, 78, 200
- [] Asplund, M., Grevesse, N., Sauval, A. J., Allende Prieto, C. & Kiselman, D. 2004, A&A, in press (astro-ph/0312290)
- [] Baldwin, J., Phillips, M. M. & Terlevich, R. J. 1981, PASP, 93, 5
- [] Campbell, A., Terlevich, R. & Melnick, J. 1986, MNRAS, 223, 811
- [] Castellanos, M., Díaz, A. I., & Terlevich, E. 2002a, MNRAS, 329, 315
- [] Castellanos, M., Díaz, A. I., & Terlevich, E. 2002b, MNRAS, 337, 540
- [] Christensen, T., Petersen, L. & Gammelgaard, P. 1997, A&A, 322, 41
- [] Denicoló, G., Terlevich, R., & Terlevich, E. 2002, MNRAS, 330, 69
- [] Díaz, A. I. & Pérez-Montero, E. 2000, MNRAS, 312, 130
- [] Díaz, A. I., Terlevich, E., Vílchez, J. M,, Pagel, B. E. J. & Edmunds, M. G. 1991, MNRAS, 253, 245
- [] Garnett, D. R. 1990, ApJ, 363, 142
- [] Garnett, D. R. 2004, in Cosmochemistry: The Melting Pot of Elements (Cambridge: Cambridge Univ. Press), in press (astro-ph/0211148)
- [] Garnett, D. R., Shields, G. A., Skillman, E. D., Sagan, S. P. & Dufour, R. J. 1997, ApJ, 489, 63
- [] González-Delgado, R. M. et al. 1994, ApJ, 437, 239
- [] González-Delgado, R. M., Pérez, E., Díaz, A. I., García-Vargas, M. L., Terlevich, E., & Vilchez, J. M. 1995, ApJ, 439, 604
- [] Henry, R. B. C., Edmunds, M. G., & Köppen, J. 2000, ApJ, 541, 660
- [] Izotov, Y. I., Thuan, T.-X. & Lipovetsky, V. A. 1994, ApJ, 435, 647
- [] Jensen, E. B., Strom, K. M., & Strom, S. E. 1976, ApJ, 209, 748
- [] Kennicutt, R. C., Bresolin, F. & Garnett, D. R. 2003, ApJ, 591, 801
- [] Kewley, L. J. & Dopita, M. A. 2002, ApJS, 142, 35
- [] Kniazev, A. Y. et al. 2000, A&A, 357, 101
- [] Kobulnicky, H. A. et al. 2003, ApJ, in press (astro-ph/0310346)
- [] Kobulnicky, H. A., Kennicutt, R. C., & Pizagno, J. L. 1999, ApJ, 514, 544
- [] Kobulnicky, H. A. & Skillman, E. D. 1996, ApJ, 471, 211
- [] Kunth, D. & Joubert, M. 1985, A&A, 142, 411
- [] Lilly, S. J., Carollo, C. M., & Stockton, A. N. 2003, ApJ, 597, 730
- [] Madgwick, D. S. et al. 2003, ApJ, in press (astro-ph/0305587)
- [] Mathis, J. S., Chu, Y.-S. & Peterson, D. E. 1985, ApJ, 292, 155
- [] Matteucci, F. & Pipino, A. 2002, ApJ, 569, L69
- [] McGaugh, S. 1991, ApJ, 380, 140
- [] Meynet, G., & Pettini, M. 2003, in IAU Symp. 215: Stellar Rotation, ed. A. Maeder & P. Eenens, in press (astro-ph/0301287)
- [] Oey, M.S., Shields, J.C., Dopita, M.A. & Smith, R.C. 2002, Rev. Mex. AA (Serie de Conferencias), 12, 77
- [] Pagel, B. E. J., Edmunds, M. G., Blackwell, D. E., Chun, M. S., & Smith, G. 1979, MNRAS, 189, 95
- [] Pagel, B. E. J., Edmunds, M. G. & Smith, G. 1980, MNRAS, 193, 219
- [] Pagel, B. E. J., Simonson, E. A., Terlevich, R. J. & Edmunds, M. G. 1992, MNRAS, 255, 325
- [] Pastoriza, M. G., Dottori , H. A., Terlevich, E., Terlevich, R. & Díaz, A. I. 1993, MNRAS, 260, 177
- [] Pettini, M. 2004, in Cosmochemistry: The Melting Pot of Elements (Cambridge: Cambridge Univ. Press), in press (astro-ph/0303272)
- [] Pettini, M., Ellison, S. L., Bergeron, J., & Petitjean, P. 2002a, A&A, 391, 21
- [] Pettini, M., Rix, S. A., Steidel, C. C., Adelberger, K. L., Hunt, M. P., & Shapley, A. E. 2002b, ApJ, 569, 742
- [] Pettini, M., Shapley, A. E., Steidel, C. C., Cuby, J., Dickinson, M., Moorwood, A. F. M., Adelberger, K. L., & Giavalisco, M. 2001, ApJ, 554, 981
- [] Pilyugin, L. 2003, A&A, 399, 1003
- [] Raimann, D., Storchi-Bergmann, T., Bica, E., Melnick, J. & Schmitt, H. 2000, MNRAS, 316, 559
- [] Searle, L. 1971, ApJ, 168, 327
- [] Shaver, P. A., McGee, R. X., Newton, L. M., Danks, A. C. & Pottasch, S. R. 1983, MNRAS, 204, 53
- [] Skillman, E. D., Côté, S., & Miller, B. W. 2003, AJ, 125, 610
- [] Skillman, E. D. & Kennicutt, R. C. 1993, ApJ, 411, 655
- [] Skillman, E. D., Terlevich, R. J., Kennicutt, R. C., Garnett, D. R. & Terlevich, E. 1994, ApJ, 431, 172
- [] Steidel, C. C., Adelberger, K. L., Shapley, A. E., Pettini, M., Dickinson, M., & Giavalisco, M. 2003, ApJ, 592, 728
- [] Steidel, C. C., Shapley, A. E., Pettini, M., Adelberger, K. L., Erb, D. K., Reddy, N. A., & Hunt, M. P. 2004, ApJ, in press
- [] Storchi-Bergmann, T., Calzetti, D. & Kinney, A. L. 1994, ApJ, 429, 572
- [] Teplitz, H. I. et al. 2000, ApJ, 533, L65
- [] Terlevich, R., Melnick, J., Masegosa, J., Moles, M. & Copetti, M. V. F. 1991, A&AS, 91, 285
- [] Thuan, T. X., Izotov, Y. I. & Lipovetsky, V. A. 1995, ApJ, 445, 108
- [] van Zee, L. 2000, ApJ, 543, L41
- [] Vílchez, J. M. & Esteban, C. 1996, MNRAS, 280, 720
- [] Vílchez, J. M., Pagel, B. E. J., Díaz, A. I., Terlevich, E. & Edmunds, M. G. 1988, MNRAS, 235, 633
- [] Walsh, J. M. & Roy, J.-R. 1989, MNRAS, 239, 297