Integral Field Spectroscopy of Extended Ly Emission from the DLA Galaxy in Q2233+131
This paper presents observations of an extended Lyman- emission nebula surrounding the galaxy responsible for the Damped Lyman- Absorption (DLA) line in the spectrum of the quasar Q2233+131. With the Potsdam Multi Aperture Spectrophotometer (PMAS) we measure the properties of the extended Ly emission in an area of 3″″ having a total line flux of erg cm-2 s-1, which at redshift corresponds to a luminosity of ( erg s-1 and a size of 2338 kpc. The location of the emission is spatially coincident with the previously detected DLA galaxy, but extends significantly beyond its limb. We argue that the Ly emission is likely to be caused by an outflow from the DLA galaxy, presumably powered by star formation. In the case of negligible dust extinction, the Ly luminosity indicates a star-formation rate of M⊙ yr-1 consistent with that derived from the UV continuum flux from the parent galaxy. The wind velocity indicated by the integral field spectra is of the order of several hundred km s-1. We find no indication of emission originating in a rotating disk.
Key Words.:
galaxies: high redshift – galaxies: quasars: absorption lines – galaxies: kinematics and dynamics – galaxies: quasars: individual: Q2233+1311 Introduction
High redshift quasars (QSOs) show multiple absorption lines bluewards of the redshifted 1216 Å Lyman (Ly) wavelength. Known as the Lyman forest, this is caused by absorption in neutral hydrogen clouds along the line of sight towards the QSO. Clouds having column densities larger than 21020cm-2 give rise to line profiles with broad wings characteristic of damped Ly lines. To date approximately 150 Damped Ly Absorbers (DLAs) with redshifts of have been confirmed (Curran et al. 2002). It has been found that DLAs contain a significant fraction of total gas mass compared to the mass of the stars in present day galaxies (Wolfe et al. 1995; Storrie-Lombardi et al. 1996; Storrie-Lombardi & Wolfe 2000), and it is questioned whether there is a significant evolution with redshift (Rao & Turnshek 2000). Spectroscopic observations have shown that the DLAs have metallicities of 0.01–1 times solar with a mild increase with decreasing redshift (Prochaska et al. 2003), suggesting that DLAs are star-forming objects. Nevertheless, the relation between DLAs and galaxies is not well understood. At higher redshifts, the DLA galaxies have been suggested to be thick disks or the progenitors of present day spirals galaxies (Wolfe et al. 1986), while others suggest that the counterparts could be dwarfs (Hunstead et al. 1990), or galaxy building blocks in a hierarchical merging scenario (Haehnelt et al. 1998).
Many investigations have been performed in order to establish what the galaxy counterparts to the DLAs resemble most (e.g. Le Brun et al. 1997; Warren et al. 2001; Colbert & Malkan 2002). Typically, deep broad-band or narrow-band imaging of the fields containing the DLAs has been carried out, and objects near the line of sight of the QSOs are detected after subtraction of the QSO point spread function. These candidate DLA galaxies are typically faint. Successive follow-up spectroscopy of the candidates is required to reveal whether or not they have the same redshift as the DLA line. Only in 4 cases DLA galaxies have been confirmed this way for the high redshift () DLA galaxies (Møller & Warren 1993; Djorgovski et al. 1996; Fynbo et al. 1999; Møller et al. 2002). In two additional cases Ly emission lines have been detected in the troughs of the DLA lines in the QSO spectra (Leibundgut & Robertson 1999; Ellison et al. 2002).
We here present a study of the Q2233+131 at , which has a DLA line at (Sargent et al. 1989). The metallicity of the DLA is [Fe/H] = –1.4 (Lu et al. 1997), and the column density of H I is below the classical limit of a DLA line, having cm-2, thus formally characterizing this as a Lyman-Limit system. In accordance with previous papers on this object we will continue to denote it a DLA absorber. A candidate galaxy responsible for the absorption was found at an impact parameter of 23 using the Lyman break technique, suggesting a redshift larger than 3 (Steidel et al. 1995). This object was confirmed as the absorbing galaxy having the same redshift as the DLA line (Djorgovski et al. 1996, hereafter D96). These authors measured a Ly line flux of ( erg cm-2 s-1 in a Keck long-slit spectrum and found the magnitudes of the Lyman break galaxy of and . Warren et al. (2001) found for the galaxy using near-IR photometry with the HST/NICMOS, and Møller et al. (2002) found with STIS images.
With integral field spectroscopy the conventional two step approach for confirming a DLA galaxy can be avoided. A previous attempt to use this technique only yielded an upper limit for the line emission from the DLA galaxy in BR 1202–0725 (Petitjean et al. 1996), while the spectral range of the observations of the DLA system in APM~08279+5255 did not cover the appropriate wavelengths for the redshifted Ly emission (Ledoux et al. 1998). We show here that with the Potsdam Multi Aperture Spectrophotometer (PMAS) instrument we not only detect Ly emission from the DLA galaxy at , but we find that the object causing the Ly emission is extended, and the line flux is larger than reported previously in the literature.
In Sect. 2 of this paper we will describe the spectroscopic observations, and the procedures for reducing the data. We analyse the spectra of the QSO and the extended emission from the DLA in Sects. 3 and 4, respectively, addressing the nature of the extended emission. The relation between the Ly emission and the location of the DLA galaxy seen in high spatial resolution Hubble Space Telescope (HST) images is described in Sect. 5. Similarities with other Ly emitting objects are described in Sect. 6, which leads to possible interpretations for the origin of the extended Ly nebula in Sect. 7. The ionised gas mass in the nebula is estimated in Sect. 8. In Sect. 9 we present our conclusions.
Throughout the paper we assume a flat Universe with km s-1 Mpc-1, , and . The redshift then corresponds to a luminosity distance of cm (27.0 Gpc), 1″ corresponds to a linear size of 7.6 kpc, and the look-back time is 11.5 Gyr.
2 Observations and data reduction
The PMAS integral field instrument uses two cameras: A cryogenic acquisition and guiding camera (A&G camera) that can be used for imaging in addition to the integral field spectrograph (IFS) (Roth et al. 2000). The A&G camera has a SITe TK1024 chip with 1k1k pixels with a scale of 02 per pixel giving a field of view of 3434. The PMAS spectrograph is equipped with 256 fibers coupled to a 1616 lens array, that we used with a spatial sampling of 0505 per fiber on the sky, resulting in a field of view of 8″8″. The spectrograph camera has a SITe ST002A 2k4k CCD and its 256 spectra have a FWHM of 2 pixels when using a 22 binned read-out mode. The spectra are aligned on the CCD with 7 pixels between adjacent spectra making cross-contamination negligible.
PMAS is mounted on the 3.5m telescope at Calar Alto. We observed Q2233+131 on Sep. 2 2002 for a total of 7200 s (41800 s) at an airmass between 1.094 and 1.15 and a seeing between 10 and 13 measured by the A&G camera. Using a 300 gr/mm grating yielded a spectral resolution of 6 Å while the grating was set to cover the wavelength range of 3930–7250 Å. Calibration images were obtained following the science exposures and consisted of spectra of emission line lamps (HgNe), and spectra of a continuum lamp needed to locate the 256 individual spectra on the CCD. Observations of the spectrophotometric standard stars BD~+28$^∘$4211 and Hz4 were obtained during the night for flux calibration.
Reduction of the data was done in IDL with P3D_online, a software package written specifically for reducing PMAS data (Becker 2002). After bias subtraction the 256 spectra were extracted from the two-dimensional frames. Wavelength calibration was performed using the emission line lamp spectra. For the flat fielding the average transmission of each fiber was determined using exposures of the sky at twilight. Cosmic ray hits were removed from each of the 4 files using the L.A.Cosmic routine within IRAF (van Dokkum 2001), and the rejected pixels were inspected by eye checking that no pixels close to the Ly emission line were affected. The data cubes were corrected for the effect of differential atmospheric refraction using the formula of Filippenko (1982). Given the small airmass of Q2233+131 during the observation the effect is small, but not negligible at long wavelength intervals. At the wavelength of the DLA line the effect can be ignored, since this was the reference wavelength for estimating the relative offsets before combining the 4 frames. This method ensures that the position of the DLA galaxy relative to the centroid of the QSO at other wavelengths is not shifted. In the end the four files were co-added, resulting in a data cube of dimensions 16161024 pixels.
For subtraction of the sky background, an average background spectrum was created by co-adding several spectra at the edge of the field of view, uncontaminated by the QSO flux, and subtracted from all 256 individual spectra. All further data calibration was done using IRAF. For the standard star observations we coadded all spectra within a radial aperture of 3″, and compared the one-dimensional standard star spectrum with table values to create a sensitivity function taking into account the atmospheric extinction typical for Calar Alto (Hopp & Fernandez 2002). Finally, the spectra were flux calibrated using this sensitivity function.
Further analysis and inspection of the data was performed with the “Euro3D Visualization Tool”, which is a very efficient tool made for visualizing integral field data (Sánchez 2003).
3 The QSO spectrum
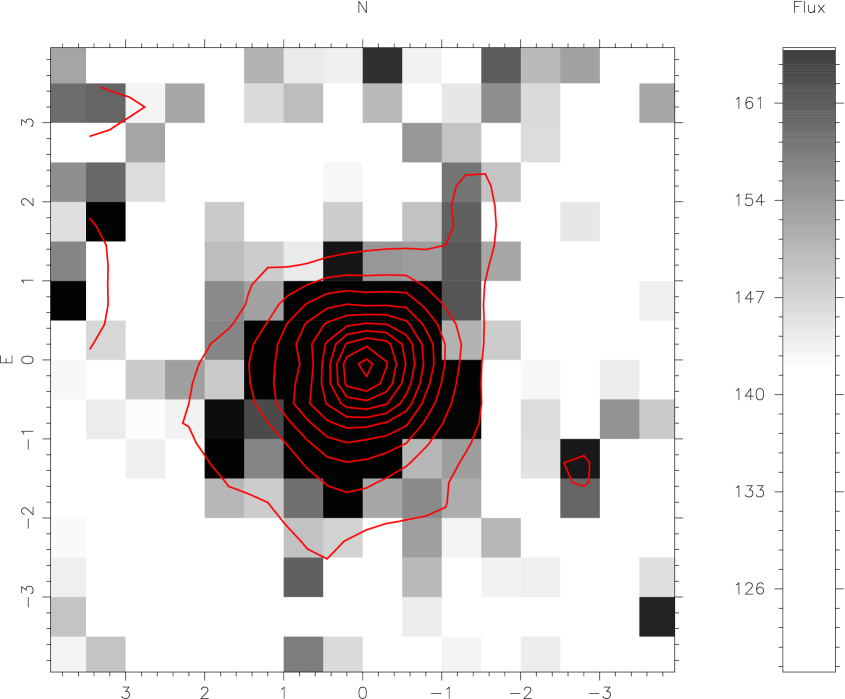
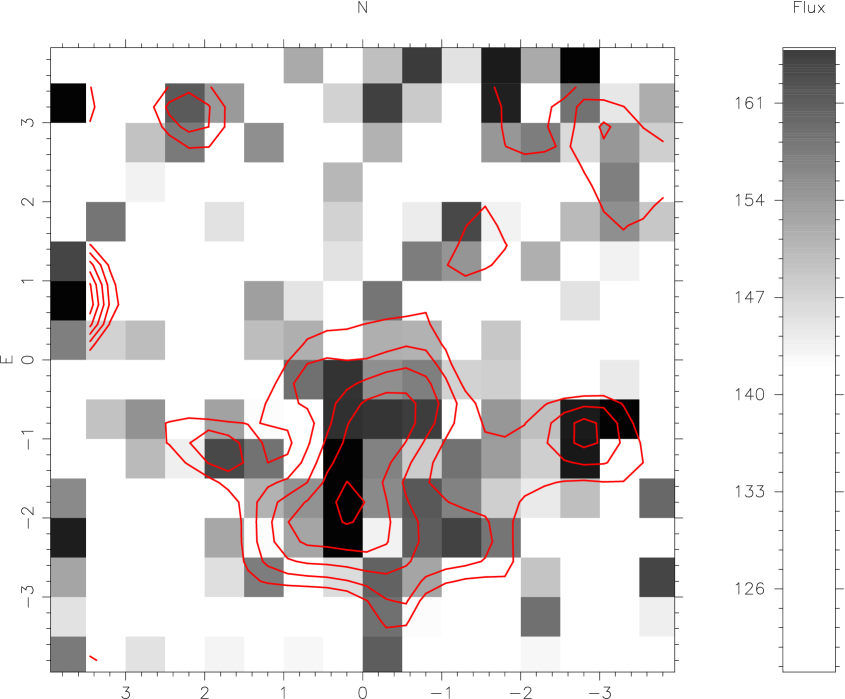

We constructed narrow band images by selecting appropriate wavelength intervals in the combined 3D data cube, resulting in images with 1616 spatial pixels (“spaxels”). In Fig. 1 such an image of Q2233+131 is shown in the wavelength range 5200–5300 Å. For creating a one-dimensional object spectrum one can select spaxels in this image, each of which represents a single spectrum, and co-add the selected spectra.
For comparison with later spectra we created a combined spectrum of Q2233+131 by co-adding all spectra within a radial aperture of 2″ (45 spaxels) in Fig. 1. An overall aperture correction of 2% was applied, and the resulting spectrum is shown in Fig. 2.
We detect many absorption features from metal lines in the spectrum of the QSO associated with the DLA system, some of which were already recognized in D96. The redshifts of these lines, listed in Table 1, matches the redshift of the DLA line. We derive a mean systemic redshift from the all metal lines in the DLA apart from the Si IV and O IV 1400 Å blend which has a larger offset than the low ionization species. A detailed analysis of the metallicity and column densities is outside the scope of this paper, as higher spectral resolution would be necessary for this purpose. For the same reason the Ly absorption line is blended with the Lyman forest. The dip seen in the tip on the Ly emission from the QSO is probably caused by Si II 1260 Å at the redshift of the DLA system.
In addition to the absorption lines we find broad emission lines from Ly, N V 1240, Si IV + O IV 1400 Å and C IV 1549 Å from the QSO. Including these four lines we find the redshift for the QSO.
| Ion | [Å] | ||
|---|---|---|---|
| Ly | 1215.67 | 3.2949 | |
| N V | 1238.82, 1242.80 | 3.2840 | |
| Si IV + O IV] (blends) | 1400 | 3.2881 | |
| C IV | 1548.20, 1550.78 | 3.2838 | |
| Ly | 1215.67 | 3.1476 | |
| Si II | 1260.42 | 3.1468 | |
| O I | 1302.16 | 3.1479 | |
| C II | 1334.53 | 3.1476 | |
| Si IV | 1400 | 3.1490 | |
| Si II | 1526.71 | 3.1485 | |
| C IV | 1548.20, 1550.78 | 3.1477 | |
| Al II | 1670.789 | 3.1478 | |
| Ly(DLA galaxy) | 1215.67 | 3.1538 |
4 The spectrum of the DLA galaxy

In Fig. 1 we show another narrow-band image, this time selected from the wavelength interval 5040–5055 Å, corresponding to the absorption trough in the QSO spectrum. An extended object is visible to the south and south-west of the location of the QSO. The size of this object is roughly 5″, however, some of the extended object emission is due to the presence of emission in the red wing of the DLA line from the QSO. We note that the very high signal which appears at the left edge of the field with coordinates (3.5,1) is due to a bad flat-field effect of one single fiber, which has a lower overall transmission.
We have added 35 spaxels which are apparently associated with the emission line object. A part of the spectrum around the emission line is shown in the upper panel in Fig. 3 where one clearly sees an emission line at 5050 Å. This wavelength corresponds to Ly at the redshift of the DLA line at , in agreement within 1 with the redshift published in D96. A second line is present at 5200 Å which is caused by the Ly emission from the QSO at a distance of 2″. For comparison the same section of the QSO spectrum is shown in the middle panel in Fig. 3. There appears to be another broad absorption line at 5000 Å, but a high resolution spectrum of the QSO has shown that this feature is caused by a blend of 5–6 individual absorption lines (Bechtold 1994). The lower panel shows the spectrum of the DLA where a scaled spectrum of the QSO has been subtracted. In fact, the Ly emission line at 5050 Å is effected very little by this subtraction.
The spectra were analysed with the ONEDSPEC package in IRAF. We measured a full width half maximum (FWHM) of the Ly emission line of Å. The resolution in the combined spectra is 7.9 Å, measured from the FWHM of the 5577 Å night sky line in the combined spectra. This yields an internal FWHM of Å of the Ly line, corresponding to a restframe velocity of km s-1. We see no emission line from N V 1240 or C IV 1549 from the DLA galaxy down to a 3 detection limit of 1 erg cm-2 s-1 in agreement with D96, albeit their detection limit was 10 times fainter.
The redshift difference between the DLA galaxy’s Ly emission component and the DLA absorption components in the QSO spectrum is corresponding to a velocity of 45050 km s-1. This is larger than the 209 km s-1 reported in D96. Here we have used information from all the detected absorption lines in calculating the systemic redshift of the DLA. If we instead used the redshift reported in D96 for the absorption minimum of the DLA line itself, we would find a velocity difference of 27040 km s-1, which is within 2 of their value. Since the interstellar absorption lines have been shown to be blue-shifted by km s-1 with respect to the stars in Lyman Break Galaxies (Shapley et al. 2003), the latter value (300 km s-1) is probably a better estimate.
The line flux measured by fitting the observed line with a Gaussian profile is erg cm-2 s-1; a simple summation of the flux values for each pixel from the emission line gives the same result within the errors. From the dust maps of Schlegel et al. (1998) a Galactic reddening of in the direction towards Q2233+131 is found. Correcting for this effect increases the line flux to ( erg cm-2 s-1 and the total luminosity of the source is erg s-1 in the adopted cosmology. With the noise in each spectral element around 5000 Å of 3.2 erg cm-2 s-1 Å-1 and the line flux being measured over 20 pixels, the significance of the detection of the Ly line is 15. The size of the object is 2338 kpc above a 3 detection threshold of erg cm-2 s-1 Å-1.
A measurement of the equivalent width (EW) of the emission line is hampered by the fact that the continuum emission is extremely faint. From the observed ground-based and band magnitudes in D96 together with magnitudes from HST images (derived in Section 5), we estimate the flux from the underlying continuum at 5050 Å to be erg cm-2 s-1 Å-1 assuming a power-law spectral energy distribution, in the continuum. With this line and continuum flux we derive the rest frame EW= Å. The large error is mainly caused by the uncertainty for the continuum flux. Furthermore, the measured EW must be taken as a lower limit because the effect of dust extinction affects the Ly flux more than the UV continuum emission.
4.1 Velocity structure
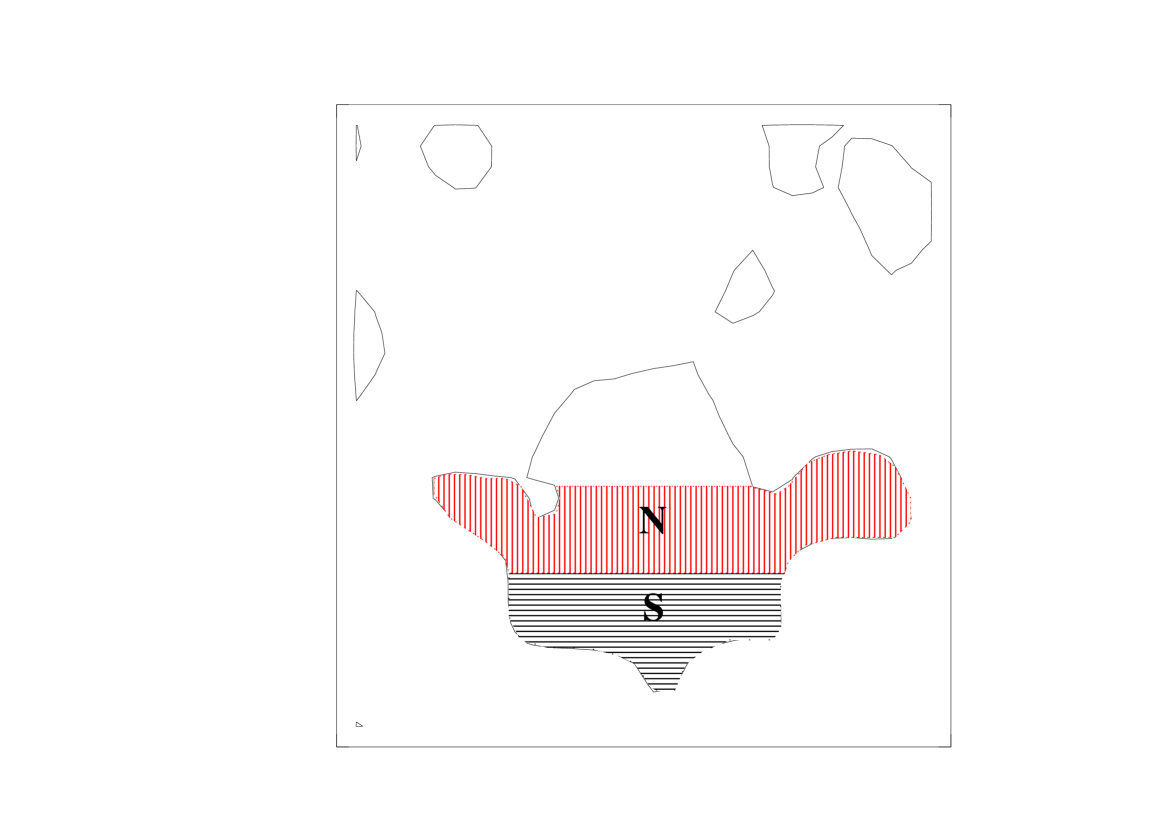
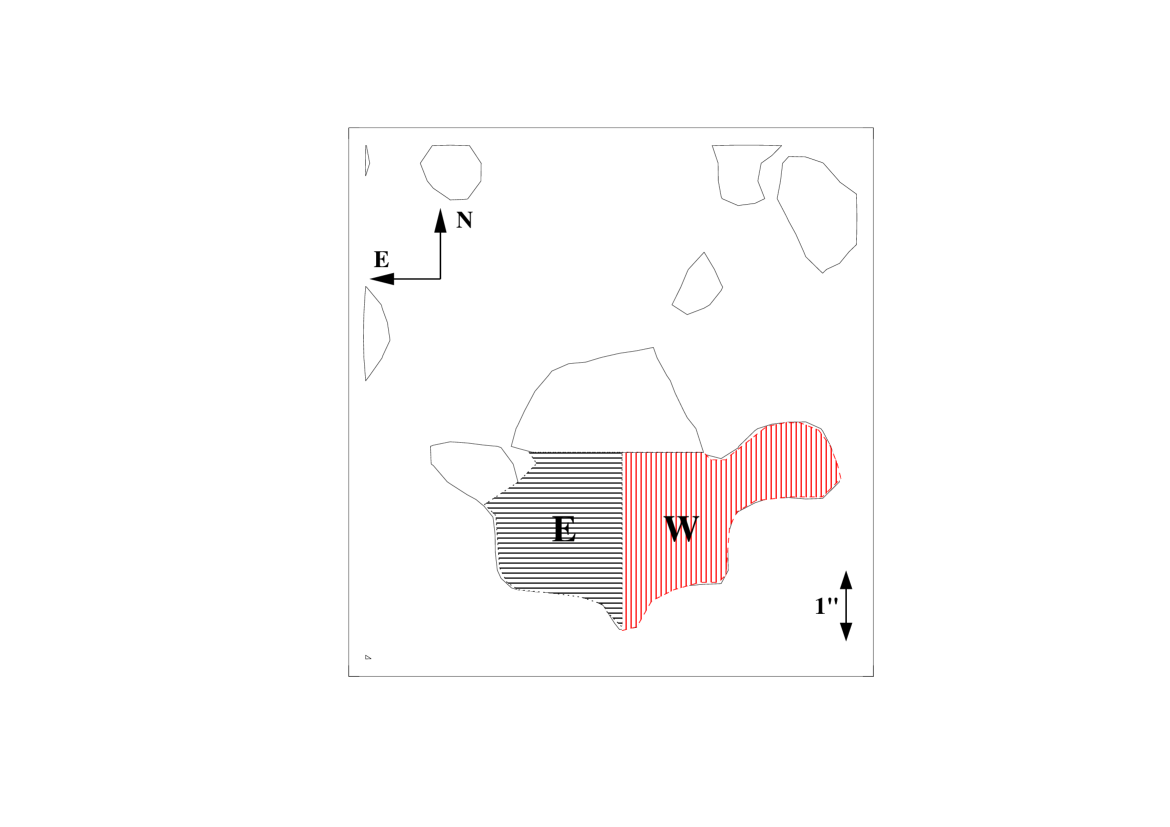
With integral field spectra one can in principle determine the velocity structure of the Ly nebula. Specifically, it would be interesting to search for signs of rotation. A detailed analysis of the velocity structure is not possible with the present dataset, since in several of the individual spectra the emission line is only detected on a 2 level, which makes any analysis of any velocity structure unreliable. Instead we summed up the 15 spectra in the left-most (eastern) part and the 15 in the right-most (western) part, respectively. A sketch of the division is shown in Fig. 4. The Ly emission for each region is still detectable, and the line flux of each is 1 erg cm-2 s-1 Å-1. We fitted Gaussians to the emission line in these two regions, and find that the peak of the emission is shifted by +2.5 Å from the east to the west part, which corresponds to a rest-frame velocity difference of 150 km s-1. This is small compared to the rotational velocity of present day large spiral galaxies. Repeating this exercise by splitting the extended object into a southern and a northern part as shown in Fig. 4, the emission line is shifted by 5 Å corresponding to a difference of 300 km s-1, where the northern part has the largest redshift. This velocity is comparable to that expected for spiral galaxies, but the geometry is unusual for a disk, and as shown in Sect. 4.2 the apparent shift of the emission line can be caused by a combination of more than one emission region. In Table 2 we summarize the properties for the different parts of the extended Ly nebula, and in Fig. 5 we show the Ly line for the different regions. The 1 errors for the centroids of the Gaussian profiles are 0.5 Å estimated from simulations of artificial spectra having faint emission lines at known wavelengths. From these simulated spectra we also estimate that the 1 error for the EWs is 2 Å. All regions are seen to have a large FWHM indicating velocities of 700–1100 km s-1, i.e. they are well resolved by our spectra.
| region | centroid | FWHM | EW | |
|---|---|---|---|---|
| (Å) | ( erg cm-2 s-1) | (km s-1) | (Å) | |
| total | 5048.3 | 2.4 | 1090190 | |
| east | 5049.6 | 1.0 | 770150 | |
| west | 5052.1 | 1.3 | 1120200 | |
| south | 5048.8 | 0.7 | 650150 | |
| north | 5053.4 | 1.3 | 890150 |
Previously, the existence of a disk in this system has been suggested from studies of the metal absorption line profiles (Lu et al. 1997). This interpretation is not supported by Ledoux et al. (1998), who concluded that the profiles could be caused by several interacting components, an interpretation which is motivated by cold dark matter simulations of hierarchical clustering of proto-galaxies (Haehnelt et al. 1998). Under the assumption of a rotating disk, the enclosed mass calculated from is M⊙. As will be discussed below, the Ly emission is unlikely to originate in a rotating disk, and the mass calculated here is probably overestimated.
4.2 The double peaked Ly line
In Fig. 2 the Ly emission line appears to have a double peaked profile. As this feature is not apparent in D96, we double checked carefully for its integrity. Although the dip near the line centre is of the order of the noise level, it appears in all spectra and therefore is almost certainly real. In Fig. 5 all the four separate spectra described above have the same double peaked profile. The feature is not caused by the subtraction of the sky background, nor is it due to imperfections in the CCD in the region around the emission line.

The difference between our measured emission redshift and the one reported in D96 may indicate that our wavelength calibration has an error of 1 Å. This would not have an effect on the reported velocity difference since the error would be systematic in all our spectra and not affect the differences in the estimated Gaussian maxima. Furthermore, as mentioned, the spectra are contaminated by the QSO, but a subtraction of a scaled QSO spectrum from the four individual spectra does not change the Ly line profile.
Anyhow, we caution the reader that other features appear to be systematic in the spectra, e.g. a slightly smaller systematic depression is present in all the spectra around 5020 Å that could be due to an error in the background estimation. Keeping this in mind, we note that a similar double peaked feature was observed for the Ly line of the DLA galaxy in Q2059–360. However, for this object the line profile changed with slit position (Leibundgut & Robertson 1999).
The values for the centroids of the Gaussian fits listed in Table 2 can thus be affected by unequal contributions from two separate emission components. We re-analysed the profiles by simultaneously fitting two Gaussians resulting in centroids of the two peaks listed in column 1 and 2 in Table 3. For these two-Gaussian fits the widths of the two individual components are barely resolved with this spectral resolution. The location of the first peak is shifted by 1.1 Å from east to west, corresponding to 65km s-1, while the second component is shifted by –1Å. Since the uncertainties for the estimate of the Gaussian centroids are 0.5 Å, the shifts are consistent with 0 within 1 errors. The shifts for the north-south regions are likewise small (Å corresponding to km s-1). For all regions the splitting between the two Gaussians are 10–12.5 Å corresponding to velocities of 600–750 km s-1. Very likely, the velocity structure across the extended Ly nebula is complex, and single Gaussian fits for such extended areas as analysed here is over-simplistic.
Additionally, we have fit the profiles by a combination of a single Gaussian emission line and a Gaussian absorption line creating the dip seen in the spectra. The centroids for the absorption line for these fits are listed in Table 3 in column 3. The s from these fits were slightly smaller than for the two emission component fits, indicating that the presence of an absorption line is preferred.
| region | centroid 1 | centroid 2 | abs. centroid |
|---|---|---|---|
| Å | Å | Å | |
| east | 5045.9 | 5056.3 | 5051.1 |
| west | 5044.8 | 5057.3 | 5051.0 |
| south | 5046.3 | 5056.3 | 5050.7 |
| north | 5046.5 | 5058.8 | 5052.2 |
4.3 Artificial slit spectra
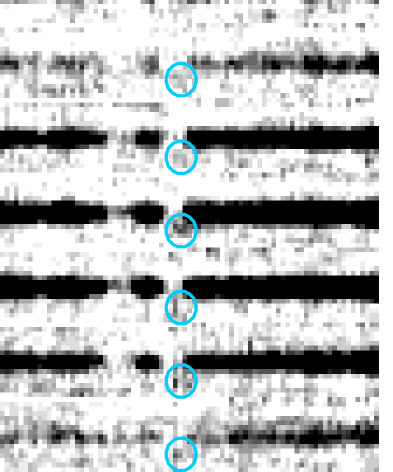


With integral field data we can reproduce the observations expected from slit spectroscopy. In Fig 6 we show a cut of the PMAS spectra around the DLA line in the QSO, where we have indicated the emission from the extended Ly nebula by small circles. In comparison we have in the upper right hand panel created an artificial long slit spectrum with a width of 1″, and the corresponding one-dimensional spectrum is shown in the lower panel. These plots can directly be compared to the ones presented in D96. We derive a line flux of erg cm-2 s-1 Å-1 for the Ly line, confirming the flux reported in D96, and a FWHM of Å, corrected for the instrumental resolution, corresponding to a velocity of km s-1. This FWHM is similar to the the value in D96. With these simple exercises we have shown that it is possible to reproduce the previously published results derived from long-slit spectroscopy.
One sees furthermore in Fig. 6, that the Ly emission indicated by the small circles do not overlap spatially with the location of the QSO. This implies that the contours in Fig. 1 at a distance less than ″ from the QSO only show emission from the QSO itself and not Ly emission from the DLA galaxy. Therefore we consider that selecting the emission region from the DLA galaxy as indicated in Fig. 4 is the real extension of the Ly nebula associated with the DLA galaxy.
5 HST deep imaging
For comparison of the extended emission with high spatial resolution and deeper optical data previously unpublished HST/WFPC2 images of Q2233+131 were retrieved from the HST archive. Previously, a high spatial resolution image from HST/STIS was presented by Møller et al. (2002) and we also retrieved the STIS images from the archive for comparison. The WFPC2 planetary camera images were obtained through the F702W filter with a total integration time of 10800 s and the images were combined using the drizzle package in IRAF (Fruchter & Hook 2002). The resulting pixel scale in the drizzled image is 0023.
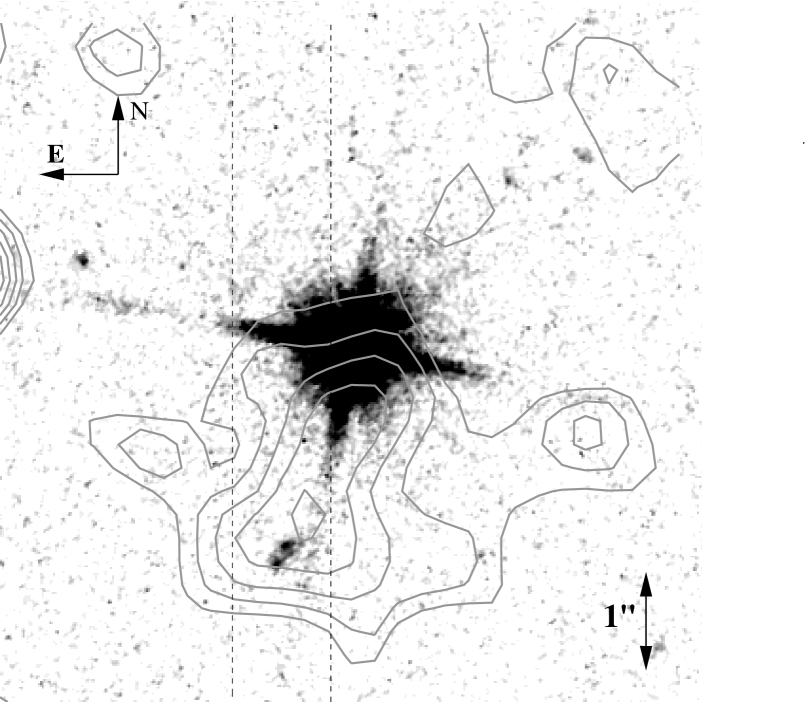
An 8″8″ section of the WFPC2 image is shown in Fig. 7. The DLA galaxy is visible towards the south and the contours of the extended Ly nebula detected by PMAS has been overplotted. The exact positioning of the contours was checked from the knowledge of the location of the QSO in the PMAS images from Fig. 1. The Ly nebula is clearly extended, but it is difficult to measure the extension of it in the direction towards the QSO since it is contaminated by the flux from the red wing of the DLA line. Avoiding this contamination requires an exact knowledge of the point spread function behavior with wavelength such that the flux contribution from the QSO can be subtracted. However as argued from Fig. 6, there is no spatial overlap between the QSO and the Ly nebula so the contours to the north is caused by QSO emission only. In the other direction towards the south there is a clear cutoff in the contours. We therefore conclude that the Ly nebula is more elongated in the east–west direction than in the north–south direction yielding the extension of the Ly nebula of 3″5″. Considering that the observed extension of the nebula is a convolution of the true emission and the seeing during the observations, it could originate in smaller clouds in a more complex environment.
.
In the WFPC2 image a faint and small galaxy is visible at the position indicated in D96 and Møller et al. (2002), and which is identical to the Lyman Break Galaxy (LBG) detected by Steidel et al. (1995). The impact parameter measured in the image is 237 corresponding to 18 kpc in the adopted cosmology, the position angle is 159.1∘, and the size of the galaxy along the major axis is 05, which at corresponds to 3.8 kpc.
In Fig. 7, the size of the Ly nebula appears much larger than the size of the DLA galaxy in the WFPC2 image. To quantify this we investigated whether some low surface brightness emission is lost in the WFPC2 image due to different sensitivities. In the WFPC2 image the 3 limiting magnitude is 26.8 mag arcsec-2, corresponding to a flux limit of erg cm-2 s-1 arcsec-2, while the PMAS observations of the Ly object detect emission of 4 erg cm-2 s-1 arcsec-2, implying that the detection limit of the PMAS spectra are roughly the same as for the WFPC2 images. Therefore, if the continuum emission were as extended as the Ly line emission it would have been detected in the HST images.
The optical magnitude of the LBG corresponds to an galaxy (D96). In Fig. 7 the DLA galaxy is seen to be composed of two components separated by 025 corresponding to 2 kpc at the redshift of the DLA galaxy, and the two components are aligned almost orthogonal to the long axis of the extended emission. A galactic outflow will naturally occur along the minor axis of the galaxy as described in Heckman et al. (1990), which would explain the orientation of the elongated Ly nebula with respect to the LBG orientation. The irregular morphology of the galaxy was also found by Møller et al. (2002) in their HST/STIS data. They noted that the morphology of the DLA galaxy was not unusual compared to field galaxies at the same redshift.
Using aperture photometry in IRAF we find the magnitude of the DLA galaxy using the planetary camera zero point from the WFPC2 Instrument Handbook. This corresponds to a continuum flux of 3 erg cm-2 s-1 Å-1 at Å in the restframe of the DLA galaxy. This is below our detection limit in the PMAS spectra and explains the non-detection of underlying continuum emission from the DLA galaxy. Dust obscuration would make the intrinsic luminosity only larger. The derived flux from the WFPC2 image, confirming that the UV continuum is consistent with being flat, is in agreement with the hypothesis in D96 that the galaxy is very young, and in a star-bursting phase. Using the same aperture for the STIS data we derive in agreement within 1 of the value reported in Møller et al. (2002).
6 Ly emission from high redshift objects
We now compare the properties of other DLA galaxies with those for the Q2233+131 DLA galaxy.
The EW of the observed Ly line is relatively large compared to that of other high redshift galaxies (Shapley et al. 2003). However, one must note that using a 1″ long slit spectrum one would have obtained a 4 times smaller flux, and therefore decreased the inferred EW by the same amount. Values of Ly EWs for high redshift Ly emitters are Å, while some may have EWs which are two orders of magnitude larger (Kudritzki et al. 2000). For the Ly emission from the DLA galaxies in PKS~0528–250 and Q2206–1958 the measured EWs are 63 Å and 83 Å, respectively, which is typical for LBGs at the same redshifts (Møller et al. 2002).
We found that the line width for the Q2233+131 DLA galaxy suggest larger velocities: 1000 km s-1 compared to 700 km s-1 observed for other DLA galaxies. An explanation for this may be that we have co-added the spectra over a large area. Velocity differences of 300 km s-1 have been found from one end to the other of the extended emission, and with the artificial slit spectra created from the integral field spectra we indeed find a smaller value.
Leibundgut & Robertson (1999) found evidence for an extended Ly emission nebula associated with the DLA in Q2059–360 using long-slit spectroscopy, with the slit placed at several positions offset from the QSO. They found a velocity difference between the Ly emission line and the DLA absorption of +490 km s-1, and that the Ly emission line could be described by two components separated by 5 Å. However, they could not exclude that the Ly emission was affected by the QSO, which has a very small redshift difference from the Ly emission line. Nevertheless, these observations are remarkably similar to those presented here of the Q2233+131 DLA, except for the fact that the QSO in our case is well separated in redshift space by .
The properties derived for the Q2233+131 Ly nebula are also similar to the DLA galaxy detected in Q0151+048A which is described in Fynbo et al. (1999) and Fynbo et al. (2000). They concluded that some of the extended Ly emission could be caused by photoionization by the QSO, which has the same redshift as the DLA. This is not the case here. The proper distance between the QSO and the DLA is 120 Mpc in the adopted cosmology. Using the relation between the QSO absolute magnitude and the distance to the DLA given in Warren & Møller (1996), we find that the ionizing flux can be at most erg cm-2 s-1 arcsec-2, which is 4 orders of magnitude below the observed value.
Warren & Møller (1996) found evidence that the DLA galaxy termed S1 in Q0528–250 has an extension of 1″ after correcting for atmospheric seeing suggesting that Ly emission is more extended than the region emitting continuum radiation.
Previously a couple of LBGs at have been associated with surrounding Ly emission nebulae in Steidel et al. (2000), who termed these “Ly blobs”. The properties of the extended nebula presented here are less extreme, but not very different from the Ly blobs. The total luminosity of the Ly emission from the DLA nebula is a factor 10 less than from the Ly blobs, and the line width of the DLA emission is a factor of 2 smaller (Ohyama et al. 2003). The inferred size of the DLA emission is smaller than for the Ly blobs, which have sizes of ″, i.e. a factor of 3 larger than the DLA’s emission, but much of the emission is diffuse, and substructure in the blobs is clearly visible.
It is likely that the observed extension of the DLA galaxy’s Ly emission becomes larger as one goes to fainter fluxes, and since the surface brightness decreases with redshift as , it is difficult to detect faint extended objects especially with a 4m class telescope.
7 Origin of the extended emission
We address now the question whether the Ly emission is induced by a superwind from the DLA galaxy and caused by star formation, or if it originates in a rotating disk.
For the assumption of a rotating disk the relation gives . Such a large value makes the interpretation of a rotating disk questionable. A more likely explanation is resonance scattering of Ly photons that can also produce a large FWHM of the emission line. The resonant nature of the Ly photon neither increases nor decreases the total flux emitted by the source, only the escape direction, but when the dust-to-gas ratio of the environment exceeds 10% of the Galactic value, the extinction will be significant due to the increased escape path from the resonance scattering of the Ly photons. While in dust free star-forming galaxies the expected Ly EW is 100–200 Å (Charlot & Fall 1993), the fact that the measured EW is similar to this value suggests that the most probable source of ionization is massive star formation, and that dust extinction plays a small role.
The red wing of the line profile observed by D96 is marginally detected in our lower resolution data. We can reproduce the line profile in the artificial slit spectrum in Fig. 6, but it is much weaker when co-adding several spaxels as in Fig. 2 indicating the presence of some velocity structure.
7.1 Ly emission indicative of star formation
In star-forming galaxies, it is mainly the OB stars that produce Lyman continuum photons. These photons will be absorbed by the surrounding neutral hydrogen and re-emitted as line photons. Kennicutt (1998) gives the relation between the H luminosity () of a galaxy and its star-formation rate (SFR). Assuming case B recombination (Osterbrock 1989) and that the expected ratio of Ly to H flux is , implies that
The conversion factor depends strongly on the adopted initial mass function, and we adopt an uncertainty of 50%. The relation between the SFR and the luminosity also depends on the escape fraction of the Ly photons, which is very uncertain as the extinction is unknown.
Assuming that the Ly emission is caused by star formation we find M⊙ yr-1, not corrected for the unknown escape fraction. This is a typical value compared to the SFRs found for LBGs having strong Ly emission (Shapley et al. 2003). It is also consistent with the observed continuum, as can be shown using the conversion from the continuum flux at 1500Å in the restframe of a galaxy and the SFR, for which Madau et al. (1998) gives the relation SFR(M (erg s-1 Hz-1). We take into account an uncertainty for the conversion factor of 30%. The observed band corresponds to 1500 Å in the rest frame of the DLA system. Correcting the band magnitude for Galactic extinction and applying an offset converting Vega magnitudes to AB magnitudes (Fukugita et al. 1995) cancels each other out, i.e. . Using the relation above this magnitude corresponds to a SFR M, which is consistent with the SFR derived from the Ly flux.
Given the uncertainties regarding the conversions from fluxes to SFRs, we find that the Ly emission around the DLA galaxy could be caused by massive stars. In principle a significant amount of dust would imply that the true Ly flux is higher than derived from the UV flux. On the other hand, the consistency between the two measurements indicates that dust extinction plays no major role in this particular case. A low dust content could imply a larger escape fraction of the Ly photons. Another explanation of the large Ly luminosity could be the complex dynamics involved in this system (Dawson et al. 2002), and not directly related to the dust content as argued for nearby galaxies (Kunth et al. 2003).
7.2 Origin of the double peaked emission line
Several authors have analysed the transfer of Ly photons in neutral clouds (Adams 1972; Urbaniak & Wolfe 1981; Zheng & Miralda-Escudé 2002). Even in the case of a static cloud, the emission profile of Ly would have a double peak, whereas an outflow would blend the two components of the line. The wavelength difference between the two components is , where is the Boltzmann constant, is the temperature, is the Hydrogen mass, is the speed of light, and is the rest frame wavelength of Ly. Assuming a temperature of K, the corresponding splitting of the line is 0.2 Å at , which is much smaller than the observed splitting. On the other hand, given the observed splitting, a temperature of K is required, which is two orders of magnitude higher than temperatures in superwind outflows at distances far away from the central starburst (Heckman et al. 1990). We therefore argue that the observed double peak is not caused by a static neutral cloud, but has a more complex origin.
In the case of an outflow, the double peaked emission line can be explained. A galactic wind, powered by star formation and supernova explosions, expands outwards and interacts with the surrounding material, shock heats and accelerates this, producing emission line filaments. The preferred direction of expansion is where the pressure gradient is largest, i.e. along the rotation axis of the galaxy usually aligned with the minor axis. The wind creates a large shell of swept up material, and observations towards such an object would intersect the shell in the front and the rear end giving rise to a double peaked emission line profile. Such double peaked profiles of optical emission lines have been observed for nearby starburst galaxies which exhibit these large scale outflows typically termed superwinds (Heckman et al. 1990). Additionally, a double peaked Ly emission line profile was found from the starburst galaxy T1214–277 by Mas-Hesse et al. (2003), who concluded that the feature is caused by emission in an outflow. The inferred velocity separation between the two peaks from the DLA galaxy emission are similar to the highest ones measured for the nearby galaxies in Heckman et al. (1990) and similar to the Ly emission line splitting from T1214–277 (Mas-Hesse et al. 2003).
7.3 The emitter and the absorber
In the case of a superwind outflow, the DLA cloud is affected by its impact, or could event be created by a such. Taniguchi & Shioya (2001) found that a superwind can create Lyman limit systems with cm-2 along filaments. Followed by gravitational collapse along such filaments DLA clouds can be created. Several authors have pointed out that there could be a relation between superwinds from galaxies and the metal absorption systems seen in quasar spectra (e.g. Heckman et al. 1990; Nulsen et al. 1998), thus explaining the early chemical enrichment of neutral gas clouds seen at the highest redshifts. However, Bond et al. (2001) conclude the opposite, on the basis of Mg II absorption profiles, that superwinds are not causing the majority of DLA systems.
The velocity difference between the emitter and the absorber could be caused by the impact of a superwind from the galaxy which would accelerate a pre-existing low temperature clouds in the surrounding environment. Depending on the initial distance from the starburst, column density of the neutral gas cloud, and the luminosity of the starburst, it can be shown that the expected acceleration is of the order of a few times 100 km s-1 (Heckman et al. 1990). This would be consistent with the velocity difference of 300 km s-1 between the Ly emission and the DLA absorption measured here.
8 Mass estimate
When the Ly luminosity is known, the mass contained in the extended nebula can be evaluated following the method described in Morse et al. (1998). The luminosity is given by
| (1) |
where is the volume emissivity, is the volume, and is the volume filling factor. For gas with a temperature of K assuming case B recombination, Osterbrock (1989) gives
| (2) |
where and are the number densities of protons and electrons respectively. The total mass of ions in the nebula assuming negligible metal content is
| (3) |
Using the approximations and , this reduces to
| (4) | |||||
Combining the Equations 2 and 4 gives
| (5) |
For calculating the volume of the Ly nebula, we make an approximation by a cylinder with a radius of 10 kpc and a height of 40 kpc. With the calculated luminosity given above we find . Assuming taken as a rough guess, along with the arguments in McCarthy et al. (1990), we find .
Due to the unknown dust content in the cloud the unextincted Ly luminosity could be much higher than derived, and consequently also the mass. On the other hand, a smaller filling factor would decrease the derived mass, i.e. these two unknown factors may even compensate each other to some extent.
9 Conclusions
Using integral field spectra obtained with PMAS, we have presented evidence that the DLA galaxy previously known to be responsible for the DLA system in Q2233+131 has an extended envelope of Ly emission. From the spectra we constructed an artificial narrow-band image which showed that the extension of the emission is 3″5″ corresponding to 2338 kpc. This cloud has a line flux of erg cm-2 s-1 corrected for Galactic extinction, corresponding to a luminosity of erg s-1 at . We derive the rest frame EW Å.
The source of the ionization is likely star formation within the DLA galaxy. The measurement of the Ly luminosity is generally considered as a very uncertain method for estimating the SFR given the unknown dust obscuration and escape fractions. With this in mind we find a M⊙ yr-1 from the Ly luminosity, a result which is consistent with the M⊙ yr-1 derived from the UV continuum flux from the observed ground based band magnitude. The agreement between the two suggests that dust extinction plays only a small role.
A velocity offset of 27040 km s-1 between the emission and the absorption component in the DLA galaxy does not support the hypothesis that the absorbing cloud resides in a rotating disk. We investigated the velocity structure of the extended Ly emission further by constructing 4 composite spectra. By fitting Gaussian profiles to spectra from the eastern and western region we found an offset of 2.5 Å, which corresponds to a velocity difference of 150 km s-1. The splitting of the spectra into a northern and a southern region gave a velocity difference of 300 km s-1. These results combined with the extended nature of the Ly nebula is not consistent with the properties of a disk similar to that in large spiral galaxies.
The object’s characteristics (luminosity, FWHM, and spatial extension) are similar to that for some LBGs for which extended Ly emission has been detected. These high redshift Ly emitters are thought to be created by an outflowing wind. Recombination of ionised hydrogen creates Ly photons that are resonantly scattered in the environment, which results in the observed extended envelope. We therefore consider the interpretation of an outflow from the galaxy a more likely interpretation. Furthermore, a galactic outflow can create emission lines with double peaked profiles in agreement with the observations.
We argued that the DLA cloud is not a part of a rotating disk surrounding the DLA galaxy. The relation between the extended Ly emission and the DLA cloud in the line of sight towards the QSO is somewhat speculative. The wind responsible for the extended emission can create neutral clouds with high column densities located along filamentary structures. Gravitational collapse in these filaments can create DLA clouds. Another explanation could be a previously existing neutral gas cloud which has been accelerated by the superwind giving rise to a velocity separation of 300 km s-1. A third explanation is that the DLA cloud could be an otherwise unrelated infalling cloud. This third explanation is questionable, given the fact that the measured metallicity in the DLA cloud suggests some processing of stellar material.
We have demonstrated the advantages of using integral field spectroscopy for investigating DLA systems in the terms of confirming the galaxies responsible for the DLA absorption. First of all, one can avoid the conventional two step procedure for detecting candidate DLA galaxies near the line of sight towards the QSOs, which later have to be followed up spectroscopically. With integral field spectra one can create artificial narrow-band images suited to any wavelengths required. Secondly, a non-extended line emitting region could be missed by placing the slit in a less favorable angle, while in the case of an extended emission the line fluxes would inevitably be underestimated.
We will undertake further investigation of the Q2233+131 DLA system with PMAS in order to investigate the velocity structure of the Ly nebula. Specifically, the system should be observed with a higher spectral resolution which should allow to determine the presence of P Cygni profiles expected for the case of superwind outflows but also in order to investigate the double peaked profile in detail.
Acknowledgements.
L. Christensen acknowledges support by the German Verbundforschung associated with the ULTROS project, grant no. 05AE2BAA/4. S.F. Sánchez acknowledges the support from the Euro3D Research Training Network, grant no. HPRN-CT2002-00305. K. Jahnke and L. Wisotzki acknowledge a DFG travel grant under Wi 1369/12-1. L. Č. Popović acknowledges support by Alexander von Humboldt Foundation through the program for foreign scholars and the Ministry of Science, Technologies and Development of Serbia through the project ”Astrophysical Spectroscopy of Extragalactic Objects”. We thank Palle Møller for his comments and suggestions on an earlier version of this paper.References
- Adams (1972) Adams, T. F. 1972, ApJ, 174, 439
- Bechtold (1994) Bechtold, J. 1994, ApJS, 91, 1
- Becker (2002) Becker, T. 2002, PhD thesis, Astrophysikalisches Institut Potsdam, Germany
- Bond et al. (2001) Bond, N. A., Churchill, C. W., Charlton, J. C., & Vogt, S. S. 2001, ApJ, 562, 641
- Charlot & Fall (1993) Charlot, S. & Fall, S. M. 1993, ApJ, 415, 580
- Colbert & Malkan (2002) Colbert, J. W. & Malkan, M. A. 2002, ApJ, 566, 51
- Curran et al. (2002) Curran, S. J., Webb, J. K., Murphy, M. T., et al. 2002, Publications of the Astronomical Society of Australia, 19, 455
- Dawson et al. (2002) Dawson, S., Spinrad, H., Stern, D., et al. 2002, ApJ, 570, 92
- Djorgovski et al. (1996) Djorgovski, S. G., Pahre, M. A., Bechtold, J., & Elston, R. 1996, Nature, 382, 234
- Ellison et al. (2002) Ellison, S. L., Yan, L., Hook, I. M., et al. 2002, A&A, 383, 91
- Filippenko (1982) Filippenko, A. V. 1982, PASP, 94, 715
- Fruchter & Hook (2002) Fruchter, A. S. & Hook, R. N. 2002, PASP, 114, 144
- Fukugita et al. (1995) Fukugita, M., Shimasaku, K., & Ichikawa, T. 1995, PASP, 107, 945
- Fynbo et al. (2000) Fynbo, J. U., Burud, I., & Møller, P. 2000, A&A, 358, 88
- Fynbo et al. (1999) Fynbo, J. U., Møller, P., & Warren, S. J. 1999, MNRAS, 305, 849
- Haehnelt et al. (1998) Haehnelt, M. G., Steinmetz, M., & Rauch, M. 1998, ApJ, 495, 647
- Heckman et al. (1990) Heckman, T. M., Armus, L., & Miley, G. K. 1990, ApJS, 74, 833
- Hopp & Fernandez (2002) Hopp, U. & Fernandez, M. 2002, Calar Alto Newsletter No.4, http://www.caha.es/newsletter/news02a/hopp/paper.pdf
- Hunstead et al. (1990) Hunstead, R. W., Fletcher, A. B., & Pettini, M. 1990, ApJ, 356, 23
- Kennicutt (1998) Kennicutt, R. C. 1998, ARA&A, 36, 189
- Kudritzki et al. (2000) Kudritzki, R.-P., Méndez, R. H., Feldmeier, J. J., et al. 2000, ApJ, 536, 19
- Kunth et al. (2003) Kunth, D., Leitherer, C., Mas-Hesse, M., Östlin, G., & Petrosian, A. 2003, ApJL submitted (astro-ph/0307555)
- Le Brun et al. (1997) Le Brun, V., Bergeron, J., Boisse, P., & Deharveng, J. M. 1997, A&A, 321, 733
- Ledoux et al. (1998) Ledoux, C., Petitjean, P., Bergeron, J., Wampler, E. J., & Srianand, R. 1998, A&A, 337, 51
- Leibundgut & Robertson (1999) Leibundgut, B. & Robertson, J. G. 1999, MNRAS, 303, 711
- Lu et al. (1997) Lu, L., Sargent, W. L. W., & Barlow, T. A. 1997, ApJ, 484, 131
- Madau et al. (1998) Madau, P., Pozzetti, L., & Dickinson, M. 1998, ApJ, 498, 106
- Mas-Hesse et al. (2003) Mas-Hesse, J. M., Kunth, D., Tenario-Tagle, G., et al. 2003, (astro-ph/0309396)
- McCarthy et al. (1990) McCarthy, P. J., Spinrad, H., Dickinson, M., et al. 1990, ApJ, 365, 487
- Møller & Warren (1993) Møller, P. & Warren, S. J. 1993, A&A, 270, 43
- Møller et al. (2002) Møller, P., Warren, S. J., Fall, S. M., Fynbo, J. U., & Jakobsen, P. 2002, ApJ, 574, 51
- Morse et al. (1998) Morse, J. A., Cecil, G., Wilson, A. S., & Tsvetanov, Z. I. 1998, ApJ, 505, 159
- Nulsen et al. (1998) Nulsen, P. E. J., Barcons, X., & Fabian, A. C. 1998, MNRAS, 301, 168
- Ohyama et al. (2003) Ohyama, Y., Taniguchi, Y., Kawabata, K. S., et al. 2003, ApJ, 591, L9
- Osterbrock (1989) Osterbrock, D. E. 1989, Astrophysics of gaseous nebulae and active galactic nuclei (Mill Valley, CA, University Science Books)
- Petitjean et al. (1996) Petitjean, P., Pecontal, E., Valls-Gabaud, D., & Charlot, S. 1996, Nature, 380, 411
- Prochaska et al. (2003) Prochaska, J., Gawiser, E., Wolfe, A., Castro, S., & Djorgovski, S. G. 2003, ApJL, 595, L9
- Rao & Turnshek (2000) Rao, S. M. & Turnshek, D. A. 2000, ApJS, 130, 1
- Roth et al. (2000) Roth, M. M., Bauer, S., Dionies, F., et al. 2000, in Proc. SPIE, Vol. 4008, 277–288
- Sánchez (2003) Sánchez, S. F. 2003, AN accepted (astro-ph/0310677)
- Sargent et al. (1989) Sargent, W. L. W., Steidel, C. C., & Boksenberg, A. 1989, ApJS, 69, 703
- Schlegel et al. (1998) Schlegel, D. J., Finkbeiner, D. P., & Davis, M. 1998, ApJ, 500, 525
- Shapley et al. (2003) Shapley, A. E., Steidel, C. C., Pettini, M., & Adelberger, K. L. 2003, ApJ, 588, 65
- Steidel et al. (2000) Steidel, C. C., Adelberger, K. L., Shapley, A. E., et al. 2000, ApJ, 532, 170
- Steidel et al. (1995) Steidel, C. C., Pettini, M., & Hamilton, D. 1995, AJ, 110, 2519
- Storrie-Lombardi et al. (1996) Storrie-Lombardi, L. J., McMahon, R. G., & Irwin, M. J. 1996, MNRAS, 283, L79
- Storrie-Lombardi & Wolfe (2000) Storrie-Lombardi, L. J. & Wolfe, A. M. 2000, ApJ, 543, 552
- Taniguchi & Shioya (2001) Taniguchi, Y. & Shioya, Y. 2001, ApJ, 547, 146
- Urbaniak & Wolfe (1981) Urbaniak, J. J. & Wolfe, A. M. 1981, ApJ, 244, 406
- van Dokkum (2001) van Dokkum, P. G. 2001, PASP, 113, 1420
- Warren & Møller (1996) Warren, S. J. & Møller, P. 1996, A&A, 311, 25
- Warren et al. (2001) Warren, S. J., Møller, P., Fall, S. M., & Jakobsen, P. 2001, MNRAS, 326, 759
- Wolfe et al. (1995) Wolfe, A. M., Lanzetta, K. M., Foltz, C. B., & Chaffee, F. H. 1995, ApJ, 454, 698
- Wolfe et al. (1986) Wolfe, A. M., Turnshek, D. A., Smith, H. E., & Cohen, R. D. 1986, ApJS, 61, 249
- Zheng & Miralda-Escudé (2002) Zheng, Z. & Miralda-Escudé, J. 2002, ApJ, 578, 33