The abundance of massive galaxies 3–6 billion years
after the Big Bang.
A fundamental prediction of our current hierarchical paradigm of galaxy formation is that massive galaxies form from an assembly of smaller units1. The most massive objects form last, driven by the merging history of their dark matter haloes. The model succeeds in describing the clustering of galaxies2, but the evolutionary history of massive galaxies, as revealed by their visible stars and gas, presents problems. Near-infrared light allows us to measure the stellar masses of high-redshift galaxies3 and deep multi-colour images indicate that a large fraction of the stellar masses in massive galaxies form in the first 5 Gyr4, 5, 6, 7; but uncertainties remain due the lack of spectra to confirm the redshift and the role of obscuration. Here we report on the Gemini Deep Deep Survey, the deepest spectroscopic redshift survey ever undertaken which probes the most massive and quiescent galaxies back to an era only 3 Gyr after the Big Bang. We find that at least two thirds of massive galaxies have appeared since this era, but also that a significant fraction is already in place indicating a suprisingly slow rate of decline as we look back in time.
Star-formation rates in the high redshift () Universe have been probed by measuring rest-frame ultraviolet (UV) emission8 of galaxies. The UV is dominated by newly formed massive stars but can be highly obscured9. Moreover star-formation in galaxies is a stochastic phenomenon and correlates poorly with mass: the most massive galaxies in the local universe are giant ellipticals and they have very weak UV emission 10 which makes them difficult to detect at . Direct determination of dynamical masses of galaxies requires spatially resolved velocity measurements of galaxies — this has been done out to 11, 12 but such observations are very challenging at higher redshifts due to signal-to-noise limitations.
An alternate approach is to infer the total mass in stars from light which traces accumulated stellar populations. Studies3 have shown that stellar mass correlates extremely well with dynamical mass out to . Stellar mass evolution can be predicted by using galaxy formation models based on cosmological numerical simulations augmented with analytical star-formation recipes,13 which adopt simplified prescriptions for various heating and cooling processes in the interstellar medium13, 14.
Deep near-infrared data provides a window on stellar masses of galaxies at high redshift. This light is dominated by the old, evolved stellar populations in galaxies and is little affected by transient star-formation 15 or dust obscuration. To a good approximation the total -band light traces the accumulation of stellar mass; equivalently one can say that the stellar mass-to-light ratio () is nearly constant with little dependence on the previous star-formation history (SFH). In fact rest-frame varies only by a factor of two between extremely young and extremely old galaxy stellar populations, in contrast can vary by more than a factor of ten 16 and varies tremendously (reaching as low as 1% of the solar value) because the UV light is dominated by the instantaneous star-formation rate (SFR) rather than the stellar mass. Even at redshifts up to the observed-frame -band probes the rest-frame -band which is still dominated by old stellar populations. The variation is still less than a factor of four, partly due to the youth of the Universe at that redshift.
We use the Gemini Deep Deep Survey (GDDS)17 to define a new sample of 150 galaxies with and located in four independent 30 arcmin2 fields. The spectroscopic identification completeness is 89%. The determination of stellar masses for each galaxy follows standard multi-color stellar population fitting techniques; this approach is fairly general and robust and is detailed in the Methods appendix. We find that the -band light traces the stellar mass quite well; evolutionary changes in galaxy numbers with redshift are much more important than changes in color. The findings presented below are simply driven by the presence of numerous galaxies at which must be massive objects.
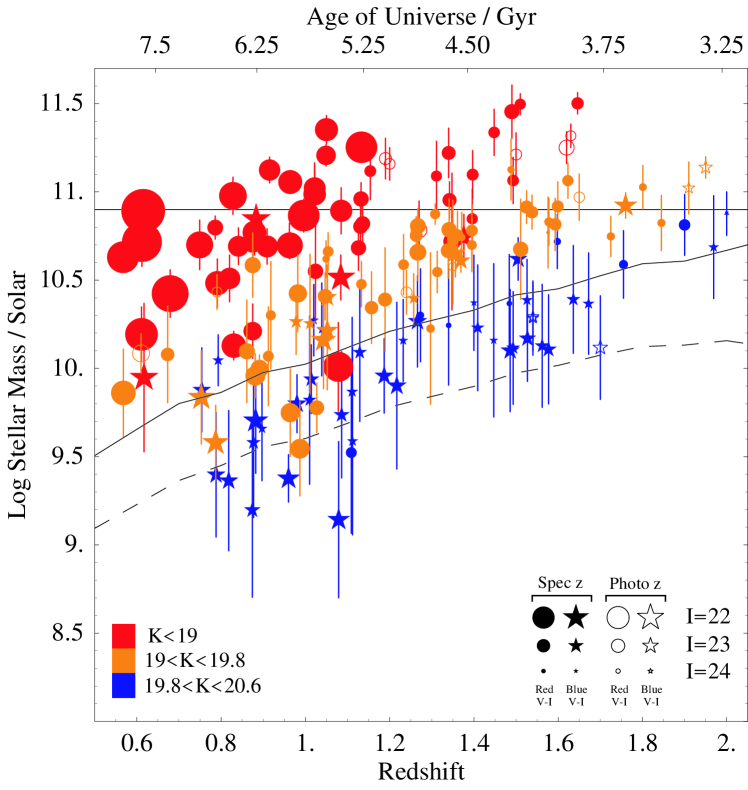
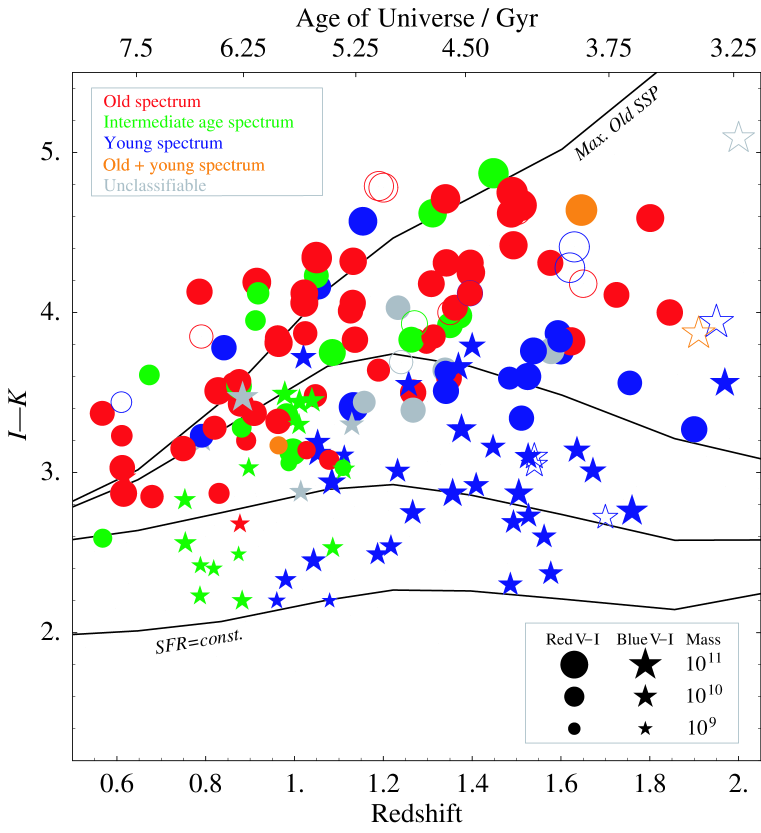
Figures 1 & 2 illustrate the nature of the most massive galaxies. They are found by the GDDS to at , even when they are very red (). The red galaxies are predominantly red due to old stellar populations (these are GDDS spectral classes17 ‘001’ and ‘011’ showing photospheric features from evolved stars) and not dust reddening of young lower mass galaxies. The red, old galaxies make a large contribution (30%) to the stellar mass in the Universe in the redshift range . Also at there are a number of blue galaxies despite this being a -selected sample. These correspond to massive star-forming galaxies which have high metal abundances18.
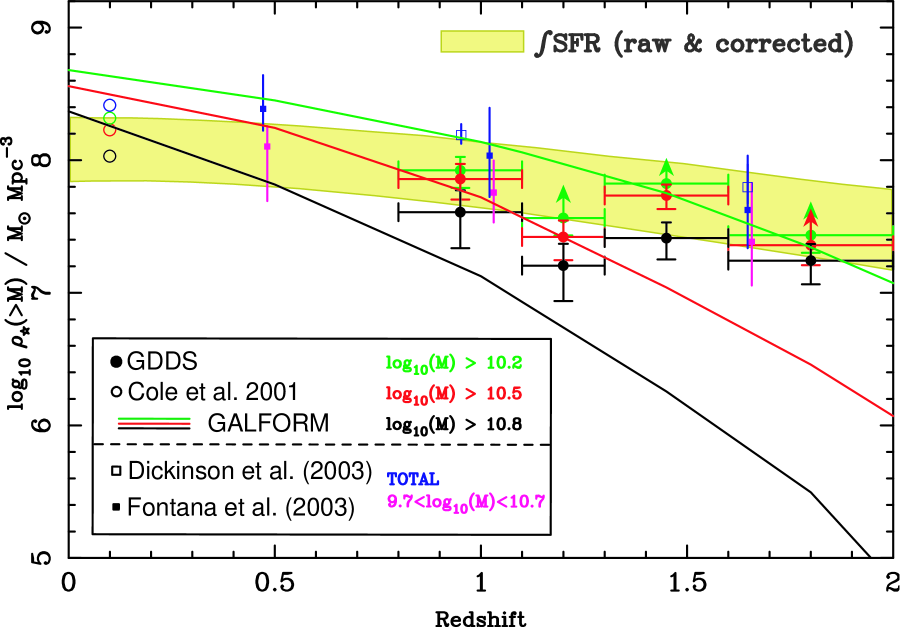
The cumulative stellar mass density per unit volume in each redshift bin down to various mass thresholds (Figure 3; Table 1) is computed following the standard formalism (this corrects for the smaller redshift ranges covered by fainter objects19) for a limit and weighting by the sampling. We use K-corrections from our individual spectral energy distribution (SED) fits, but the results do not depend strongly on the details of the K-correction. Although a -selected sample is a good proxy for a mass-selected sample, it is still necessary to consider incompleteness as a function of . To do this we compute the maximum possible at each redshift for a model galaxy as old as the Universe which formed all its stars at once (a ‘Simple Stellar Population’ or SSP). This is converted to a mass limit (via the -band flux limit and the K-correction) and is shown in Figure 1. We are complete above this mass limit; bluer objects can be seen below this limit. Bins which might miss high objects are plotted as lower limits in Figure 3. The error bars are calculated from shot noise on the number of galaxies in each bin. Of course these do not include the effects of large-scale structure, but we believe these are not significant because our GDDS fields are large, were selected from even larger area images in regions near average density17 (i.e. neither highly over-dense nor under-dense) and because our colour-dependent weights normalise to the full imaging area (554.7 arcmin2) which would counteract the additional clustering of red objects. Finally we have performed the check of splitting the sample by different fields (different independent sight-lines). The same general results are found for these albeit with larger errors. We have also assessed the effect of the mass fitting errors on the mass densities with our Monte-Carlo methods; this is not a significant source of error. In every bin galaxies with spectroscopic redshifts dominate the mass budget except for the and bin, where the spectroscopic completeness is only 50% and we augment our spectroscopy with photometric redshifts. Analysing the sub-sample with only spectroscopic redshifts results in no significant changes to any bin except for this one (which is thus 0.3 dex lower); the essential scientific result is unchanged.
There is a clear decline in stellar mass locked up in the most massive galaxies. This trend is in accord with ideas of gradual assembly. However it declines only slowly towards high redshift and, surprisingly, the massive galaxies do not decline more rapidly than the whole population. We note that galaxies with , are brighter than our flux limits (for any possible value) throughout our redshift range; a regression on these gives an acceptable fit for . At the mass densities for the sample are 38 % of their local value20; at this becomes 16 %. These results for the most massive galaxies are consistent with previous Hubble Deep Field South photometric redshift determinations4, 5, but inconsistent with the more rapid decline (factor of over ) found with photometric redshifts by the Munich Near-Infrared Cluster Survey6 (however we note that their SED fitting forces maximally old galaxies at all redshifts, which could be problematic). Overlaid on Figure 3 (shaded region) is the range of estimates for the growth of total stellar mass based on the integral of the observed rest-UV derived SFR- relationship. (These are based on the an analytic fit20 of points from Figure 9 of Steidel et al. 9, both with and without extinction correction, integrated using PEGASE.221.) Our uppermost points represent lower limits on the total stellar mass density and we confirm previous findings that an extinction correction is essential for UV SFR estimates to be consistent with stellar mass measurements4, 20.
Theoretical models of galaxy formation convert gas into stars in dark matter halos using semi-empirical recipes and must satisfy three key observables: the first is the distribution of local galaxy luminosities, the second is that of galaxy colors and the third is the abundance of massive galaxies at high redshift. The last of these has until now been the most difficult to measure from observations. In Figure 3 we plot the abundance predictions of the ‘GALFORM’ models14, 22 which satisfy the first two constraints; it is evident in this model that massive galaxies disappear much more rapidly than we see in our data; this is because the model stellar mass build-up traces the merging of cold dark matter haloes. In particular GALFORM has a strong dependence of evolutionary rate on mass which is not seen in our data. A similar theoretical comparison was made on the Hubble Deep South photometric data with similar conclusions5.
We note that our measured abundance of massive galaxies at does not violate the boundary constraints of cold dark matter models, by which we mean taking the predicted abundance of massive dark matter halos 23 and scaling by the cosmological baryon dark matter density 2 (). This gives a predicted baryonic mass density of Mpc-3 in haloes with baryonic masses , a factor of ten above our measurements. Thus the models can match our densities if only 10% of the baryons in massive haloes are converted in to stars by . We note though that in the Universe today, the stellar density20 gives = 0.1; this would imply massive haloes at have managed to convert baryons into stars with the same overall efficiency as the average Universe had achieved by . Massive haloes must have much greater star-formation efficiencies at earlier times.
Models have been proposed 13, 24 which adjust the star-formation histories in this way and which would be more in accord with our findings of a high abundance of massive galaxies at early times. However they fail to match existing data on galaxy colours25, 26 or the galaxy luminosity function13 so we defer detailed comparison to future work.
What is observationally clear is that we have measured directly the abundance of massive galaxies out to for the first time from a deep and relatively wide-area survey with secure redshifts and spectroscopic classifications for galaxies. We find (with 99% confidence) that at least two-thirds of the mass in these objects has formed since . However we do not find a more rapid evolution of the giant population compared to the Universal average as would be expected if stellar mass grew simply proportional to dark matter assembly. At we find much of the mass is in galaxies with old stellar populations; these objects are plausible precursors of modern massive elliptical galaxies. This new data is broadly consistent with developing ideas that models of galaxy formation have to be tuned towards earlier star-formation in high-mass haloes. The abundance of massive galaxies at is now firmly established and will provide the vital missing leg in the tripod of key observations required to understand how galaxies form.
Methods
Stellar Mass Fitting
We adopt a cosmology2 of , , and use Vega magnitudes. For the mass-function analysis we use GDDS galaxies with and (150 galaxies; 89% spectroscopic completeness based on Abraham et al. 17 identification confidence classes ; galaxies without spectroscopic redshifts are assigned to their photometric redshifts). To account for the higher priority given to red galaxies in the slit-mask design we use the ‘sampling weights’ from Abraham et al. 17 which are the selection probability for spectroscopy as a function of and .
For each galaxy we derive the most likely stellar mass and a range of uncertainty. These are derived by evaluating against model optical-IR spectral-energy distributions (SED) to determine the ratio, and hence the mass. We note that a variety of approaches to accomplish this have been described in the literature which vary in the level of detail in which they treat star formation. For example, Cole et al. 20 used a simple set of monotonic star-formation histories (SFH) with a varying e-folding time-scale and a fixed dust law. A potential problem is posed by the fact that real galaxies have more complex SFHs, for example a recent starburst can make an old galaxy temporarily bluer and lead to an underestimate of using this method. One approach to account for this effect is to introduce a second young SED component5 superimposed on the old population; this can be computationally expensive depending on the amount of freedom allowed for the second component.
In a spectroscopic sample there is no degeneracy between SED model fitting and photometric redshift (which is also based on SED fitting). We adopt two-component modelling (using PEGASE.2 21 to calculate spectra) in order to be able to assess the possible biases due to starbursts on the calculated masses and allow a range of dust extinction ( mag) and metallicity (). The primary component is modelled using a star-formation rate with 0.1, 0.2, 0.5, 1, 2, 4, 8 & 500 Gyr (the first approximates an instantaneous starburst and the last a constant SFR). The secondary component is a starburst, modelled with a Gyr exponential, which can occur at any time and have a mass between and twice that of the primary component. The model age is constrained to be less than that of the Universe at the appropriate redshift, but any formation epoch is allowed. Like all studies of high redshift star-formation, we must assume a Universal Initial Mass Function (IMF). We primarily use the BG03 IMF27 which fits local cosmic luminosity densities well; it has a similar high-mass slope as the classical Salpeter IMF28 but with a more realistic break at 0.5. Stars with masses below the break never contribute significantly to optical/IR light so the overall effect is to re-scale the total stellar masses to more reasonable values. Similarly we re-scale literature Salpeter based numbers4, 5, 20 to the BG03 IMF using . Our results are robust for any reasonable choice of IMF with a similar slope; to illustrate this we have also calculated masses using the popular Kennicutt IMF29.
Our approach is to find via exhaustive grid search all models consistent with the photometry in the observed frame of each galaxy. This colour set is available for all galaxies and covers rest-frame ultraviolet through near-infrared. We do not include the actual spectra (apart from the redshift information) in the fits because of variable quality and signal-to-noise, however we find the spectral classes are broadly consistent with the best photometric SED fits. The full distribution function of allowed masses were calculated by Monte-Carlo re-sampling the photometric errors. The final masses and error bars represent the mean and standard deviation of this full distribution function. Typically, we find the masses are fitted to dex in the sample. The stellar masses are very robust against the details of the fitting. Using the Monte-Carlo machinery to investigate the effect of different assumptions about metallicity, dust and bursts we find that the largest effect is due to bursts. If we disallowed bursts then the masses typically decrease by only 0.2 dex. Finally we note the variation in over the range is constrained by the age of the Universe (6–3 Gyr), typically the maximum range in our sample is a factor of three.
References
- Blumenthal, Faber, Primack, & Rees 1984 Blumenthal, G. R., S. M. Faber, J. R. Primack, & M. J. Rees Formation of galaxies and large-scale structure with cold dark matter. Nature, 311, 517-525 (1984).
- Spergel et al. 2003 Spergel, D. N., et al. First-Year Wilkinson Microwave Anisotropy Probe (WMAP) Observations: Determination of Cosmological Parameters. Astrophys. J. Supp., 148, 175-194 (2003).
- Brinchmann & Ellis 2000 Brinchmann, J. & R. S. Ellis The Mass Assembly and Star Formation Characteristics of Field Galaxies of Known Morphology. Astrophys. J. (Letters), 536, L77-L80 (2000).
- Dickinson et al. 2003 Dickinson, M., C. Papovich, H. C. Ferguson, & T. Budavári The Evolution of the Global Stellar Mass Density at 0z3. Astrophys. J., 587, 25-40 (2003).
- Fontana et al. 2003 Fontana, A., et al. The Assembly of Massive Galaxies from Near-Infrared Observations of the Hubble Deep Field-South. Astrophys. J. (Letters), 594, L9-L12 (2003).
- Drory et al. 2001 Drory, N., et al. The Munich Near-Infrared Cluster Survey: Number Density Evolution of Massive Field Galaxies to z 1.2 as Derived from the K-Band-selected Survey. Astrophys. J. (Letters), 562, L111-L114 (2001).
- Franx et al. 2003 Franx, M., et al. A Significant Population of Red, Near-Infrared-selected High-Redshift Galaxies. Astrophys. J. (Letters), 587, L79-L82 (2003).
- Madau et al. 1996 Madau, P., H. C. Ferguson, M. E. Dickinson, M. Giavalisco, C. C. Steidel, & A. Fruchter High-redshift galaxies in the Hubble Deep Field: colour selection and star formation history to z 4. Mon. Not. R. Astron. Soc., 283, 1388-1404 (1996).
- Steidel et al. 1999 Steidel, C. C., K. L. Adelberger, M. Giavalisco, M. Dickinson, & M. Pettini Lyman-Break Galaxies at z4 and the Evolution of the Ultraviolet Luminosity Density at High Redshift. Astrophys. J., 519, 1-17 (1999).
- Lotz, Ferguson, & Bohlin 2000 Lotz, J. M., H. C. Ferguson, & R. C. Bohlin Mid-Ultraviolet Determination of Elliptical Galaxy Abundances and Ages. Astrophys. J., 532, 830-844 (2000).
- Vogt et al. 1997 Vogt, N. P., et al. Optical Rotation Curves of Distant Field Galaxies: Sub-L Systems. Astrophys. J. (Letters), 479, L121-(1997).
- Gebhardt et al. 2003 Gebhardt, K., et al. The DEEP Groth Strip Survey. IX. Evolution of the Fundamental Plane of Field Galaxies. Astrophys. J., 597, 239-262 (2003).
- Kauffmann, Colberg, Diaferio, & White 1999 Kauffmann, G., J. M. Colberg, A. Diaferio, & S. D. M. White Clustering of galaxies in a hierarchical universe - II. Evolution to high redshift. Mon. Not. R. Astron. Soc., 307, 529-536 (1999).
- Baugh et al. 2003 Baugh, C. M., A. J. Benson, S. Cole, C. S. Frenk, & C. Lacey The Evolution of Galaxy Mass in Hierarchical Models. In: The Mass of Galaxies at Low and High Redshift, p.91-98 (2003).
- Rix & Rieke 1993 Rix, H. & M. J. Rieke Tracing the Stellar Mass in M51. Astrophys. J., 418, 123-134 (1993).
- Bell et al. 2003 Bell, E. F., D. H. McIntosh, N. Katz, & M. D. Weinberg The Optical and Near-Infrared Properties of Galaxies. I. Luminosity and Stellar Mass Functions. Astrophys. J. Supp., 149, 289-312 (2003).
- Abraham et al. 2004 Abraham, R. G. et al. The Gemini Deep Deep Survey: I. Introduction to the Survey, Catalogs and Composite Spectra. Astron. J., 127, 2455-2483 (2004).
- Savaglio et al. 2004 Savaglio, S., et al. The Gemini Deep Deep Survey. II. Metals in Star-forming Galaxies at Redshift 1.3z2. Astrophys. J., 602, 51-65 (2004).
- Schmidt 1968 Schmidt, M. Space Distribution and Luminosity Functions of Quasi-Stellar Radio Sources. Astrophys. J., 151, 393-409 (1968).
- Cole et al. 2001 Cole, S., et al. The 2dF galaxy redshift survey: near-infrared galaxy luminosity functions. Mon. Not. R. Astron. Soc., 326, 255-273 (2001).
- Fioc & Rocca-Volmerange 1997 Fioc, M. & B. Rocca-Volmerange PEGASE: a UV to NIR spectral evolution model of galaxies. Application to the calibration of bright galaxy counts.. Astron. Astrophys., 326, 950-962 (1997).
- Granato et al. 2000 Granato, G. L., et al. The Infrared Side of Galaxy Formation. I. The Local Universe in the Semianalytical Framework. Astrophys. J., 542, 710-730 (2000).
- Sheth & Tormen 1999 Sheth, R. K. & G. Tormen Large-scale bias and the peak background split. Mon. Not. R. Astron. Soc., 308, 119-126 (1999).
- Somerville, Primack, & Faber 2001 Somerville, R. S., J. R. Primack, & S. M. Faber The nature of high-redshift galaxies. Mon. Not. R. Astron. Soc., 320, 504-528 (2001).
- Somerville et al. 2004 Somerville, R. S., et al. The Redshift Distribution of Near-Infrared-Selected Galaxies in the Great Observatories Origins Deep Survey as a Test of Galaxy Formation Scenarios. Astrophys. J. (Letters), 600, L135-L138 (2004).
- Stanford et al. 2004 Stanford, S. A., et al. The Evolution of Early-Type Field Galaxies Selected from a NICMOS Map of the Hubble Deep Field North. Astron. J., 127, 131-155 (2004).
- Baldry & Glazebrook 2003 Baldry, I. K. & K. Glazebrook Constraints on a Universal Stellar Initial Mass Function from Ultraviolet to Near-Infrared Galaxy Luminosity Densities. Astrophys. J., 593, 258-271 (2003).
- Salpeter 1955 Salpeter, E. E. The Luminosity Function and Stellar Evolution.. Astrophys. J., 121, 161-167 (1955).
- Kennicutt 1983 Kennicutt, R. C. The rate of star formation in normal disk galaxies. Astrophys. J., 272, 54-67 (1983).
- Coleman, Wu, & Weedman 1980 Coleman, G. D., C.-C. Wu, & D. W. Weedman Colors and magnitudes predicted for high redshift galaxies. Astrophys. J. Supp., 43, 393-416 (1980).
Correspondence and requests for materials should be addressed to K.G. (kgb@pha.jhu.edu)
Acknowledgments Based on observations obtained at the Gemini
Observatory, which is operated by AURA under a co-operative agreement
with the NSF on behalf of the Gemini partnership: NSF (U.S.), PPARC
(U.K.), NRC (Canada), CONICYT (Chile), ARC (Australia), CNPq (Brazil)
and CONICET (Argentina). Also based on
observations made at the Las Campanas Observatory of the Carnegie Institution of Washington.
Karl Glazebrook & Sandra Savaglio
acknowledge generous funding from the David and Lucille Packard
Foundation. Roberto Abraham gratefully acknowledges receipt of funding from NSERC
and from the Government of Ontario through
a Premier’s Research Excellence Award. Hsiao-Wen Chen acknowledges support by NASA
through a Hubble Fellowship grant from the Space Telescope
Science Institute, which is operated by the Association of Universities
for Research in Astronomy, Incorporated, under NASA contract.
Competing interests statement The authors declare that they have no competing financial interests.
| BG03 IMF | Kennicutt IMF | |||||||
|---|---|---|---|---|---|---|---|---|
| range | Complete? | |||||||
| 10.2 | 0.8–1.1 | 7.92 | 7.79 | 8.02 | 7.82 | 7.67 | 7.92 | Y |
| 10.2 | 1.1–1.3 | 7.56 | 7.43 | 7.66 | 7.47 | 7.34 | 7.58 | N |
| 10.2 | 1.3–1.6 | 7.82 | 7.73 | 7.90 | 7.71 | 7.62 | 7.79 | N |
| 10.2 | 1.6–2.0 | 7.43 | 7.30 | 7.54 | 7.34 | 7.21 | 7.44 | N |
| 10.5 | 0.8–1.1 | 7.86 | 7.70 | 7.97 | 7.72 | 7.54 | 7.84 | Y |
| 10.5 | 1.1–1.3 | 7.42 | 7.25 | 7.55 | 7.34 | 7.17 | 7.47 | Y |
| 10.5 | 1.3–1.6 | 7.73 | 7.63 | 7.82 | 7.62 | 7.51 | 7.71 | Y |
| 10.5 | 1.6–2.0 | 7.36 | 7.21 | 7.47 | 7.26 | 7.11 | 7.37 | N |
| 10.8 | 0.8–1.1 | 7.61 | 7.34 | 7.77 | 7.46 | 7.13 | 7.64 | Y |
| 10.8 | 1.1–1.3 | 7.21 | 6.94 | 7.37 | 6.92 | 6.49 | 7.14 | Y |
| 10.8 | 1.3–1.6 | 7.41 | 7.25 | 7.53 | 7.24 | 7.04 | 7.38 | Y |
| 10.8 | 1.6–2.0 | 7.24 | 7.06 | 7.37 | 6.96 | 6.74 | 7.11 | Y |