Spatially extended K i 7699 emission in the nebula of VY CMa: Kinematics and geometry
Abstract
Long-slit echelle spectra reveal bright extended emission from the K i 7699 resonance line in the reflection nebula surrounding the extreme red supergiant VY Canis Majoris. The central star has long been known for its unusually-bright K i emission lines, but this is the first report of intrinsic emission from K i in the nebula. The extended emission is not just a reflected spectrum of the star, but is due to resonant scattering by K atoms in the outer nebula itself, and is therefore a valuable probe of the kinematics and geometry of VY CMa’s circumstellar environment. Dramatic velocity structure is seen in the long-slit spectra, and most lines of sight through the nebula intersect multiple distinct velocity components. A faint “halo” at large distances from the star does appear to show a reflected spectrum, however, and suggests a systemic velocity of 40 km s-1 with respect to the Sun. The most striking feature is blueshifted emission from the filled interior of a large shell seen in images; the kinematic structure is reminiscent of a Hubble flow, and provides strong evidence for asymmetric and episodic mass loss due to localized eruptions on the star’s surface.
keywords:
circumstellar matter — stars: evolution — stars: individual (VY CMa) — stars: mass-loss1 INTRODUCTION
Due to enhanced mass loss during the final stages of stellar evolution, red supergiants are surrounded by extended gas and dust envelopes. This material forms the pre-supernova circumstellar environment, or may get swept-up to form a ring nebula if the star evolves blueward to become a luminous blue variable or Wolf-Rayet star. In a brief phase when mass-loss peaks, these stars can have circumstellar nebulae dense enough to emit OH masers and strong thermal infrared (IR) emission from dust that may obscure the star (OH/IR stars). Among the most luminous red supergiants above 105.5 L⊙, only a handful in our Galaxy are OH/IR stars — one of the most luminous is the M5e Ia supergiant VY Canis Majoris. At a distance of 1.5 kpc (Herbig 1972; Lada & Reid 1978; Marvel 1997), its luminosity is 105.7 L⊙.
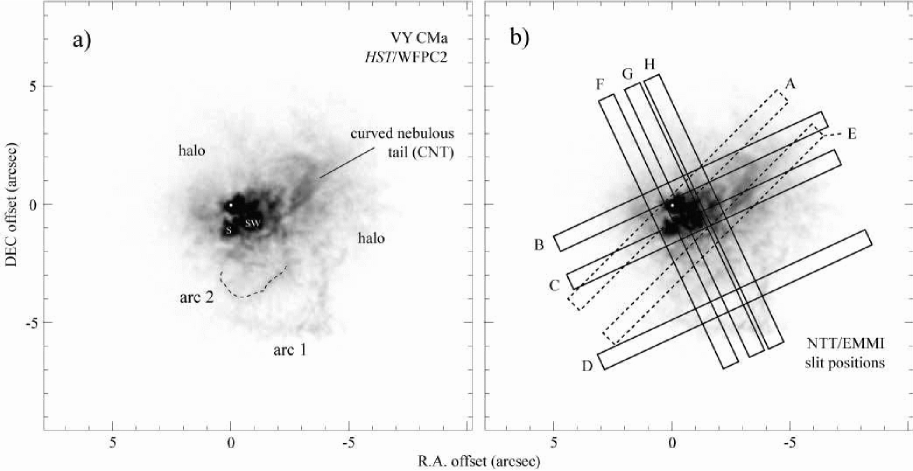
VY CMa is a special case among the most luminous red supergiants, because of its spectacular reflection nebula, with strong polarization (Herbig 1972) and intricate knotty and filamentary structure seen in Hubble Space Telescope (HST) and ground-based IR images (Kastner & Weintraub 1998; Monnier et al. 1999; Smith et al. 2001). These studies revealed a chaotic and highly asymmetric distribution of dust in the circumstellar environment. VY CMa also has strong SiO, H2O, and OH maser emission (Knowles et al. 1969; Buhl et al. 1974). Proper motions and Doppler shifts of these masers have repeatedly been interpreted to suggest that VY CMa is surrounded by an expanding disk-like distribution of material with the polar axis oriented northeast-southwest (van Blerkom & Auer 1976; Rosen et al. 1978; Benson & Mutel 1979, 1982; Morris & Bowers 1980; Bowers et al. 1983; Deguchi et al. 1983; Richards et al. 1998). These maser studies only probe material close to the star, and seem hard to reconcile with the severely asymmetric arrangement of knots, arcs, and chaotic filaments seen at larger radii in optical HST images (Smith et al. 2001; see Figure 1), or the asymmetric structure near the star in the IR (Monnier et al. 1999). A disk-like geometry implies axial symmetry, so perhaps the receding part of the nebula is obscured by foreground material. Nebulae around red supergiants are neutral dusty reflection nebulae, without convenient diagnostics of the geometry and kinematics like the bright H or [N ii] lines commonly used in studies of nebulae around hot stars.
Spectroscopically, VY CMa is unique among red supergiants because the resonance lines of K i 7665 and 7699 are seen strongly in emission (Wallerstein 1958; Humphreys 1970; Wallerstein & Gonzalez 2001), accompanied by P Cygni absorption. The K i lines arise in cool gas at 700 to 1000 K (Wallerstein 1958), comparable to dust temperatures near the star (Monnier et al. 1999; Smith et al. 2001). Its spectrum is also unusual in that it shows emission from TiO, ScO, Ti i, Cr i, Rb i, Ba ii, etc. (Joy 1942; Wallerstein 1958, 1986; Hyland et al. 1969; Wallerstein & Gonzalez 2001). Emission from the K i lines is sometimes seen in extended envelopes of red supergiants, including Betelgeuse (Bernat & Lambert 1976; Bernat et al. 1978; Mauron et al. 1984; Plez & Lambert 1994, 2002), but the extreme strength of K i emission in the spectrum of the central star is rare.
This Letter reports the discovery that the previously-known K i emission in the star’s spectrum is accompanied by bright extended K i emission from VY CMa’s nebula. The K i lines are by far the brightest emission lines throughout the IR and visual-wavelength spectrum of the nebula. K i emission traces roughly the same spatial extent as the reflection nebula, and yields interesting clues to the kinematics and geometry of VY CMa’s circumstellar environment.
| Slit | Date | P.A. | Exp. | Comment |
|---|---|---|---|---|
| d/m/y | (deg) | (min) | ||
| A | 8/3/03 | 135 | 9 | star |
| B | 11/3/03 | 295 | 30 | offset N, CNT |
| C | 11/3/03 | 295 | 30 | offset S, CNT |
| D | 11/3/03 | 295 | 30 | offset S, arc1 |
| E | 8/3/03 | 135 | 30 | CNT and arc2 |
| F | 10/3/03 | 205 | 30 | offset E, arc2 |
| G | 10/3/03 | 205 | 9 | offset W, knots, arc1 |
| H | 10/3/03 | 205 | 30 | offset W, arc1 |
2 OBSERVATIONS
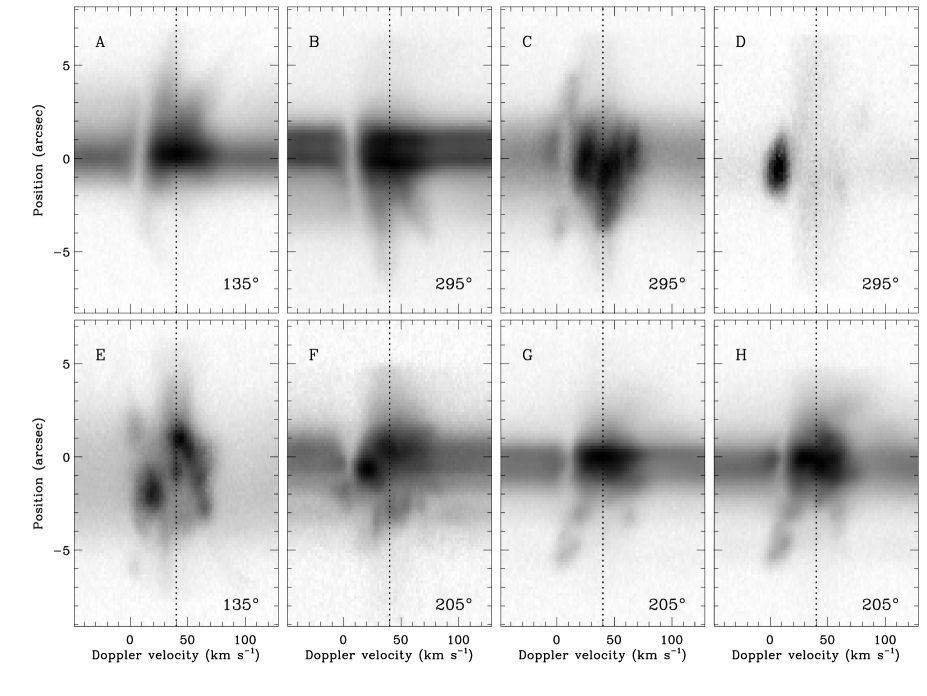
High-resolution optical spectra of VY CMa were obtained at the European Southern Observatory (ESO) at La Silla, Chile on the nights of 8, 10, and 11 March 2003 using the ESO Multi-Mode Instrument (EMMI) on the New Technology Telescope (NTT). Cross-dispersed echelle spectra were obtained using EMMI’s red CCD (a 40964096 pixel MIT/LL detector) with the number 10 echelle grating and grism 6 for order separation. The separation between adjacent orders on the CCD allows for some spatial information to be recorded with a 13 long slit aperture; this is well-suited to VY CMa’s compact reflection nebula (Figure 1). On all three observing nights the seeing was quite good, varying from 06 to 08 on average. To sample this good seeing and to maximize spectral resolution, a narrow 08-wide slit aperture was used. This configuration yielded a spectral resolution of (8 km s-1), and a pixel scale of 0166 0.0517 Å (or 2 km s-1 at a wavelength of 7699 Å). Wavelength calibration was accomplished using observations of an internal emission lamp; heliocentric velocities for the K i 7699 line are quoted here. Several different slit positions and orientations were used to sample the spectrum of various features seen in images, as shown in Figure 1. Discussion in this Letter is limited to the velocity structure of the very bright K i 7699 emission line, since the other K i line at 7665 Å is strongly affected by absorption in the atmospheric A-band, and no other line in the spectrum had comparable brightness in the ejecta. Figure 2 shows the resulting position-velocity diagrams for K i 7699 at the various slit orientations in Figure 1.

3 DISCUSSION
The observations presented here were exploratory, and the most significant result is the discovery of bright intrinsic K i emission from the nebula around VY CMa — this extended K i emission is not simply a dusty reflection of the star’s K i emission line, but rather, it is intrinsic emission from the gas in the nebula itself.111This is immediately apparent because some of the emission is blueshifted, whereas reflection by expanding dust can only cause redshifted emision. A salient example is the Homunculus nebula around Carinae (Smith et al. 2003). It is therefore a powerful diagnostic of the kinematics and geometry of the extended nebula. Inferring quantities like column densities and mass-loss rates from the K i emission requires detailed modeling beyond the scope of this short Letter (see the models of K i emission for the nebula of Betelgeuse; Jura & Morris 1981; Rodgers & Glassgold 1991; Glassgold & Huggins 1986), but the information provided here can hopefully be useful in such an investigation. A qualitative description of the data is given here, and some clues to the kinematics and geometry of the nebula are discussed. Figure 3 shows spectral intensity tracings at a few selected positions, and Table 2 collects some measurements from these tracings, such as the flux-weighted centroid velocity (), the emission equivalent width (EW), the flux ratio of reflected continuum to the central star’s continuum (/), and the intensity ratio of the extended K i emission compared to the emission line seen in the star (I/I∗). Uncertainty in /, /, and the EW is a few percent, or as much as 10% in the faintest outer “halo” spectrum. The values for EW, /, and / in Table 2 were corrected for instrumental scattering using observed values of / for a point source.
| Feature | Radius | EW | F/F∗ | I/I∗ | |
|---|---|---|---|---|---|
| (arcsec) | (km s-1) | (Å) | (cont.) | (line) | |
| star | … | +41.5 | 4.75 | 1 | 1 |
| S | 1 | +32.4 | 4.02 | 0.13 | 0.11 |
| SW | 1 | +41.0 | 3.33 | 0.10 | 0.07 |
| CNT | 3 | +39.2 | 6.53 | 0.024 | 0.033 |
| Arc2 | 3 | +40.1 | 3.96 | 0.030 | 0.025 |
| Arc1 | 5 | +7.7 | 5.27 | 0.0083 | 0.0092 |
| halo | 6 | +40.0 | 4.66 | 0.0014 | 0.0014 |
3.1 Kinematic Structure
Examining Figures 2 and 3, it is obvious that the kinematic structure of K i 7699 in VY CMa’s circumstellar nebula is complex, and not easily explained by spherical or axial symmetry. This is consistent with qualitative inspection of HST images of the nebula, which suggest either highly asymmetric mass ejection or selective extinction (or both; Smith et al. 2001; Kastner & Weintraub 1998). In general, bright K i emission with strong Doppler shifts is confined to within about 5 from the star, and strong emission features can usually be associated with knots or filaments in images of the nebula (Figure 1). Many positions show multiple velocity components along the same line of sight, especially the bright knots like S and SW. The curved nebulous tail (CNT; see Herbig 1972) shows interesting kinematic structure (see slit position E in Figure 2, which runs along the CNT). Near the star it is redshifted by about 20 km s-1 (compared to ), and this Doppler shift gradually decreases to match at the apex of the CNT farthest from the star. Thus, the CNT might either be a bubble like Arc1 moving near the plane of the sky, or an expanding equatorial ring. Overall, the material with strong K i emission and chaotic kinematic structure is seen mainly toward the southwest of the star, in the brightest part of the reflection nebula.
Self absorption is not uniformly distributed either. Blueshifted absorption is seen in the bright central parts of the nebula near the star, and is concentrated toward the north and northeast. Ratio images also showed enhanced reddening toward the northeast (Smith et al. 2001). No absorption is seen more than 1 from the star toward the southwest direction. The narrow absorption shows a velocity gradient with position: It shifts from about 20 km s-1 (heliocentric) at a few arcseconds northwest of the star, reaching almost 0 km s-1 at positions a few arcsec east of the star.
While the faint outer halo has an emission profile almost identical to that of the star (Figure 3), the P Cyg absorption component is missing. The K i equivalent width in the halo is also nearly identical to the star (Table 2), so at large radii this halo is probably a pure reflection nebula. However, the missing P Cyg absorption component indicates that other lines of sight do not see the P Cyg absorption. Either the stellar wind of VY CMa is asymmetric, or the absorption is not a “real” P Cyg component formed in the wind, but is instead localized self absorption in the nebula.
3.2 Systemic velocity
At more than 5 from the star in most position-velocity diagrams in Figure 2, a very faint emission component is seen at nearly the same velocity as that of the star. Images of VY CMa reveal a faint, fairly uniform scattering halo extending beyond 5 from the star as well (Smith et al. 2001). Figure 3 shows an average of several different positions in this outer halo. This is not simply instrumental scattering of the bright star, because the P Cyg absorption is missing in the outer parts. This outer halo may be the best tracer of the systemic velocity of VY CMa. Table 2 gives the flux-weighted centroid velocity of K i in the halo, indicating a likely systemic velocity of 40.01.5 km s-1 (heliocentric), or 21 km s-1 (LSR). This agrees with various other indicators of VY CMa’s systemic velocity, varying between 37 and 44 km s-1 (Wallerstein 1986; Bowers et al. 1983; Deguchi et al. 1983; Reid & Dickinson 1976; Neufeld et al. 1999; Harwit & Bergin 2002), and is close to the systemic velocity of molecular clouds associated with the nearby cluster NGC 2362 (18 km s-1 LSR; Lada & Reid 1978).
3.3 Episodic ejection
Deep HST images of VY CMa revealed a filamentary arc about 5 southwest of the star (Arc 1 in Figure 1) that provoked speculation about asymmetric, episodic mass ejection due to stellar activity (Smith et al. 2001). Slit positions D, G, and H in Figure 1 were placed to study the velocity structure of Arc 1, and the results are striking. K i emission associated with Arc 1 is strongly blueshifted. Interestingly, it seems to show a quasi-Hubble law, perhaps composed of several clumps seen best in Figure 2 G and H. Its blueshift increases with separation from the star, reaching a maximum of about 40 km s-1 with respect to the star at a separation of 5. (The emission feature at 3 and 60 km s-1 in Figure 2 G and H may be Arc 2, consistent with the high reddening of Arc 2 in images; see Smith et al. 2001.) A Hubble-like flow would imply a single ejection episode, strengthening the hypothesis that Arc 1 is due to an asymmetric eruption from the star’s surface.
The pseudo ‘Hubble constant’ for this flow is roughly 7.2 km s-1 arcsec-1. Without proper motions, the projection angle out of the plane of the sky is unknown, but at a distance of 1.5 kpc, the observed velocity structure implies an age of years.
The spatial extent of the K i emission associated with Arc 1 suggests that the emission line originates mainly in the filled interior of a bubble outlined by Arc 1. Perhaps reflected light in images traces a thin filamentary dust shell swept up by the expanding gas emitting K i.
3.4 Comparison with Betelgeuse
Neutral potassium emission has been observed in the circumstellar environment of Betelgeuse as well, out to radii of roughly 50 (Plez & Lambert 2002), whereas the brightest K i reaches roughly 5 from VY CMa. Since VY CMa is about 10 times farther away, the actual radial extent of the K i emission is comparable around these two stars. However, the K i in VY CMa’s circumstellar shell is much brighter with respect to the star; I/I∗ is a factor of 103 to 104 stronger in VY CMa. Note that Betelgeuse shows no K i emission in the direct stellar spectrum, so Plez & Lambert measured as the continuum flux in a 1-Å bin; thus, / in Table 2 needs to be multiplied by a factor of 4.75 (the EW of K i 7699 for the star) for direct comparison with Betelgeuse. This relatively bright extended K i emission is partly due to the fact that direct photospheric light from VY CMa is obscured by its own circumstellar dust (Smith et al. 2001; Kastner & Weintraub 1998; Herbig 1972). Perhaps even the “stellar” K i emission arises in unresolved circumstellar ejecta, but appears so strong because the star is occulted. This may help explain the mystery of the unusually-bright K i emission from VY CMa. However, understanding the physical conditions in the gas that gives rise to the bright K i emission, the potassium abundance, the mass-loss rate, and other properties will require quantitative modeling of the observed nebular spectrum.
ACKNOWLEDGMENTS
Support was provided by NASA through grant HF-01166.01A from the Space Telescope Science Institute, which is operated by the Association of Universities for Research in Astronomy, Inc., under NASA contract NAS 5-26555. I thank an anonymous referee for helpful comments.
References
- [] Benson, J.M., & Mutel, R.L. 1979, ApJ, 233, 119
- [] Benson, J.M., & Mutel, R.L. 1982, ApJ, 253, 199
- [] Bernat, A.P., & Lambert, D.L. 1976, ApJ, 210, 395
- [] Bernat, A.P., Honeycutt, R.K., Kephart, J.E., Gow, C.E., Sandford, M.T., & Lambert, D.L. 1978, ApJ, 219, 532
- [] Bowers, P.F., Johnston, K.J., & Spencer, J.H. 1983, ApJ, 274, 733
- [] Buhl, D., Snyder, L.E., Lovas, F.J., & Johnson, D.R. 1974, ApJ, 192, L97
- [] Deguchi, S., Good, J., Fan, Y., Mao, X., Wang, D., & Ukita, N. 1983, ApJ, 264, L65
- [] Glassgold, A.E., & Huggins, P.J. 1986, ApJ, 306, 605
- [] Harwit, M., & Bergin, E.A. 2002, ApJ, 565, L105
- [] Herbig, G.H., 1972, ApJ, 172, 375
- [] Humphreys, R.M. 1970, PASP, 82, 1158
- [] Hyland, A.R., Becklin, E.E., Neugebauer, G., & Wallerstein, G. 1969, ApJ, 158, 619
- [] Jura, M., & Morris, M. 1981, ApJ, 251, 181
- [] Kastner, J.H., & Weintraub, D.A. 1998, AJ, 115, 1592
- [] Knowles, S.H., Mayer, C.H., Cheung, A.C., Rank, D.M., & Townes, C.H. 1969, Science, 163, 1055
- [] Lada, C.J., & Reid, M.J. 1978, ApJ, 219, 95
- [] Marvel, K.B. 1997, PASP, 109, 1286
- [] Mauron, N., Fort, B., Querci, F., Dreux, M., Fauconnier, T., & Lamy, P. 1984, A&A, 130, 341
- [] Monnier, J.D., Tuthill, P.G., Lopez, B., Cruzalebes, P., Danchi, W.C., & Haniff, C.A. 1999, ApJ, 512, 351
- [] Morris, M., & Bowers, P.F. 1980, AJ, 85, 724
- [] Neufeld, D.A., Feuchtgruber, H., Harwit, M., & Melnick, G.J. 1999, ApJ, 517, L147
- [] Plez, B., & Lambert, D.L. 1994, ApJ, 425, L101
- [] Plez, B., & Lambert, D.L. 2002, A&A, 386, 1009
- [] Reid & Dickinson 1976
- [] Richards, A.M.S., Yates, J.A., & Cohen, R.J. 1998, MNRAS, 299, 319
- [] Rodgers, B., & Glassgold, A.E. 1991, ApJ, 382, 606
- [] Rosen, B.R., Moran, J.M., Reid, M.J., Walker, R.C., Burke, B.F., Johnston, K.J., & Spencer, J.H. 1978, ApJ, 222, 132
- [] Smith, N., Davidson, K., Gull, T.R., Ishibashi, K., & Hillier, D.J. 2003, ApJ, 586, 432
- [] Smith, N., Humphreys, R.M., Davidson, K., Gehrz, R.D., Schuster, M., & Krautter, J. 2001, AJ, 121, 1111
- [] van Blerkom, D., & Auer, L. 1976, ApJ, 204, 775
- [] Wallerstein, G. 1958, PASP, 70, 479
- [] Wallerstein, G. 1986, A&A, 164, 101
- [] Wallerstein, G., & Gonzalez, G. 2001, PASP, 113, 954