00 \Year0000 \Month00 \Pagespan000000 \lhead[0]Bunker et al.: CIRPASS on Gemini \rhead[Astron. Nachr./AN XXX (2003) X]0 \headnoteAstron. Nachr./AN 32X (2003) X, XXX–XXX
Extragalactic Integral Field Spectroscopy on the Gemini Telescopes
Abstract
We have been undertaking a programme on the Gemini 8-m telescopes to demonstrate the power of integral field spectroscopy, using the optical GMOS spectrograph, and the new CIRPASS instrument in the near-infrared. Here we present some preliminary results from 3D spectroscopy of extra-galactic objects, mapping the emission lines in a 3CR radio galaxy and in a gravitationally lensed arc, exploring dark matter sub-structure through observations of an Einstein Cross gravitational lens, and the star formation time-scales of young massive clusters in the starburst galaxy NGC 1140.
1 Introduction
Integral field spectroscopy is a powerful technique with great potential for furthering the understanding of galaxy evolution. By simultaneously producing spectra at each position over a two dimensional region, Integral Field Units (IFUs) maximise the amount of information obtained. The sensitivity of spectroscopy to line emission combined with the areal coverage of IFUs makes them an excellent tool to map the spatial variation of metallicity, extinction, velocity and star formation activity in individual galaxies.
1.1 Our observations
We have recently carried out the first integral field spectroscopy of high redshift galaxies with an 8m telescope. These observations were part of an international demonstration science programme with Gemini Observatory lead by the Institute of Astronomy, Cambridge, and the University of Durham.
In June 2002 we used the optical Gemini Multi-Object Spectrograph (GMOS) on Gemini-North in IFU mode (Allington-Smith et al. 2002). GMOS is equipped with a fibre-fed IFU with an lenslet array covering an area of with -diameter lenslets and with a wavelength range of m. In August 2002 we commissioned the new near-infrared IFU CIRPASS (the Cambridge IR Panoramic Survey Spectrograph, Parry et al. 2000) on Gemini-South. CIRPASS is a fibre-fed spectrograph with a 490 lenslet array covering an area of up to with the lenslet scale (a lenslet scale is also available). CIRPASS operates in the - and -band (m). Since then, CIRPASS has been offered to the Gemini community for a semester, and used for 20 nights on Gemini-South in 2003.
For both CIRPASS and GMOS we used medium resolution gratings with a resolving power of (100 km/s FWHM) enabling us to work efficiently between the sky lines: the redshifts of our targets were chosen to have emission lines in “clean” regions of the night sky spectrum.
The demonstration science programme covered a wide range of targets and
science goals, including the nature of high-redshift damped
Lyman- absorption systems (see Bunker et al. 2001) and the star
formation and kinematics of high-redshift galaxies.
In this brief article, we focus on three specific targets.
Other highlights of the demonstration science programme can be
found on
http://www.ast.cam.ac.uk/bunker/CIRPASS
2 The radio galaxy 3C324
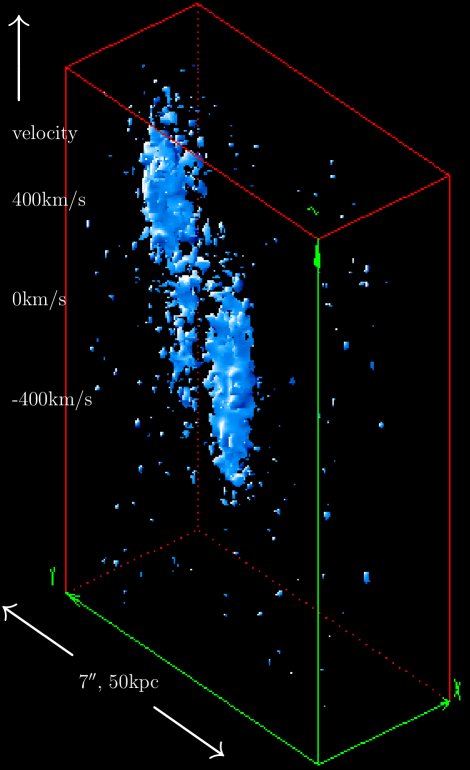
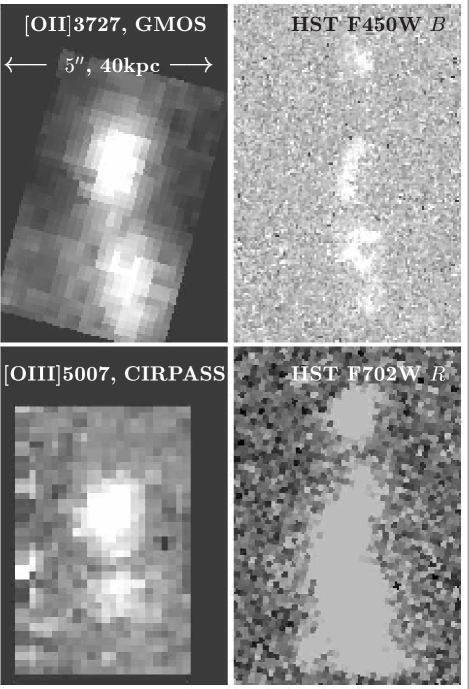
We observed the radio galaxy 3C324, which has emission line regions aligned with the radio structure and extending over kpc (several arcsec, well-matched to the size of the IFUs on Gemini). Our deep hour spectrum targeted the [OII] 3727 Å emission line using GMOS (Smith et al. 2003), and mapped the spatial variation and velocity structure of the emission line gas (Fig. 1). The [OII] emission shows two distinct components of emission line gas with velocities separated by 800 km/s (as noted by Best et al. 2000). The two emission line components may indicate two separate physical systems undergoing a merger or radial acceleration by radio jet shocks. We see broad [OII] emission (FWHM 1000 km/s) indicating large-scale velocity outflows as well as narrower line emission (FWHM 300 km/s) in some regions. The velocity spread of the line is sufficient to blur the [OII] doublet line emission. Using CIRPASS we targeted the [OIII] 5007 Å emission line (Fig. 2). Comparison with the GMOS observations of the [OII] 3727 Å line yields information on the ionization mechanisms powering the aligned emission line gas – the higher-ionization [OIII] line emission is far more centrally-concentrated and smaller in spatial extent than the [OII], perhaps indicating that the central AGN has a greater role in powering these emission lines than star formation in the individual high-surface brightness ‘knots’ seen in the rest-UV image (the HST -band, upper right of Fig. 2).
3 Spectroscopic Gravitational Lensing and Limits on the Dark Matter Substructure in Q2237+0305
We have used the CIRPASS IFU on Gemini to measure the gravitational lensing on different size scale of an Einstein cross (the 4–image quasar Q2237+0305, Huchra et al. 1985, Mediavilla et al. 1998). In a project lead by Ben Metcalf, we simultaneously obtain spectroscopy of the broad line H ( Å) and the forbidden narrow line doublet [OIII] 4959,5007 Å from the quasar, lensed by a foreground galaxy at . These emission lines arise from physically distinct regions: the narrow line region around the AGN being much more extended than the broad line region. Hence, by studying differences in the line ratios in the 4 images, we can assess the significance of sub-structure in the gravitational lens.
The magnification ratios of the QSO’s narrow line region (NLR) and broad line region (BLR) are found to disagree with each other and with the published radio and mid-infrared magnification ratios. The disagreement between the BLR ratios and the radio/mid-infrared ratios is interpreted as microlensing by stars in the lens galaxy of the BLR. This implies that the mid-infrared emission region is larger than the BLR and the BLR is pc in size. The disagreement between the radio/mid-infrared ratios and the NLR ratios is interpreted as a signature of substructure on a larger scale, possibly the missing small-scale structure predicted by the standard cold dark matter (CDM) model. A substructure mass scale as large as is ruled out while is too small if the radio and mid-infrared emission regions have the expected sizes of pc. The standard elliptical isothermal lens mass profile is not compatible with a substructure surface density of at the 95% confidence level ( for this system). The required substructure surface density at the required mass scale is high in comparison with the present expectations within the CDM model. Lens mass profiles that are flatter than isothermal – where the surface density in dark matter is higher at the image positions – are compatible with smaller quantities of substructure. The full results are presented in Metcalf, Moustakas, Bunker & Parry (2003).

4 Massive Star Clusters in NGC 1140
Moving to lower redshifts, Richard de Grijs has lead a project with the CIRPASS IFU to study the central star-burst region of NGC 1140. Our m wavelength coverage includes the bright [FeII] 1.64 m emission line, as well as high-order Brackett hydrogen lines. While strong [FeII] emission, thought to originate in the thermal shocks associated with supernova remnants, is found throughout the galaxy, both Br 12–4 and Br 14–4 emission are predominantly associated with the northern starburst region. The Brackett lines originate from recombination processes occurring on smaller scales in (young) HII regions. The time-scale associated with strong [FeII] line emission implies that most of the recent starburst event in NGC 1140 was induced in the past 35–55 Myr. Based on the spatial distributions of the [FeII] versus Brackett line emission, we conclude that a galaxy-wide starburst was induced several tens of Myr ago, with more recent starburst activity concentrated around the northern starburst region. This work is detailed in de Grijs et al. (2003, submitted to MNRAS).
5 Conclusions
Over the past year we have undertaken an extensive programme to demonstrate the power of integral field units, using the Gemini telescopes. This has included the first use of a near-infrared IFU (CIRPASS) on an 8-m telescope. In this article we have highlighted observations of three extragalactic sources -a gravitationally lensed QSO, a radio galaxy, and a low-redshift starburst- to show the variety of science accessible to IFUs. Other aspects of this programme include exploring the redshift evolution of of scaling relations such as the Tully-Fisher law, through GMOS and CIRPASS IFU observations of line emission from high-redshift disk galaxies (see Smith et al. 2003; Swinbank et al. 2003). Elsewhere in these proceedings, Rob Sharp describes CIRPASS observations of the nearby galaxy M82, and we have also embarked on an extensive IFU observing campaign to explore the nature of the galaxies responsible for the damped Lyman- absorption systems seen in QSO spectra (see Bunker et al. 2001). Coupling the light grasp of the latest 8-m telescopes with the new technology of near-infrared IFUs is opening up a hitherto unexplored parameter space, providing a valuable tool for studying galaxy evolution.
Acknowledgements.
This work was done as part of an international collaboration led by the Institute of Astronomy, Cambridge and the University of Durham (PIs: Roger Davies, Gerry Gilmore and Andrew Bunker). We are grateful to the Gemini Science Committee, the GMOS team and Gemini Observatory for their help and support, in particular Matt Mountain, Inger Jørgensen, Jean-Rene Roy, Phil Puxley, Marianne Takamiya, Bryan Miller and Kathy Roth. We thank the CIRPASS instrument team, in particular Dave King, Richard McMahon, Anthony Horton, Steve Medlen and Rachel Johnson. CIRPASS was made possible by the generous financial support of the Raymond and Beverly Sackler foundation, and the UK Particle Physics and Astronomy Research Council. The observations were done as part of a Director’s Discretionary Time programme on Gemini.References
- [1] Allington-Smith et al. 2002, PASP 114, 892
- [2] Best, P. N., et al.: 2000, MNRAS 311, 1
- [3] Bunker, A., Ferguson, A., Johnson, R., McMahon, R., Parry, I., Pettini, M., Aragón-Salamanca, A., Somerville, R. (2001). In the proceedings of the “Mining the Sky: ESO/ECF/STScI Workshop on Deep Fields”, published by Springer, eds. Cristiani, S., Renzini, A., Williams, R. E. p214 (astro-ph/0011421)
- [4] de Grijs, R., Smith, L. J., Bunker, A., Sharp, R. G., Gallagher, J. S., Anders, P., Lancon, A., O’Connell, R. W., Parry, I. R.: 2003, MNRAS submitted
- [5] Huchra, J., Gorenstein, M., Kent, S., Shapiro, I., Smith, G., Horine, E., Perley, R.: 1985, AJ, 90, 691
- [6] Mediavilla, E., et al.: 1998, ApJ, 503, L27
- [7] Metcalf, R. B., Moustakas, L. A., Bunker, A. J., Parry, I. R.: 2003, ApJ submitted (astro-ph/0309738)
- [8] Parry, I. R., et al.: 2000, SPIE 4008, 1193
- [9] Swinbank, A. M., et al.: 2003, MNRAS (astro-ph/0307521)
- [10] Smith, J. K., Bunker, A. J., Bower, R. G.: 2003, Ap& SS 284, 973