Neutrino flux variations and solar activity
We investigate temporal variations of the solar neutrino flux in 1970-1997. The periods of 11, 5 and 2 years have been found in the variations of the neutrino flux. The results indicate that a periodicity close to 5 years is the most significant in the data from both the Homestake and GALLEX experiments. Two groups of the solar activity indices have been distinguished regarding their interconnection with the neutrino flux series. The first group contains the indices showing predominantly 11-year period, while a periodicity at approximately 5 years is observed in the second group. The correlation coefficients between the neutrino flux and indices from the first group are negative, with their module not exceeding 0.5. The second group is characterized by positive correlation with the neutrino counting rates with coefficients not lower than 0.6. A discussion of findings is presented.
Key Words.:
Sun: neutrino,magnetic fields – Sun: activity1 Introduction
A noticeable progress has been achieved in the so-called ”solar neutrino problem” during the last decade. This was caused, first of all, by the flux measurements taken with new neutrino experiments like Kamiokande, Super Kamiokande, GALLEX and SAGE. These experiments (together with the Homestake experiment) have, in particular, different energy thresholds that makes it possible to study different regions of the solar neutrino spectrum. Their results have confirmed that the observed neutrino flux is by a factor of 2-3 smaller than that calculated from the standard solar model (Suzuki Suzuki (1998), Abdurashitov Abdurashitov (2002)). The analysis of recent observational data from the Super Kamiokande and Sudbury Neutrino Observatory has shown that some fraction of electron neutrinos forming in the process of thermonuclear reactions in the Sun’s core are transformed on their transit to the Earth into and neutrinos which cannot be detected by radiochemical experiments (Mikheev & Smirnov Mikheev (1987)). In this concern, another problem has drawn more attention: whether the variations of the solar neutrino flux are real and correlate with solar activity.
In a series of investigations, made mainly with use of data of Homestake experiment, it was found that the flux of the solar neutrino varies in time and these variations are related with solar activity. (Subramanian Subramanian (1979), Sakurai Sakurai (1980), Bazilevskaya et al. Bazilevskaya (1982), Bieber et al. Bieber (1990), Gavryusev & Gavryuseva Gavryusev91 (1991, 1994), Massetti & Storini Massetti93 (1993, 1996), Oakley et al. Oakley (1994), Snodgrass & Oakley Snodgrass (1999), Rivin & Obridko Rivin (1997), Ikhsanov & Miletsky Ikhsanov99 (1999, 2000, 2002)). However, some authors regard the variations as insignificant. (Bahcall Bahcall (1989), Fukuda et al. Fukuda (1996), Walther Walther97 (1997, 1999), Cattaneo Cattaneo02 (2002)). Recently Sturrock et al. (Sturrock & Scargle Sturrock01 (2001), Sturrock & Weber Sturrock02 (2002)) basing on data of relatively short series of GALLEX-GNO and SAGE experiments found that the solar neutrino flux varies on time scale comparable with weeks. Besides, Milsztajn (Milsztajn Milsztajn (2003)) states that a period of 13.75 days is observed in Kamiokande data. The latter statement, however, is negated in paper of (Yoo et al. Yoo (2003)). Therefore, the question about variability of the solar neutrino flux is still open, especially as regards variations with period longer than one year, which is studied in the present work.
Searching for time variations caused by the solar activity cycle, most investigations focused on the 11- and 2-year periodicity. Our previous paper (Ikhsanov & Miletsky Ikhsanov99 (1999)) has shown that in the region of low frequencies a periodicity close to 5 years (hereafter, 5-year periodicity) plays the most important role in the variations of the neutrino flux. It is, therefore, not sufficient to analyze a connection between these variations and indices of solar activity, displaying predominantly 11-year period. Account for 5-year periodicity essentially changes our views on a probable character of interconnection between variations of the neutrino flux and solar activity.
We have made an attempt to find an index of solar activity variations of which show pronounced manifestation of the 5-year periodicity (Ikhsanov & Miletsky Ikhsanov99 (1999)). Among many solar indices under consideration, the number of polar coronal holes (PCH) is the best to meet this requirement. It is worthwhile to note that, in spite of high enough correlation coefficient between this index and the neutrino flux (0.68), it has no direct relation to the regions with large magnetic fields on the solar surface. Furthermore, the polar coronal holes are not situated on the way of neutrinos between the solar core and the Earth.
In the present paper we give further justification of necessity to account for 5-year periodicity in the variations of the solar neutrino flux. In order to clarify a connection between the neutrino flux and solar activity, we investigate, besides the activity indices relating to the solar surface (such as Wolf sunspot numbers, sunspot areas, PCH and some characteristics of the global magnetic fields), those indices, which characterize deeper solar layers (p-modes and solar radius), as well as the near-Earth parameters (the concentration of particles and cosmic rays).
2 Periodicities in variations of the solar neutrino flux
We use the data, obtained in 1970-1994 with the Cl-Ar detector Homestake (Cleveland et al.Cleveland (1998)). The neutrino flux was measured by detecting the number of 37Ar atoms generated in the reaction +37Cl 37Ar+e-, with the counting rate being expressed in atoms per day. A series of measurements taken with the Homestake detector consists of consecutive runs of unequal duration and is contaminated with significant uncertainties. The duration of the runs had been changing around 1.2-2 months. The time series has a number of small gaps and one very continuous ( 1.6 years). That is why we applied successively a number of methods to study the time series of the neutrino flux measurements.
We have analyzed two series of the neutrino flux measurements. The first one (hereafter, series I) contains the measurements of the neutrino flux assigned to the middle of the corresponding run. On the basis of this series, we reconstructed the second one (hereafter, series II), consisting of monthly averaged neutrino flux estimates. The series I contains 108 (the number of runs) unevenly spaced flux estimates, while the second one consists of 283 monthly means from October 1970 until April 1994 (without breaks). It should be noted that we have constructed the series II by merely practical reasons since the mathematical methods of data processing are mainly applied to the evenly spaced data. As will be shown below, the result is practically the same if only those periodicities are considered which essentially exceed the intervals between observations (runs).
In order to reveal peculiarities of temporal variations within these series, we calculated, at the first stage, the estimates of the power density spectrum (PDS), using a periodogram analysis. It is known (see, e.g., (Otnes & Enochson Otnes (1978), Marple Marple (1987)) that in the spectral analysis of such data spurious peaks and frequency shifts can arise. To avoid these disadvantages, a time series is usually transformed using a data-weighting window. We applied this procedure, having chosen a Blackman-Harris (BH) window (Otnes & Enochson Otnes (1978)). Then, after subtraction of the mean values for each series, we calculated the normalized periodogram estimates of PDS. Since the series I contains unevenly spaced data, we have adopted the Lomb-Scargle techniques for their analysis(Lomb Lomb (1976), Scargle Scargle (1982)). In order to compute the values of PDS for the series II, we applied a well-known algorithm (Otnes & Enochson Otnes (1978)) based on the Fast Fourier Transform (FFT) and allowing to estimate statistical significance of the obtained peaks.
Figure 1a presents the PDS for the series I (without using BH window). Comparison with PDS obtained with the use of BH window (Fig. 1b) shows essential differences in the region of 2-year periodicity. In the first case, one can see a set of peaks in the interval 1-3 years, with the maximum peak corresponding to the period 2.1 years (see Fig.1a), while in the second case (Fig.1b) their power is essentially smaller. The same picture is seen in the PDS for the series II (Fig.1c), with a high and stable peak, corresponding to the period 4.5-4.7 years, being seen in all three figures. This proves, in particular, that the series II can be used to reveal the periodicities in the low-frequency spectral region.
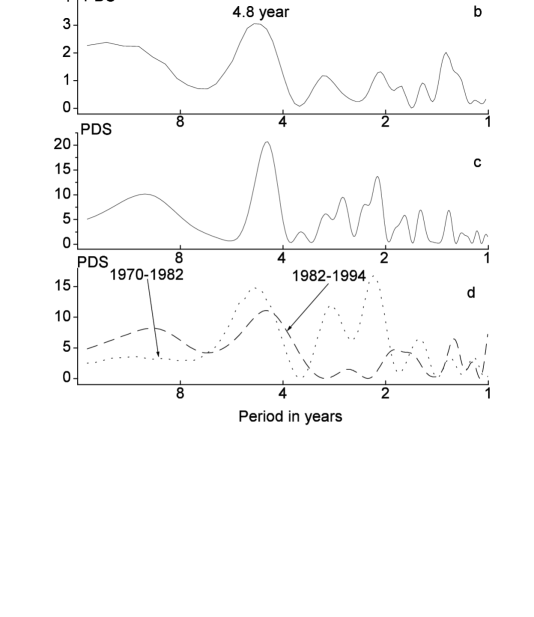
Tables I and II presents the values of significance levels for the PDS peaks under consideration, determined with the use of shuffle test, randomly reassigning measurements among runs for the series I (Sturrock et al. Sturrock (1998)), with 10000 test spectra having been computed for each estimate. In the first case (Fig. 1a), two peaks (4.6 and 2.1 years) are significant at the level 4%, which corresponds to the level of confidence probability P 96% (P=1-), while in the second case (Fig. 1b) - only one peak, which represents the 5-year periodicity (P=97%). Besides that, the peak corresponding to the period of 1.3 years can be noticed. Let us note that for the peak corresponding to the 11-year period, the level of confident probability is only 90%.
| Period in years | 10.6 | 4.50 | 3.08 | 2.07 | 1.79 | 1.58 |
|---|---|---|---|---|---|---|
| PDS | 1.39 | 3.28 | 2.31 | 3.84 | 2.72 | 2.77 |
| Significance level | 0.33 | 0.04 | 0.12 | 0.03 | 0.06 | 0.06 |
| Period in years | 13.1 | 4.86 | 3.08 | 2.07 | 1.33 |
|---|---|---|---|---|---|
| PDS | 2.38 | 3.05 | 1.18 | 1.32 | 2.02 |
| Significance level | 0.10 | 0.03 | 0.18 | 0.15 | 0.06 |
We have checked, to what extent the manifestations of the most significant periodicities, revealed in our analysis, depend on the time interval, covered by the series under investigation. For this purpose we calculated the PDS for two time intervals 1970-1982 and 1983-1994, containing data of 54 runs each. In the spectrum calculated over the first interval and shown in Fig. 1c, there is a noticeable peak near 2 years, while this peak is absent in the spectrum, computed for the second interval. This explains the fact that a number of authors have got significant amplitudes of 2-year oscillations, while the PDS, calculated over the whole series, does not contain significant signs of this periodicity. For the period around 5 years, a noticeable peak has been found in the spectra for both intervals, that indicates somewhat higher stability of the latter periodicity in comparison with 2-year oscillations.
On the above mentioned grounds, we have performed a more detailed study of the neutrino flux variations in the region of low frequencies by means of two different methods. The first method implied running-mean smoothing of the neutrino flux (Fig.2a), using a 15-month window with harmonic weights. A smoothed curve (a solid line in Fig.2b) clearly displays the presence of 5-year oscillations. The second method supposed implementation of the Butterworth filter (Otnes & Enochson Otnes (1978)) with the frequency interval of maximum transmission, corresponding to the period interval 4-14 years. The results are presented in Fig.2c. Both independent methods are in a good agreement regarding the shape of the 5-year wave. As seen in Fig.2b,c the average distance between maxima is 4.6 0.7 years. Some uncertainty is connected with the gap in observations in 1985 – 1986 (1.6 year). The case under consideration corresponds to the linear interpolation of the flux values in this interval. Fig.2a presents another possible extreme variant of the flux behavior (shown by dotted line). In this case, the maximum flux value in the region of interest is somewhat lower, and its position is shifted to the right, that, however, has not changed a general picture of 5-year oscillations. In the next section will be shown that the first case seems to be more realistic. The appearance of six consecutive 5-year periods (taking into consideration the GALLEX data) leaves no doubts about the reality of these oscillations. Fig.6a demonstrates variability of the neutrino flux over the interval 1-3 years. It indicates that a periodicity of 2 years was in operation before 1980, but had afterwards disappeared and arose again after 1991.

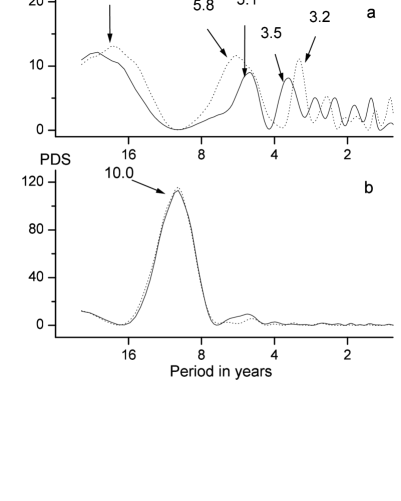
A lot of attempts have been made in the recent years to discard the question about the neutrino flux variations because of large errors in the radiochemical measurements. However, this question is very important in the study of the Sun’s nature, especially with regard to the problems of solar magnetism, since the presence of variations in the solar neutrino flux (due to either the precession of the neutrino spin (VVO-effect) or the resonance spin-flavor precession (RSFP) (Akhmedov Akhmedov89 (1989), Akhmedov97 (1997)) could make it possible to investigate the magnetic field in the interiors of the Sun. Cattaneo (Cattaneo02 (2002)) has recently criticized the data from the Homestake experiment for insufficient background reduction. The main argument of the author was that the runs with large background value should be removed from further analysis because of large uncertainties. Thus he has increased the average production of the neutrino flux up to 0.566 at/day after removing one third of the runs with large background. In principle, this argument seems reasonable, but the question is whether it can influence the character of the neutrino flux variations revealed above. In order to clarify this question, we removed one third of the runs with large background value ( 0.027) from the Homestake data and calculated the power spectrum for the rest of the data. The result is shown in Fig. 3c. The appearance of the spectrum is even better than that of the complete series (Fig. 3a). Really, the periodicities of 10, 4.5 and 2.5 years are present at the same significance level (Table I). The peak corresponding to 2.5 years has increased while all the others decreased. In addition, the same figure shows the PDS of the background values for both the complete Homestake data and the series after reduction. A weak peak can be noticed at 8 years in the first case (Fig. 3b), and at 9 years in the second case (Fig. 3d). At the same time, there are no indications on the presence of 2- and 5-years periodicities in the PS of the background values. Thus, the above analysis of the neutrino flux variations in the time interval 1970-1994 shows that 5-year periodicity represents its most stable oscillation.

3 Connection between the neutrino flux and solar activity
As mentioned in the Introduction, variations of the neutrino flux can be caused by periodic changes of solar activity. The Wolf numbers (W) are the most frequently used to search for this interrelation. Together with the index of sunspots areas, they characterize the toroidal component of the Sun’s magnetic field. Fig.2e presents the coefficients of running correlation (using the running interval of 40 months with a step of 1 month), between the series II of the neutrino flux (Fig.2a) and the W series (Fig.2d). The correlation coefficient (CC) varies essentially between -0.8 and +0.6, with its changing from -0.77 up to +0.57 over the time interval 1987-1991. This fact explains the conclusion about an absence of significant correlation during this time interval, made by a number of authors.
The average value of the CC calculated over the whole series shown in Fig.2e is equal to -0.19. If we calculate the CC between the smoothed series of neutrino fluxes II and W presented in Fig.1b and 1d, respectively, we get the value -0.49. The same or close value has been obtained by other investigators (see, e.g., (Rivin Rivin (1997))). So week correlation can be connected with the fact that during 11-year cycle of solar activity we observe two maxima in the neutrino flux series, while in the Wolf numbers - only one (Fig.2b,d).
In the previous paper (Ikhsanov & Miletsky Ikhsanov99 (1999)) we have made an attempt to find an index of solar activity, in variations of which the 5-year periodicity were manifested the most clearly. This requirement turns out to be met by the PCH number. However, they are not situated on the transit from the Sun’s core to the Earth, as required within the mechanism suggested by Voloshin, Visotsky & Okun (Voloshin (1986)) (hereafter VVO).
It is, therefore, more interesting to consider the temporal changes of the Sun’s magnetic field on the transit of neutrinos to the Earth. If we take the radii of the Sun’s core regions, where 8B and pp-neutrinos are generated, as and , respectively, then their projections on the Sun’s surface can be presented as the circles with diameter of 50 and 150. On the basis of Stanford data (1976-1998), we constructed the series of values of the magnetic field B and its module for both cases with account for annual change of the ecliptic’s inclination with respect to the plane of the Sun’s equator . As seen in Fig.4, the PDS of these two series are completely different. The PDS of the B series shows 22-, 5-, and 3-year periodicities, while that of the series displays only 10-year period. It is worthwhile to note that the PDS for 50- and 150-circles differ only in some shift of the peaks, corresponding to the 3- and 5-year periods.
Figs. 5b,c present the curves for these series after removing all the components beyond the period interval 4-14 years (using a Butterworth filter). Comparison between the series obtained by means of the same transformation of the data on magnetic field B and neutrino fluxes reveals a low degree of similarity (CC=0.45). The correlation between the neutrino flux and series is also rather low, with the CC being negative (CC=-0.43), as in the case of W-series. A higher CC can be obtained by means of further smoothing, but some essential information would be lost.

Fig.5a presents the neutrino series (a dotted line), based on the data from Kamiokande (Gavryusev & Gavryuseva Gavryusev94 (1994)) and GALLEX (Kirsten Kirsten (1999)), with distinguishing the period interval of 4-14 years by means of the same method. The curve for the first of these series (covering a short time interval) resembles, in spite of a small phase shift, that for the Homestake measurements. Regarding the Gallex series, it demonstrates surprisingly strong similarity with the Homestake data for the period interval under consideration.
The same figure presents the plots for a few more series of the solar characteristics, mentioned in the Introduction and transformed using the same techniques. For the analysis of temporal variations of the solar radius (RA), we have chosen the data obtained in the experiment CERGA (Laclare et al.Laclare (1996)), which covers, unfortunately, a shorter period (1978-1994), than the neutrino flux estimates. The advantage of these measurements is that all of them had been carried out by the same observer. The frequency shifts of p-modes, obtained at the Observatorio del Teide (1980-1994), have been taken from (Regulo Regulo (1994)). All these data, together with those on the number of PCH (Ikhsanov & IvanovIkhsanov99a (1999)), the intensity of cosmic rays (CR), concentration of interplanetary particles (ION) and on the integral value of the sunspots areas (SA) have been used to form the series of monthly mean values. They are shown in Fig.5 (after filtration using the same procedure, as for the neutrino data). The highest CC=0.82 has been obtained between the neutrino flux measurements (Fig.5a) and the RA observations (Fig.5d). Somewhat lower correlation of the neutrino data (CC=0.62) has been found with the PCH numbers (fig.5e) and ION (Fig.5f), and essentially lower with the series PM (Fig.5g), CR and SA (Fig.5h), with the CC for the latter three series being negative.
Because of a small coverage of the radius observations, the value of its CC is not confident enough. A possible shift (dashed line) of the maximum position in the neutrino flux series in 1985-1986 leads to the essential decrease of the CC from 0.83 down to 0.33. The same can be seen for PM and SA, that is caused by a strong sensitivity of the CC to a displacement of even one maximum in case of short time series. However, examining Fig 5a, one can see that the maxima of the neutrino series at the phases of minima of the 11-year cycle are noticeably higher, than the neighboring maxima. This regularity as well as some other arguments favors the conclusion, that real variations of the neutrino flux in 1985-1986 are better represented by a solid line in Fig 5a.
Summarizing, we can infer that the neutrino flux series has a positive CC with those solar activity indices, which display a pronounced 5-year periodicity, with its value being in the interval 0.6-0.8 (except for the B series). As far as the indices SA, , PM and CR are concerned, which show only 11-year period in the region of low frequencies, their CC with the neutrino data turn out to have a negative value in the interval between -0.4 and -0.5.
Fig.6 presents the curves for the series under investigation after removing (using the same procedure) all the components beyond the period interval 1-3 years. All the series demonstrate some changes in the periods and amplitudes of oscillations. As mentioned above, a periodicity close to 2 years in the neutrino flux measurements (Fig.6a) was in operation during 1970-1980, then it had disappeared, and was detected again only after 1992. The most clearly this 2-year periodicity can be seen in the RA series, but only until 1990, that is just when corresponding oscillations in the neutrino data were weak. The series of the SA and B measurements demonstrate 2-year oscillations, as a rule, near the maxima of 11-year cycles. Thus, all these indices show either very weak correlation with the neutrino flux data, or its absence, since the module of corresponding CC does not exceed 0.25 (except for RA, with CC = 0.31).

4 Conclusions
Thus, we have found, that the periodicity at approximately 5 years (4.6 0.7 years) is the most stable in the variations of the neutrino flux. The 11-year cycle manifests itself only in the fact, that the maxima of these oscillations are somewhat higher at the phases of minima of the 11-year solar activity cycle. In 1970s and 1990s a 2-year periodicity was also observed. It is especially interesting to note that 2- and 5-year periods are present in the variations of the neutrino flux measured in both Homestake and GALLEX experiments. This fact supports the reality of these variations. The 5-year oscillations can be produced either in the interiors of the Sun (like the 11- and 2-year oscillations) or as a result of some near-Earth phenomena. If the former is true, the most probable seems the assertion that the 5-year oscillations arise on the transit of the electron neutrinos from the Sun’s core to the Earth. This, however, requires some conditions on the neutrino properties and interiors of the Sun to be satisfied (Voloshin Voloshin (1986), Akhmedov Akhmedov89 (1989), Akhmedov97 (1997)). Namely, within the VVO model, for the neutrino flux to be modulated, the neutrino magnetic moment should be significant as well as a cyclic toroidal component of the magnetic field, which should exist on their way inside the Sun.
As already mentioned in the Introduction, a number of authors have been looking for a connection between the solar neutrino flux and solar activity for more than twenty years. They concentrated, however, mainly on the attempts to find a correlation with 11-year cycle. The above analysis allows to conclude, that the series of solar activity indices displaying only 11-year periodicity (W, SA, , PM and CR) show only weak correlation with the neutrino flux ( = 0.5), if not too smoothed data are analyzed. As shown above, this approach does not provide an appropriate choice of the indices, since it does not take into account an existence of oscillations at 4-5 years in the neutrino counting rates. The latter period manifests itself in the series of RA, PCH and ION indices. All of them correlate with the neutrino flux series with CC not less than 0.62. Let us note, however, that the data on RA and PM cover only short time intervals, and, therefore, some doubts may arise about the degree of their correlation with the neutrino time series. The first group of indices of solar activity, displaying 11-year periodicity, reflects mainly the properties of quadruple component of the Sun’s magnetic field. The second group (PCH, ION) relates to the dipole component of the global magnetic field (Ikhsanov & Miletsky Ikhsanov00 (2000)) and is determined by deep layers of the Sun. Finally, as seen in Fig.5a,b, near the minimum of 11-year cycle of solar activity, the magnetic field B is close to zero, while the neutrino flux reaches its maximum. This is in agreement with predictions of VVO model, that the maximum neutrino counting rates should be observed near the minimum of the toroidal magnetic field. Thus, there exists an essential interconnection between the neutrino flux and magnetic field of the Sun. In this case we can assume that a 5-year periodicity in the solar neutrino measurements can result from cyclic variations of the toroidal magnetic field, situated at the bottom of the convective zone or deeper.
Acknowledgements.
The authors are grateful to Dr. N. Beskrovnaya for her assistance in preparation of this manuscript.References
- (1) Abdurashitov J. N.: 2002, Astro-ph, 0204245.
- (2) Akhmedov E. Kh.: 1989, Sov. Phys. JETP, 68, 690.
- (3) Akhmedov E. Kh.: 1997, hep-ph, 9705451.
- (4) Bazilevskaya G.A., Stoghkov Y.I., Charahchyan T.N.: 1982, JETPh Letters, 35, 237.
- (5) Bahcall J.V.: 1989, Neutrino Astrophysics. Cambridge Univ. Press.
- (6) Bieber J.W., Seckel D., Stanev T. et. al.: 1990, Nature, 348, 407.
- (7) Cattaneo P. W.: 2002, Astro-ph, 0211534.
- (8) Cleveland B.T., Daily T., Davis R., et. al.: 1998, Astrophys. J., 496, 505.
- (9) Gavryusev V., Gavryuseva E., Roslyakov A.: 1991, Solar Phys., 133, 161.
- (10) Gavryusev V., Gavryuseva E.: 1994, Astr. Astrophys., 283, 978.
- (11) Fukuda Y., et al.: 1996,Phys. Rev. Lett., 77, 1683.
- (12) Ikhsanov R.N., Ivanov V.G.: 1999, Solar Phys., 188, 245.
- (13) Ikhsanov R.N., Miletsky E. V.: 1999, Proceedings Conf. Large scale structure of solar activity, SPb, 99.
- (14) Ikhsanov R. N., Miletsky E. V.: 2000, Izvestiya GAO, No 215. SPb, 139.
- (15) Ikhsanov R. N., Miletsky E. V.: 2002, Izvestiya GAO, No 216. SPb, 543.
- (16) Kirsten T.A.: 1999, Reviews of Modern Physics, 71, 1213.
- (17) Laclare F., Delma C., Coin J.P.: 1996, Solar Phys., 166, 211.
- (18) Lomb N.R.: 1976, Astrophys. Space Sci., 39, 447.
- (19) Marple-Jr. S.L.: 1987, Digital spectral analysis with applications. Prentice-Hall.
- (20) Massetti S., Storini M.: 1993, Solar Phys., 148, 173.
- (21) Massetti S., Storini M.: 1996, Astrophys. J., 472, 827.
- (22) Mikheev S.P., Smirnov A.Y.: 1987, UFN, 153, 3.
- (23) Milsztajn A.: 2003, hep-ph, 0301252.
- (24) Oakley D.S. et al.: 1994, Astrophys. J. (Letters), 437, L63.
- (25) Otnes R.K., Enochson L.: 1978, Applied time series analysis. John Wiley, N-Y.
- (26) Regulo C. et al.: 1994, Astrophys. J., 434, 184.
- (27) Rivin Yu.R., Obridko V.N.: 1997, Astr. Reports, 74, 83.
- (28) Sakurai K.: 1980, Publ. Astron. Soc. Japan, 32, 574.
- (29) Scargle J.D.: 1982, Astrophys. J., 263, 835.
- (30) Snodgrass H.B., Oakley D.S.: 1999, Phys. Rev. Lett., 83, 1894.
- (31) Sturrock P.A., Walther G., Wheatland M.S.: 1998, Astrophys. J., 491, 409.
- (32) Sturrock P.A., Scargle J.D.: 2001, Astrophys. J. (Letters), 550, L101.
- (33) Sturrock P.A., Weber M.A.: 2002, Astrophys. J., 565, 1366.
- (34) Subramanian A.: 1979, Curr. Sci., 48, 705.
- (35) Suzuki Y.: 1998, Space Science Reviews, 85, 91.
- (36) Voloshin M.B., Visotsky M.L., Okun L.B.: 1986, JETPh, 91, 754.
- (37) Walther G.: 1997, Phys. Rev. Lett., 79, 4522.
- (38) Walther G.: 1999, Phys. Rev. Lett., 83, 1895.
- (39) Yoo J., et al.: 2003, hep-ph, 0307070v1.