Preparing the COROT space mission: Building a photometric and variability database of stars in its field of view
Instituto de Astrofísica de Andalucía-CSIC. Camino Bajo de Hu tor, P.O. Box 3004. 18080. Granada. Spain
INAF-Osservatorio Astronomico di Brera, Via E. Bianchi 46, 23807 Merate, Italy
Observatoire de Paris, LESIA, UMR 8109, Pl. J. Jansen, 92195 Meudon, France
1. Introduction
The CNES/European space mission COROT will monitor asteroseismic targets located in selected fields to probe stellar interiors. Therefore, suitable candidate targets have to be searched for in order to optimize the scientific return of the mission. However, to be able to use the asteroseismic tools on the stars, their physical parameters must be known in advance. In this work, we detail the process of building a photometric database of all the stars brighter than mag in the field of view of COROT and the process of selecting suitable Scuti and Dor-type stars for the mission.
For an optimal selection of the seismology targets (for both COROT programs devoted to asteroseismology, i.e., the core and exploratory ones), it is essential to gather as much a priori information as possible on all potential candidates. To this aim, Strömgren-Crawford uvby–H and Ca ii H&K photometry was obtained for all of them. These data have been used to derive estimates of their effective temperature, surface gravity and metallicities. These observations, together with high resolution echelle spectroscopy and high angular resolution imaging observations are components of an ambitious ground-based program.


2. The observing program
We have used the 1.5m and 0.9m telescopes of the Sierra Nevada Observatory (OSN), managed by the IAA, to obtain and Ca ii H&K photometry of all the stars with mag among which will be, to a large extent, the primary and secondary COROT potential targets. At the 1.5m telescope, Ca ii H&K CCD photometry was gathered, while Strömgren and Crawford photoelectric photometry was obtained simultaneously in the filters at the 0.9m telescope. The whole dataset was reduced and calibrated to the respective standard systems by using specific software developed by our group (Amado et al. in prep). The GAUDI data server provides access to COROT Archive of the Ground-Based Seismology Program and it is developed and maintained by LAEFF, Spain (Solano et al. 2003). These data has been utilised to determine , and [Fe/H] of all the possible targets of B, A and F spectral types.
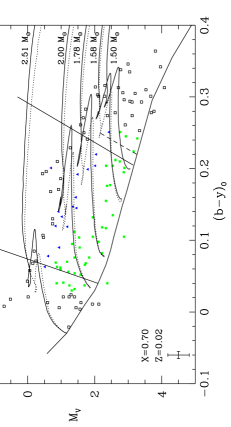
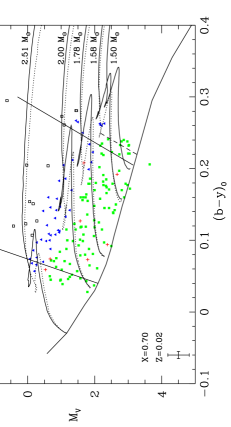
3. Colour-Magnitude diagrams
The observations mentioned above have, in part, led to the coverage of the Colour-Magnitude diagram (CMD) on and near the main sequence in the region of the Instability Strip (IS). This has helped to enlarge the sample of known Sct and Dor stars. In Figs. 1 and 2, we present the diagrams for the stars within the IS in the field of view of COROT (Center and Anticenter directions). The main sequence is taken from Philip & Egret (1980) and the Sct instability strip borders from Rodríguez & Breger (2001). The red border of the Dor instability strip is taken from Handler & Shobbrook (2002); the blue border is well inside the Sct instability strip. We also added evolutionary tracks, considering five values for the mass in the range from 1.50 to 2.51 , and hydrogen and metal content of 0.70 and 0.02, respectively. We calculated two sets of models for two different typical overshooting extension distances, i.e., and (see Claret 1995 for details). The limits of the IS for stars to the left of the Sct IS blue edge and right of the Dor IS red edge have been a little relaxed to take into account the errors in the photometric parameters.
4. Enlarging the sample of known Sct and Dor stars
Once the potential targets to be monitored were selected from their position in the CMD, dedicated observing programs have been carried out to try to make clear variability detections at the 0.005 mag level. The sample of variable stars discovered in the Center direction is quite representative of the phenomenology we meet in the lower part of the instability strip. Figure 3 shows an example of Sct variability: beat phenomena are clearly visible. Figure 4 shows an example of the Dor variability, much slower than the previous one. Both stars have been observed during the two last weeks of June 2003. The work is still going on as for some of the stars the variability has not yet been characterized in a precise way. For more examples of newly Sct and Dor stars discovered in the COROT ground–based observation program see Poretti, Garrido, Amado et al. (2003).
References
Claret, A., 1995, A&AS, 109, 441
Handler, G., Shobbrook, R. R., 2002, MNRAS, 333, 251
Philip, A. G. D., Egret, D., 1980, A&A, 40, 199
Poretti, Garrido, Amado et al., 2003, A&A, 406, 203
Rodríguez, E., Breger, M., 2001, A&A, 366, 178
Solano, E., González-Riestra, R., Catala, C., Baglin, A., 2002, in ESA SP-485: Stellar Structure and Habitable Planet Finding, p. 353