On the hydrogen emission from the Type Ia supernova 2002ic111Based on Observations Collected at the European Southern Observatory
Abstract
The discovery of SN 2002ic and subsequent spectroscopic studies have led to the surprising finding that SN 2002ic is a Type Ia supernova with strong ejecta-circumstellar interaction. Here we show that nearly 1 year after the explosion the supernova has become fainter overall, but the H emission has brightened and broadened dramatically compared to earlier observations. We have obtained spectropolarimetry data which show that the hydrogen-rich matter is highly aspherically distributed. These observations suggest that the supernova exploded inside a dense, clumpy, disk-like circumstellar environment.
1 Introduction
SN 2002ic (Hamuy et al., 2003; Wood-Vasey et al., 2002, 2003) is an important supernova (SN). Spectroscopy shows that it is a Type Ia SN with strong hydrogen emission arising from the ejecta-circumstellar interaction. Hamuy et al. (2003) point out that SN 2002ic bears a strong spectroscopic similarity to SN 1997cy, previously identified as a Type IIn (Germany et al., 2000; Turatto et al., 2000).
We present in this Letter spectropolarimetry observations of SN 2002ic obtained nearly a year after the explosion. This is the latest epoch for which spectropolarimetry has been obtained for any SN. We discuss the nature of the polarization and the structure of the circumstellar environment surrounding SN 2002ic.
2 Observations
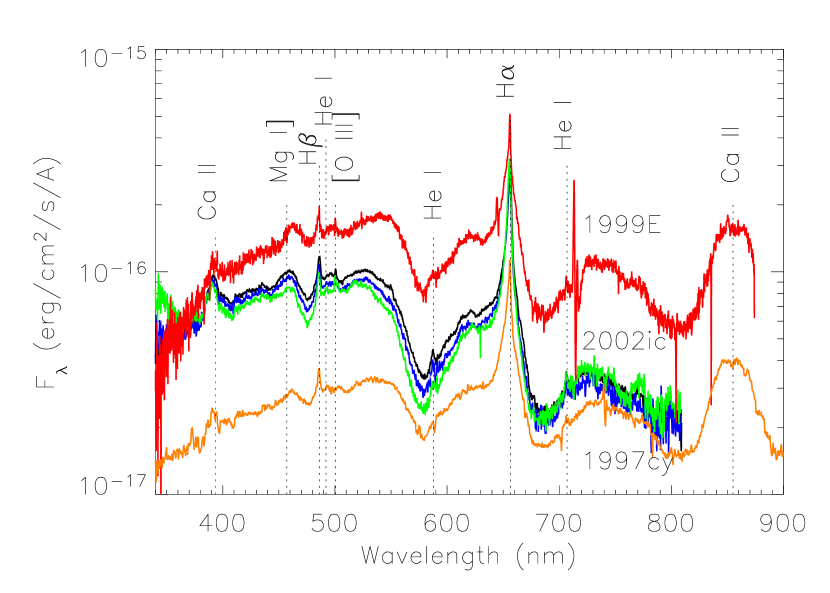
We observed SN 2002ic on 2003 July 8.4 (UT), July 29.4 (UT), Jul 31.3 (UT), and Sept 29 (UT) using the Very Large Telescope (VLT) of the European Southern Observatory (ESO) with the FORS1 instrument in spectropolarimetry mode. The conditions during the July 8.4 observations were photometric, and the seeing was around 0.7. The slit width used in these observation was 1. Four separate exposures each of 30 minutes were obtained with the retarder waveplate at position angles of 0, 45, 22.5, and 67.5 degrees. The July 8.4 (UT) data provide both reliable spectropolarimetry and spectrophotometry. The conditions for July 29.4 (UT) and 31.3 (UT) were less ideal. Only exposures at waveplate position angles of 0, 45, and 22.5 degrees were obtained on July 29.4 (UT), but all four position angles were again observed on July 31.3 (UT). The July 29.4 (UT) and July 31.3 (UT) data were combined to produce the spectropolarimetric results. The flux calibrations of the July 29.4 (UT), 31.3 (UT) and Sept. 28 (UT) data are less reliable but not by more than 10% as found from the scatter of the final reduced data set of each individual exposure. The spectral profiles show little evolution during these observations. Figure 1 shows the spectroscopic data derived from the July 8.4 (UT) observations together with the spectra of SN 1997cy (Turatto et al., 2000) and SN 1999E (Rigon el al., 2003) at comparable dates. The most prominent spectral line is the broad sharply-peaked H emission that is typical of a Type IIn SN. SN 2002ic remains strikingly similar to SN 1997cy and SN 1999E at later epochs (Hamuy et al., 2003).
2.1 Time Evolution and Comparisons to Other Type IIn Supernovae
The H line in our observations is broader than measured in earlier observations (Hamuy et al., 2003). The full width at zero intensity (FWZI) can be traced to about 20,000 km s-1 compared to an earlier value of about 4000 km s-1. The line profile shows a strong central peak and is significantly different from that of the broad Mg I] 457.1 nm line. Several lines from neutral helium and doubly ionized oxygen were also detected. The FWZI of these lines are typically around 5,000 km s-1. The profiles of these lines are actually very similar to the central peak of the H line. The broad wings, if present, may not be detectable because of line blending and the faintness of these lines.
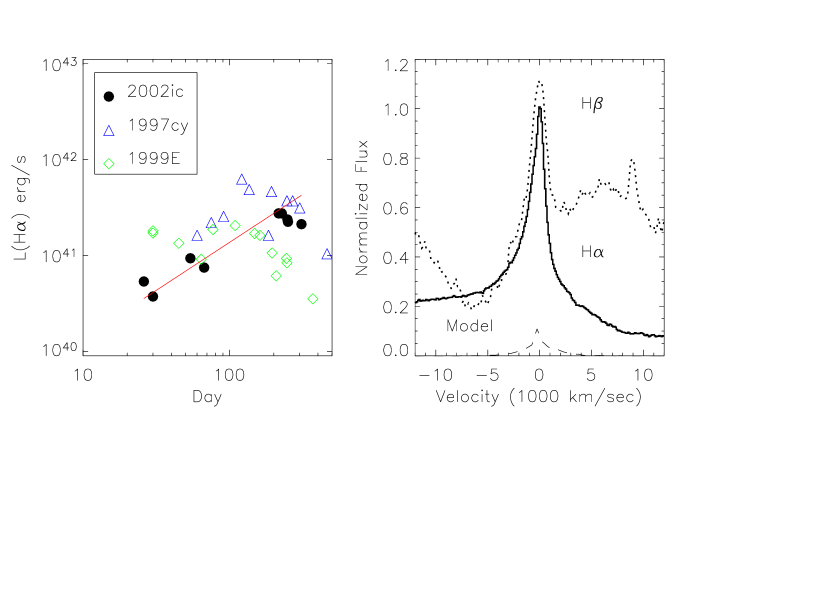
The flux of the H line increased by a factor of more than 6 compared to that of 2002 Nov 11 to 2003 Jan 9. The light curve of the H line is shown in Figure 2, together with those of SN 1997cy (Turatto et al., 2000) and SN 1999E (Rigon el al., 2003) for comparison. The H fluxes derived from our spectra are 2.2, 1.9, 1.8 and 1.7 in units of 10-14 ergs cm-2 s-1 for observations of July 8.4 (UT), July 29.4 (UT), July 31.3 (UT), and Sept 28 (UT), respectively. The brightening of the H line after optical maximum is not unique to SN 2002ic, but is also observed for similar events such as SN 1988Z (Turatto et al., 1993), SN 1997cy (Turatto et al., 2000), and SN 1999E (Rigon el al., 2003). The spectroscopic data show no remarkable evolution during these observations.
2.2 Spectropolarimetry
To investigate the details of the polarization spectral variation, it is necessary to identify the dominant axis of asymmetry in the plot of Stokes parameters, Q versus U, and to decompose the data into components along the dominant axis (Pd, hereafter) and the axis orthogonal to the dominant axis, or the secondary axis (Po, hereafter) (Wang et al., 2001, 2003). The advantage of identifying the dominant axis is that the spectral features of Pd will not be sensitive to the uncertainties of interstellar polarization (ISP) if the majority of the polarization is produced by a global asphericity of the emitting region. A weighted fit of the data points on the Q-U plot binned to 10 nm shows that the dominant axis is at a position angle of
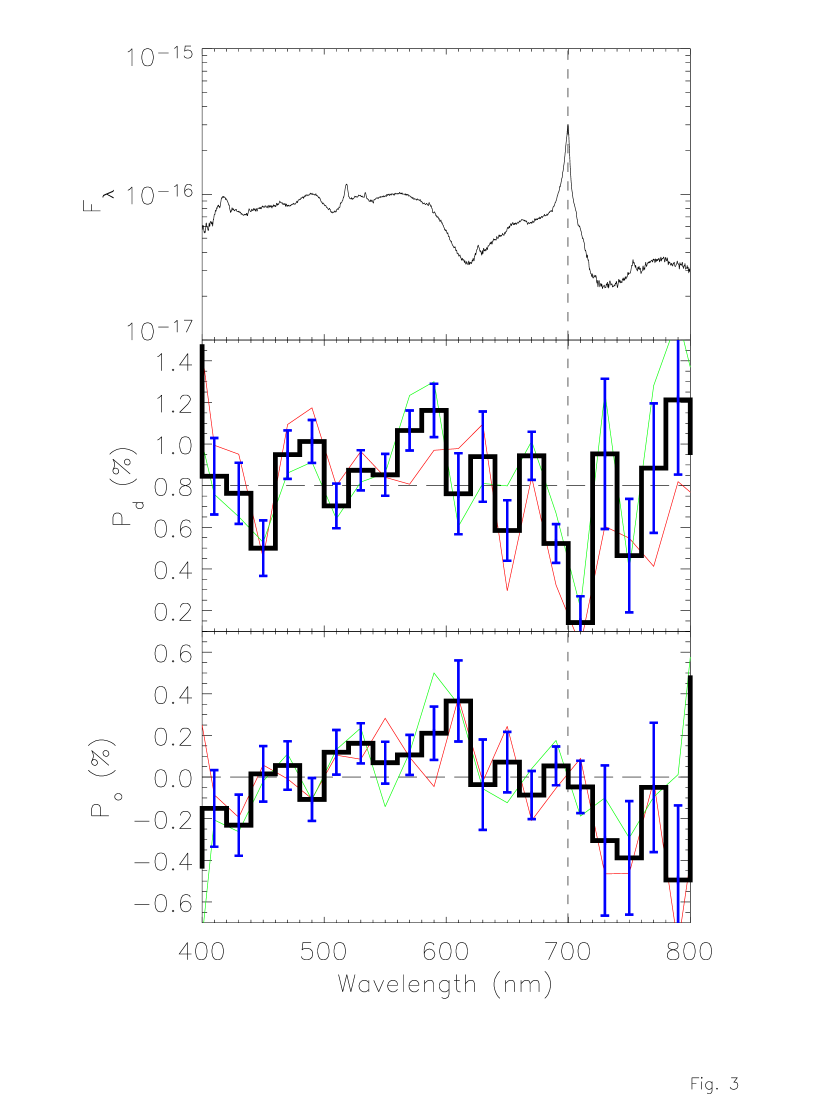
The polarization due to Galactic dust particles in the field of SN 2002ic should be less than 0.15% (Heiles, 2000) and cannot be the cause of the polarization. Dust scattering in the host galaxy may contribute. To determine the amount of host interstellar dust polarization, we assume that the observed polarization of the central, narrow peak of the H line (from 6553 - 6573 Å) is due completely to interstellar dust. This assumption is justified because line photons seen in the H-peak are produced by recombination and, thus, are intrinsically unpolarized (in the absence of large magnetic fields). In addition, the narrow-line photons, unlike the broad-lines photons, are not polarized by Thosmson scattering in the circumstellar disk because they emerge predominantly from regions with negligible electron-scattering (the thermal velocity of electrons is sufficiently high that the scattered photons are shifted to the broad wings of the H profile). We thus take the ISP to be that corresponding to the central 20 Åof the H emission peak. This gives an estimate of the ISP of about 1.6 percent with components and . With this ISP we determine the net polarization to be about 1 percent for wavelength regions outside the narrow H emission peak. The dominant and secondary polarization components after correcting for ISP are shown in Figure 3. It can be seen that across the H line center the dominant component Pd is indeed different than that of other wavelength regions.
The polarization is different from what was found in other SN Ia such as SN2001el (Wang et al., 2003) which shows a strong feature at 615 nm corresponding to the strong line of Si II. The polarization in SN 2002ic is likely to be related to the circumstellar medium (CSM) rather than to the explosion process itself.
3 The Circumstellar Matter Disk
3.1 Constraints from H Emission Line
At the dates of these observations, SN 2002ic is powered by the high energy photons from the ejecta-CSM shock. The velocity of the ejecta-CSM shock is found to be around 11,500 km s-1 from the width of the emission lines associated with the ejecta, such as the Mg I] 457.1 nm line and the Ca II IR triplet. As noted above, the H line has a remarkably different profile than the Mg I] line, suggesting different origins of these emission lines. Also, the He I and the [O III] lines are typically narrower than the MgI] line with profiles similar to the central peak of the H. This is important evidence that the narrow component of the H and the He I lines are produced in the CSM and that the composition of the SN ejecta, as reflected in the Mg and Ca lines, is consistent with that of a typical Type Ia.
If the CSM is due to a stellar wind, the luminosity of the H from the unshocked wind is , where is the radius of the shock in units of cm and we have taken the emissivity for Case B recombination at a temperature of 10,000 K. The emissivity is a weak function of temperature and changes slightly with H opacity (Xu et al., 1992). This is a decreasing function of time and cannot explain the rise of the H flux. If the CSM were dense enough, the shocked CSM may become radiative and produce enough H emission to account for the observed flux; however, the line profile from a thin shell of material moving at the shock speed of 11,500 km s-1 would be flat-topped and hence inconsistent with the observed H line profile. The mass of hydrogen required to produce the observed H luminosity is 6M. More realistic modeling of H emission may alter this estimate but is unlikely to change the qualitative conclusion that a few solar masses of dense hydrogen-rich matter is required to explain the H luminosity.
3.2 Constraints of the Spectropolarimetry
The configuration we encounter here is different from those for normal SN Ia where the polarization is produced by electron scattering from an aspherical photosphere(Höflich, 1991). Mass loss from AGB stars is known to be highly asymmetric and predominantly on the equatorial plane. The polarization is due to scattering by the dense CSM of photons originate from the SN at the center. Such systems have been studied in great detail in models of polarizations of Be stars. In these models the opening angle of the scattering CSM has the shape of disk with openning angles typically of the order a few degrees in order to repoduce an observed polarization of order 0.5 - 1% (McDavid, 2001; Melgarejo el al., 2001). Such a geometry is in good agreement with the required several solar masses of hydrogen with densities above 108 cm-3 that contributes to the H emission. The dense CSM must have a small volume filling factor.
4 Ejecta-CSM Interaction and the H Line Profile
If the mass loss during the AGB phase were predominantly in the equatorial plane, we would expect the shock of the ejecta-CSM interaction to be hour-glass shaped. The disk of unshocked CSM could be ionized by the hard photons from the ejecta-CSM interaction and give rise to the central peak of the H emission whereas the shocked CSM could be radiative and give rise to the broad H wings. Detailed calculations are needed to see if this scenario can account for the observed line profile and the increase of H luminosity while the overall luminosity decreases.
Another possibility is that broad wings of H are formed by scattering, rather than emission from shocked matter. If the CSM is optically thick to electron scattering, electron scattering can effectively broaden the H line and produce a center-peaked profile (Chugai, 2003). An example of such a profile is shown in Figure 2. For this simple model spherical symmetry and a temperature of 30,000 K, presumably produced by the flash ionization of the CSM, are assumed. Note that this model can produce the smooth line profile with both the narrow peak and the broad wings whereas such an agreement would require careful tuning of a model where the broad wings were shock-accelerated material and the narrow core were from nearly stationary CSM. In this model, photons that remain within the core have not been scattered and is thus unpolarized.
It is likely that the flattened CSM is not uniform, but clumpy so that the H line is dominated by emission from the densest clumps. The clumps may have densities of about cm-3 with sizes of about cm at which point they would be marginally optically thick to Thompson scattering and hence provide the sort of line profiles illustrated by the simple model in Figure 2. As noted above, about 1 M⊙ of matter is needed in the clumps/disk to reproduce the observed H luminosity.
If the disk and dense clumps extend to 200 light days, cm, the rising flux of H could be the result of the time delay effect. At early times, only a small fraction of the dense clumps would be visible and only at around day 200 when these observations were made would the majority of the CSM clumps be observed, therefore giving rise to the increased H luminosity. In the mean time, the emission from the ejecta-CSM interaction should show a constant decrease of luminosity after reaching maximum a few weeks past explosion, as observed.
5 Conclusions
The strong growth in the H luminosity, the H line profile, and the polarization we observe for SN 2002ic are consistent with several solar masses of clumpy material arrayed to distances of cm in a manner that is globally asymmetric. The CSM may be related to the dense disks or rings observed in some proto-planetary nebulae (Zijlstra et al., 2001; Slijkhuis, de Jong, & Hu, 1991; Su et al., 1998). The mass loss was found to be highly asymmetric at this stage. For example, IRAS 16342-3814 (Zijlstra et al., 2001) shows a dense torus with mass 0.1 M⊙ and density of . Alternatively, a similar configuration may be produced during the binary evolution leading to the thermonuclear explosion. During a phase of rapid expansion of the donor star very high mass loss may be channeled through the outer Langrange points. Wind interaction (Kwok, 1993) can create dense shells or rings that may naturally explain the observed structure (Kwok, 1993; Young et al., 2003).
The star that exploded as SN 2002ic could be either the dying post AGB star (Swartz et al., 1991) or a pre-existing white dwarf companion around it. The large radial extent of the disk seems to be incompatible with a model in which the hydrogen represents an expelled common envelope at a distance of cm (Livio & Riess, 2003). The proto-planetary nebula phase lasts only for a few hundred years. This may account for the rarity of events like SN 2002ic, but raises questions of how the SN is timed to precisely this phase. Alternatively, a structure with similar properties may be produced during the binary evolution leading to the explosion, although questions of the phasing remain. In any case, events such as SN 2002ic suggest that SN Ia can occur in a wide range of CSM environments.
We are grateful to ESO for the generous allocation of observing times. We are indebted to Massimo Turatto for providing data of SN 1997cf and SN 1999E in digital format.
References
- Chugai (2003) Chugai, N. N. 2003, MNRAS, 326, 1448
- Chugai & Yungelson (2003) Chugai, N. N. & Yungelson, Y. 2003, astro-ph/0308297
- Fransson, Lundqvist, & Chevalier (1996) Fransson, C., Lundqvist, P., & Chevalier, R. A. 1996, ApJ, 461, 993
- Germany et al. (2000) Germany, L. M., Reiss, D. J., Sadler, E. M., Schmidt, B. P. & Stubbs, C. W. 2000, ApJ, 533, 320
- Heiles (2000) Heiles, G. 2000, AJ, 119, 923
- Höflich (1991) Höflich P. 1991 A&A, 246, 481
- Livio & Riess (2003) Livio, M. & Riess, A. 2003, ApJL, 594, L93
- Kwok (1993) Kwok, S. 1993, ARAA, 31, 63
- Hamuy et al. (2003) Hamuy, M. et al. 2003, Nature, in press
- McDavid (2001) McDavid, D. 2001, ApJ, 553, 1027
- Melgarejo el al. (2001) Melgarejo, R. Magalhaes, A. M., Carcofi, A. C. & Rodrigues, C. V. 2001, A&A, 377, 581
- Rigon el al. (2003) Rigon, L. et al. 2003, MNRAS, 340, 191
- Slijkhuis, de Jong, & Hu (1991) Slijkhuis, S., de Jong, T., Hu, J. Y. 1991, A&A, 248, 547
- Su et al. (1998) Su, K. Y. L. et al. 1998, ApJ, 508, 774
- Swartz et al. (1991) Swartz, D. A., Wheeler, J. C. & Harkness, R. P. 1991, ApJ, 374, 266
- Turatto et al. (2000) Turatto, M. et al. 2000, ApJL, 534, 57
- Turatto et al. (1993) Turatto, M. et al. 1993 MNRAS, 262, 128
- Wang et al. (2001) Wang, L. et al. 2001, ApJ, 550, 1030
- Wang et al. (2003) Wang, L. et al. 2003, ApJ, 591, 1110
- Wood-Vasey et al. (2002) Wood-Vasey, W. M. et al. 2002, IAUC, 8019
- Wood-Vasey et al. (2003) Wood-Vasey, W. M. et al. 2003 in preparation
- Xu et al. (1992) Xu, Y., McCray, R., Ernesto, O., & Randich, S. ApJ, 386, 181
- Young et al. (2003) Young, P. A., Highberger, J. L., Arnett, D. & Ziurys, L. M. 2003, ApJ, submitted (astro-ph/0309545)
- Zijlstra et al. (2001) Zijlstra, A. A. et al. 2001, MNRAS 322, 280