Early optical and millimeter observations of GRB 030226 afterglow
The CCD magnitudes in Johnson and Cousins photometric passbands for the afterglow of the long duration GRB 030226 are presented. Upper limits of a few mJy to millimeter wave emission at the location of optical are obtained over the first two weeks. The optical data presented here, in combination with other published data on this afterglow, show an early band flux decay slope of 0.770.04, steepening to 2.050.04 about 0.650.03 day after the burst. Interpreted as the “jet break”, this indicates a half opening angle of degree for the initial ejection, for an assumed ambient density of . Broadband spectra show no appreciable evolution during the observations, and indicate the presence of synchrotron cooling frequency near the upper edge of the optical band. From the broadband spectra we derive an electron energy distribution index and an intrinsic extinction . Millimeter upper limits are consistent with these derived parameters.
Key Words.:
Photometry – GRB afterglow – flux decay – spectral index1 Introduction
Multi-wavelength observations of an afterglow of a Gamma Ray Burst (GRB), an event which emits ergs of energy in a few seconds, provide valuable information about its progenitor (Mészáros, 2002). Optical observations occupy the central place in such studies as they provide information about distance as well as isotropic/non-isotropic nature of the emission (e.g. Sagar 2002). In this paper we present the early optical and millimeter-wave observations of the long duration ( 100 sec) GRB 030226 (H10893). It was detected by HETE FREGATE, WXM, and soft ray camera (SXC) instruments at UT on 26th Feb 2003 (Suzuki et al. 2003). Fox, Chen & Price (2003) discovered its optical afterglow (OA) within the HETE error circle at (J2000) with an uncertainty of in each coordinate (Price, Fox & Chen 2003). ray afterglow of the GRB 030226 was discovered by Chandra ray observatory 37.1 hours after the burst at the OT position (Pedersen et al. 2003). Spectroscopic observations performed by Ando et al. (2003) on 2003 Feb 26.31 UT yield a value of redshift z 2.1, which was later refined to 1.99. VLT spectroscopic observations indicate z = 1.986 0.001 or larger using FeII, AlII and CVI absorption lines (Greiner et al. 2003a). Based on Keck II high resolution spectra, Price et al. (2003) calculated the redshift systems at z = 1.043,1.948 and 1.961. Chornock & Fillippenko (2003), using low resolution spectrograph on Keck I, deduce that the highest redshift system is associated with the GRB afterglow.
Dai & Wu (2003) modeled the GRB 030226 afterglow light curve and concluded that a discontinuous jump in the ambient density is indicated by the data. However this work made use of the preliminary magnitude estimates communicated in the GRB Coordinates Network (GCN), which show a large scatter. This is most probably due to the use of inhomogeneous photometric calibrations: those given by Garnavich, von Braun & Stanek (2003) and Henden (2003) differ by 0.06 and 0.01 mag in for two important comparison stars in the field, designated and respectively. For reliable determination of parameters from the light curve of the OA, consistent and secure photometric calibrations are needed. We provide this by imaging PG0918+029 standard region of Landolt (1992) along with GRB 030226 field.
2 Observations and data reductions
The millimeter wave and broad band optical observations of the GRB 030226 afterglow are described in the following subsections.
2.1 Millimeter Wave Observations
The GRB 030226 afterglow was observed with the Plateau de Bure Interferometer (Guilloteau et al. 1992) in a six-antenna extended configuration on the dates listed in Table 1. Flux calibration includes a correction for atmospheric decorrelation which has been determined with a UV plane point source fit of the phase calibration quasar 1156+295. The carbon star MWC349 has been used as a primary flux calibrator due to its well-known millimeter spectral properties (see e.g. Schwarz 1980). There is no detection of millimeter wave emission at the location of OA during two weeks of observations after the burst (see Table 1).
Table 1. Millimeter wave observations of the GRB 030226 afterglow.
| Start | end | center | frequency | Flux |
|---|---|---|---|---|
| time | time | time | (GHz) | center (mJy) |
| Feb 27.866 | 28.045 | 27.956 | 85.283 | +0.540.31 |
| Feb 27.866 | 28.045 | 27.956 | 220.311 | 0.901.96 |
| Mar 02.107 | 02.291 | 02.199 | 89.199 | 0.500.76 |
| Mar 08.178 | 08.233 | 08.206 | 91.995 | 1.010.70 |
| Mar 08.178 | 08.233 | 08.206 | 232.032 | 0.833.45 |
| Mar 10.166 | 10.197 | 10.182 | 90.782 | 0.430.84 |
| Mar 10.166 | 10.197 | 10.182 | 221.903 | 4.003.86 |
| Mar 11.908 | 12.014 | 11.961 | 114.676 | +0.730.68 |
| Mar 11.908 | 12.014 | 11.961 | 230.973 | 2.131.51 |
| Mar 14.942 | 15.126 | 15.034 | 92.097 | +0.230.34 |
| Mar 14.942 | 15.126 | 15.034 | 219.006 | 0.251.12 |
2.2 Optical observations and calibrations
The broad band Johnson and Cousins observations of the OA were carried out from 26 to 27 Feb 2003 using 2-m Himalayan Chandra Telescope (HCT) of the Indian Astronomical Observatory (IAO), Hanle and the 104-cm Sampurnanand telescope of the State Observatory, Nainital. At Nainital, the CCD chip of size 2048 2048 pixel2 covers a field of with one pixel corresponding to 0.38 square on the sky. The gain and read out noise of the CCD camera are 10 and 5.3 respectively. At Hanle, the CCD used was 1024 1024 pixel2, the entire chip covering a field of on the sky. It has a read out noise of 11 and gain is 4.8 . During good photometric sky conditions, the CCD observations of the OA field along with Landolt (1992) standard PG0918+029 region were obtained on 26/27 Feb 2003 for calibration purposes. Several twilight flat field and bias frames were also obtained during the observing run for the CCD calibrations.
ESO MIDAS, NOAO IRAF and DAOPHOT-II softwares were used for cleaning and image processing of CCD frames. At Nainital, on the night of 26/27 Feb 2003, atmospheric extinction coefficients determined from the observations of PG0918+029 bright stars are 0.57, 0.32, 0.20, 0.17 and 0.15 mag in and filters respectively. The five standard stars in the PG0918+029 region cover a range of in color and of in brightness. They yield the following transformation equations:
where are standard magnitudes and and represent the instrumental magnitudes normalized for 1 second of exposure time and corrected for atmospheric extinction. The colour coefficients, zero - points and errors in them are determined by fitting least square linear regressions to the data points. Using these transformations, photometric magnitudes of 10 secondary standard stars are determined in the GRB 030226 field and their average values are listed in Table 2. The CCD pixel coordinates are converted into values using the astrometric positions given by Henden (2003). All these stars, observed 3 to 4 times in a filter, have internal photometric accuracy better than 0.01 mag. A comparison between our photometry and that of Henden (2003) yields zero-point differences of and mag in and filters respectively. These numbers are based on the comparison of secondary stars having range in brightness from to 17.5 mag. There is no colour dependence in the photometric differences. We therefore conclude that photometric calibration used in this work is secure.
Our observations started about 0.5 day after the burst and are valuable for dense temporal coverage of the light curve. Several short exposures up to a maximum of 30 minutes were generally given while imaging the OA (see Table 3). In order to improve the signal-to-noise ratio of the OA, the data have been binned in pixel2 and also several bias corrected and flat-fielded CCD images of OA field taken on a night are co-added in the same filter, when found necessary. From these images, profile-fitting magnitudes are determined using DAOPHOT-II software. To determine the difference between aperture and profile fitting magnitudes, we constructed an aperture growth curve of the well-isolated stars and used them to determine aperture (about 5 arcsec) magnitudes of the OA. They are calibrated differentially with respect to the secondary standards listed in Table 2 and the values derived in this way are given in Table 3. The distribution of these 34 data points is .
The secondary standards are also used to calibrate other photometric measurements of OA published in GCN circulars by Ando et al. (2003), Covino et al. (2003), Fatkhullin et al. (2003), Garnavich von Braun & Stanek (2003), Greiner et al. (2003b), Guarnieri et al. (2003), Maiorano et al. (2003), Nysewander et al. (2003), Price & Warren (2003), Rumyantsev et al. (2003ab), Semkov (2003) and Von Braun et al. (2003). The distribution of these 27 photometric data points is .
Table 2. The identification number (ID), for epoch 2000, standard and photometric magnitudes of the stars in the GRB 030226 region are given. Garnavich von Braun & Stanek (2003) stars and are the stars 6 and 4 respectively. Number of observations taken in and filters are 3, 4, 4 and 3 respectively.
| ID | ||||||
|---|---|---|---|---|---|---|
| (h m s) | (deg m s) | (mag) | (mag) | (mag) | (mag) | |
| 1 | 11 32 44 | 25 58 52 | 17.01 | 0.81 | 0.51 | 0.96 |
| 2 | 11 32 46 | 25 56 56 | 16.72 | 1.12 | 0.64 | 1.20 |
| 3 | 11 32 47 | 25 51 58 | 16.10 | 0.62 | 0.38 | 0.75 |
| 4 | 11 32 59 | 25 52 38 | 17.45 | 0.56 | 0.35 | 0.68 |
| 5 | 11 33 00 | 25 57 13 | 15.32 | 0.60 | 0.36 | 0.71 |
| 6 | 11 33 03 | 25 51 30 | 16.14 | 1.16 | 0.68 | 1.24 |
| 7 | 11 33 05 | 25 58 12 | 17.29 | 0.80 | 0.45 | 0.88 |
| 8 | 11 33 18 | 25 50 30 | 15.87 | 0.81 | 0.48 | 0.91 |
| 9 | 11 33 19 | 25 48 37 | 16.43 | 0.66 | 0.41 | 0.79 |
| 10 | 11 33 28 | 25 51 07 | 16.46 | 1.07 | 0.65 | 1.22 |
Table 3. CCD broad band optical photometric observations of the GRB 030226 afterglow. At Hanle, 2-m HCT was used while at Nainital, 104-cm Sampurnanand optical telescope was used.
| Date (UT) of | Magnitude | Exposure time | Telescope |
| 2003 February | (mag) | (Seconds) | |
| passband | |||
| 26.7729 | 20.170.11 | 1800 | 104-cm |
| passband | |||
| 26.6969 | 20.420.08 | 2300 | 104-cm |
| 26.7326 | 20.310.07 | 600 | 104-cm |
| 26.8479 | 20.820.08 | 600 | 104-cm |
| passband | |||
| 26.6837 | 19.870.04 | 2300 | 104-cm |
| 26.7335 | 20.170.03 | 900 | HCT 2-m |
| 26.7410 | 20.250.05 | 600 | 104-cm |
| 26.8049 | 20.310.05 | 600 | 104-cm |
| 26.8172 | 20.330.05 | 900 | HCT 2-m |
| 26.8597 | 20.330.05 | 900 | 104-cm |
| 26.9120 | 20.680.11 | 900 | HCT 2-m |
| passband | |||
| 26.6398 | 19.600.06 | 450 | HCT 2-m |
| 26.6484 | 19.640.05 | 700 | HCT 2-m |
| 26.6575 | 19.550.05 | 700 | HCT 2-m |
| 26.6674 | 19.520.04 | 2300 | 104-cm |
| 26.6678 | 19.620.05 | 900 | HCT 2-m |
| 26.6805 | 19.630.04 | 900 | HCT 2-m |
| 26.6925 | 19.670.04 | 900 | HCT 2-m |
| 26.7065 | 19.760.04 | 900 | HCT 2-m |
| 26.7216 | 19.780.04 | 900 | HCT 2-m |
| 26.7493 | 19.740.04 | 600 | 104-cm |
| 26.8139 | 19.840.04 | 600 | 104-cm |
| 26.8715 | 20.220.06 | 900 | HCT 2-m |
| 26.8715 | 20.110.04 | 900 | 104-cm |
| 26.8968 | 20.230.06 | 900 | HCT 2-m |
| 26.9932 | 20.450.06 | 2900 | HCT 2-m |
| 27.8074 | 21.980.14 | 900 | 104-cm |
| 27.8750 | 22.000.15 | 1800 | 104-cm |
| passband | |||
| 26.6774 | 19.000.07 | 2300 | 104-cm |
| 26.7576 | 19.340.09 | 600 | 104-cm |
| 26.7764 | 19.590.04 | 900 | HCT 2-m |
| 26.8229 | 19.520.09 | 600 | 104-cm |
| 26.8333 | 19.510.06 | 600 | HCT 2-m |
| 27.8306 | 21.780.34 | 2900 | 104-cm |
Table 4. Fitted parameters of GRB 030226 afterglow. The sharpness parameter = 3 is fixed. Large errors in derived parameters of band may be due to sparse data-set.
| Fitted | B | V | R | I |
|---|---|---|---|---|
| Parameters | band | band | band | band |
| ….. | ….. | 0.770.04 | ….. | |
| 2.710.17 | 2.030.07 | 1.990.06 | 1.820.34 | |
| 0.670.06 | 0.560.07 | 0.690.04 | 0.520.32 | |
| 20.690.16 | 20.080.19 | 20.020.06 | 19.240.95 | |
| 2.59 | 3.82 | 2.06 | 5.13 |
3 Optical photometric light curves
Fig. 1 shows the light curve of GRB 030226 afterglow in and passbands. Present observations in combinations with above mentioned published ones are used in the plot. The X-axis is log . Here is the time of observation and 2003 Feb 26.157315 UT is the burst epoch.
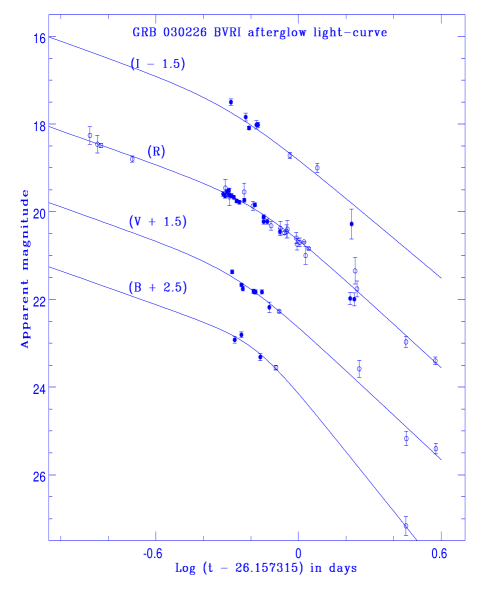
The light curve appears to steepen after 0.6 day in passband. Lack of early observations makes it difficult to see this transition in light curves. To determine the flux decay constants and the break time, we fitted the following empirical function (see Rhoads & Fruchter 2001) which represents a broken power-law, to the band light curve.
| (1) |
where and are asymptotic power-law slopes at early and late times with and controls the sharpness of the break, a larger implying a sharper break. is the magnitude at the cross-over time . The function describes a light curve falling as at and at . The results of the fit are presented in table 4. The value of has been fixed at , which helped to achieve the minimum . The early time band data of the OA presented by Ando et al. (2003), Price & Warren (2003) and Von Braun et al. (2003) were based on nearby USNO A-2.0 stars in the GRB 030226 field which are brighter by 0.4–0.5 mag than that determined from our calibration. It is significant to note that once this difference in calibration is accounted for, there appears to be no sign of the re-brightening of the OA around 0.5 day after the burst, contrary to the claim by Dai & Wu (2003). The band data can be well fitted in terms of broken power law using equation (1). Due to lack of early data points in and passbands, in carrying out fits for these bands we fixed the value of at 0.77, as determined from -band. These results are also tabulated in table 4. The derived value of in band is larger than in other bands, but this may be due to sparse late time data points; the deviation is within 3 sigma of the average value of deviation in . In Fig. 1 the best fit light curves obtained in this way for passbands are shown. It can be seen that the observations presented here lie near the jet break time, filling important gaps in the published data.
In the light of the above, we conclude that the early time light curve decay slope is 0.770.04 and the weighted mean values of parameters and are 0.650.03 and 2.050.04 respectively. The value of is flatter than the observed ray flux decay of 3.61.0 (Sako & Fox 2003) but agrees well with 2 determined by Klose et al. (2003) and Dai & Wu (2003). The value of indicates that the observed break in the light curve is sharp, unlike the smooth break observed in the optical light curve of GRB 990510 (Stanek et al. 1999; Harrison et al. 1999) but similar to the sharp break observed in the optical light curves of GRB 000301c (Sagar et al. 2000, Pandey et al. 2001); GRB 000926 (Harrison et al. 2001, Sagar et al. 2001a, Pandey et al. 2001); GRB 010222 (Masetti et al. 2001, Sagar et al. 2001b, Stanek et al. 2001, Cowsik et al. 2001) and GRB 011211 (Jakobsson et al. 2003).
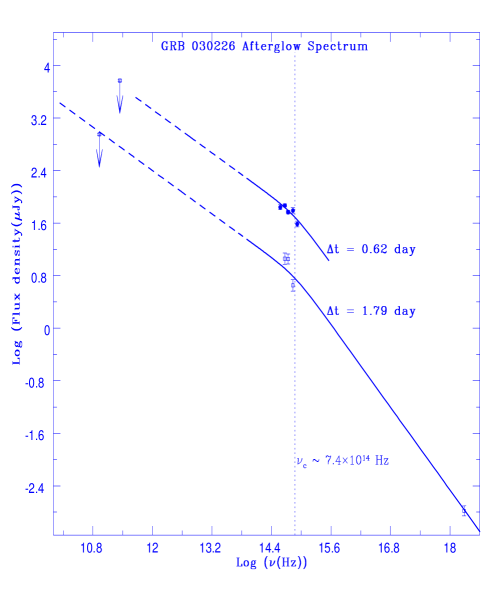
4 Spectral Energy Distribution
Fig. 2 shows the spectrum of GRB 030226 afterglow from millimeter to ray region. We construct the GRB 030226 afterglow spectrum at two possible epochs to cover the longest spectral range: = 0.62 day, an epoch near the jet break, and = 1.79 day, corresponding to the epoch of ray observations. We also estimate the millimeter upper limits from the present measurements for the epoch = 1.79 day. The reddening map provided by Schlegel, Finkbeiner & Davis (1998) indicates a small value of mag for the Galactic interstellar extinction towards the burst. We used the standard Galactic extinction reddening curve given by Mathis (1990) to convert apparent magnitudes into fluxes, with the effective wavelengths and normalizations from Fukugita et al. (1995) for . ray measurements were obtained by Pedersen et al. (2003) in 2 – 10 KeV energy range. Considering mid UT as the epoch and 20 % uncertainty in the measurements, we calculate the ray flux at = 1.79 day. For the epochs under study it is observed that the flux increases as the frequency decreases.
In the simple synchrotron model of the GRB afterglow, the light curves and spectral energy distributions are generally described as a power law: . The spectral slope depends on the location of spectral breaks. So does the decay slope , which also has an additional dependence on the dynamics of the fireball. However within each regime and are functions only of , the power law exponent of the electron Lorentz factor. For an initially collimated ejection, at late times when the evolution comes to be dominated by the lateral spreading of the jet, the value of is expected to approach . The value of is expected to be above the cooling frequency and below it, down to the peak of the spectrum, in the slow cooling case (Sari, Piran & Halpern 1999). In the present case the post jet-break flux decay constant is determined to be , indicating that the electron energy distribution index must be close to this value (Rhoads 1999). At day, the fitted spectrum through the optical band has spectral slope and at day, . The determined values of at both epochs are similar and are consistent with the measured if in the optical band. However this predicts a pre jet-break decay constant around 1.1, much steeper than the observed value of . So the cooling frequency is unlikely to be below the optical band. A consistent picture, including the measured X-ray flux, can be obtained if the cooling frequency is located just above the optical band, and the intrinsic optical spectrum of the afterglow is flatter, with a slope . Extinction along the line of sight would steepen the optical spectrum, and could explain the observed . The estimated Galactic extinction of mag does not change the slope much, so we attribute the rest of the extinction to the host galaxy of the GRB. Assuming , we find that mag in the host galaxy, with an extinction law similar to that in starburst galaxies (Calzetti et al. 1997), can reproduce the expected spectrum. Assuming that the cooling frequency is located Hz, the result is consistent also with the X-ray flux observed at day (see Fig. 2). The cooling frequency is expected to be nearly the same even in the day spectrum since both epochs fall after the jet break. We found that a host extinction law similar to that for our galaxy (Cardelli et al. 1989) is unable to provide a consistent fit: the presence of the 2200Å bump introduces additional scatter in the data. A combined fit to spectra at both epochs, with and fixed to the above values, yields the following estimate for the extinction in the host galaxy: mag.
The two millimeter upper limits at day lie close to or above the extrapolation of the optical spectrum, and are therefore consistent with the above interpretation. It may be noted that the above derived parameters have an accuracy of 10 – 20 % only, as they are based on a few available observed data points.
5 Discussion and Conclusions
We have presented optical photometry of the afterglow of GRB 030226 in bands from 0.5 to 2 days and millimeter observations for up to 20 days after the burst. We do not detect millimeter wave emission down to a few mJy. The overall flux decay observed in band is well understood in terms of a jet model. The flux decay constants at early and late times are 0.770.04 and 2.050.04 respectively, and the jet break time is 0.650.05 day. These decay indices indicate a value of the electron energy distribution index . Comparison of the observed broadband spectrum with that predicted by synchrotron emission model suggests an extinction mag in the host galaxy, and an extinction law similar to that found in starburst galaxies (Calzetti et al. 1997). The cooling break is inferred to be located at the upper edge of the optical band, Hz.
GRB 030226 belongs to a small subset of GRBs which display a steepening in the optical afterglow light curve (“jet break”) within a day after the burst. Other known cases include GRB 980519 ( day, Jaunsen et al. 2001), GRB 010222 ( day, Stanek et al. 2001, Sagar et al. 2001b), GRB 020813 ( day, Bloom et al. 2002) and GRB 030329 ( day, Burenin et al. 2003). Of these, GRB 980519 showed a cooling break between optical and X-ray bands (Jaunsen et al. 2001), GRB 010222 had its cooling break below the optical band (Sagar et al. 2001b) and in the present case we infer the cooling break to be at the upper edge of the optical band. GRB 010222 also exhibited a hard electron energy spectrum (Bhattacharya 2001, Sagar et al. 2001b).
The observed fluence of 5.7 erg/cm2 in the energy band 30 – 400 KeV with the measured redshift z = 1.9860.001 indicates an isotropic equivalent energy release erg for = 65 km/s/Mpc in a = 0.3 and = 0.7 cosmological model. The observed jet-break time of day leads to an estimated jet half-opening angle of degree, for an assumed particle density n = 1 cm-3. The total energy output in the jet then works out to be erg for a ray efficiency , after applying the cosmological K-correction (Bloom et al. 2001). This is close to the estimated mean energy output in Gamma Ray Bursts (Frail et al. 2001, Kulkarni et al. 2003, Berger et al. 2003), and supports the case for GRBs as standard energy reservoirs.
Acknowledgements
This research has made use of data obtained through the High Energy Astrophysics Science Archive Research Center Online Service, provided by the NASA/Goddard Space Flight Center. Thanks to anonymous referee for the useful comments.
References
- (1) Ando, M., Ohta, K., Watanabe, C. et al. 2003, GCNC 1882, 1884
- (2) Berger, E., Kulkarni, S.R., Pooley, G., et al., 2003, Nature, in press (astro-ph/0308187)
- (3) Bhattacharya D., 2001, BASI, 29, 107
- (4) Frail, D. A., Kulkarni, S. R., Sari R. et al., 2001, ApJ, 562, L55
- (5) Bloom, J. S., Frail, D. A. & Sari, R. 2001, AJ, 121, 2879
- (6) Bloom, J. S., Fox, D. W. & Hunt, M. P. 2002, GCNC 1476
- (7) Burenin, R. A., Sunyaev, R. A., Pavlinsky, M. N. et al., 2003, Astr. Lett. 29, 9
- (8) Calzetti, D. 1997, AJ, 113, 162
- (9) Cardelli, J. A., Clayton, G. C. & Mathis, J. S. 1989, ApJ, 345, 245
- (10) Cowsik, R., Prabhu, T. P., Anupama, G. C. et al. 2001, BASI, 29, 157
- (11) Chornock, R. & Fillippenko, A. V. 2003, GCNC 1897
- (12) Covino, S., Ghisellini, G., Malesani, D. et al. 2003, GCNC 1909
- (13) Dai Z. G. & Wu X. F., 2003, ApJL, 591, L21
- (14) Fatkhullin, T., Komarova, V., Sokolov, V. Cherepashchuk, A., & Postnov. K. 2003, GCNC 1925
- (15) Fox, D. W., Chen, H. W. & Price, P. A. 2003, GCNC 1879
- (16) Fukugita, M., Shimasaku, K. & Ichikawa, T. 1995, PASP, 107, 945
- (17) Garnavich, P., Von Braun, K. & Stanek, K. 2003, GCNC 1885
- (18) Greiner, J., Guenther, E., Klose., S. & Schwarz., R. 2003a, GCNC 1886
- (19) Greiner, J., Ries, C, Barwig, H., Fynbo, J. & Klose, S. 2003b, GCNC 1894
- (20) Guarnieri, A., Cortese, L., Bartolini, C. et al. 2003, GCNC 1892
- (21) Guilloteau, S., Delannoy, J., Downes, D. et al. 1992, A&A, 262, 624
- (22) Harrison, F. A., Bloom, J. S., Frail, D. A. et al. 1999, ApJ, 523, L121
- (23) Harrison, F. A., Yost, S. A., Sari, R. et al. 2001, 559, 123
- (24) Henden A., 2003, GCNC 1916
- (25) Jakobsson, P., Hjorth, J., Fynbo, J. U. et al. 2003, Accepted in A&A
- (26) Jaunsen, A. O., Hjorth., J., Björnsson, G. et al. 2001, ApJ, 546, 127
- (27) Klose, S., Stecklum, B., Zeh, A. et al. 2003, GCNC 1923
- (28) Kulkarni, S. R., Fox, D. W., Berger, E. & Soderberg A. M. et al. 2003, GCNC 1911
- (29) Landolt, A.R., 1992, AJ, 104, 340
- (30) Maiorano, E., Masetti, N., Palazzi, E. et al. 2003, GCNC 1933
- (31) Masetti, N., Palazzi, E., Pian, E. et al. 2001, A&A, 374, 382
- (32) Mathis J.S., 1990, ARAA, 28, 37
- (33) Mészáros P., 2002, ARA&A, 40, 137
- (34) Nysewander, M. C., Moran, J., Reichart, D. & Schwartz, M. 2003, GCNC 1921
- (35) Pandey, S.B., Sagar, R., Mohan, V. et al. 2001, BASI, 29, 459
- (36) Pedersen, K., Fynbo, J., Hjorth, J. & Watson, D. et al. 2003, GCNC 1924
- (37) Price P. A. & Warren B. E., 2003, GCNC 1890
- (38) Price P. A., Fox D. W. & Chen H. W., 2003, GCNC 1880
- (39) Price, P. A., Fox D. W., Djorgovski, S. G. et al. 2003, GCNC 1889
- (40) Rhoads J.E., 1999, ApJ, 525, 737
- (41) Rhoads J. E. & Fruchter A., 2001, ApJ, 546, 117
- (42) Rumyantsev, V., Biryukov, V. & Pozanenko A. 2003a, GCNC 1908
- (43) Rumyantsev, V., Sergeeva, L. & Pozanenko A. 2003b, GCNC 1929
- (44) Sako M & Fox D. W., 2003, GCNC 1928
- (45) Sagar, R., 2002, BASI, 30, 237
- (46) Sagar, R., Mohan, V., Pandey, S.B. et al. 2000, BASI, 28, 499
- (47) Sagar, R., Pandey, S.B., Mohan, V., Bhattacharya, D. & Castro-Tirado, A.J. 2001a, BASI, 29, 1,
- (48) Sagar, R., Stalin, C. S., Bhattacharya, D. et al. 2001b, BASI, 29, 91
- (49) Sari, R., Piran, T., Halpern, J. P. 1999, ApJ, 519, L17
- (50) Schlegel, D.J., Finkbeiner, D.P., Davis, M. 1998, ApJ, 500, 525
- (51) Schwarz, P. R. 1980, PASP, 535, 534
- (52) Semkov, E. 2003, GCNC 1935
- (53) Stanek, K. Z., Garnavich, P. M., Kaluzny, J., Pych, W. & Thompson, I. 1999, ApJ, 522, L39
- (54) Stanek, K. Z., Krzysztof, Z., Garnavich, P. M. et al. 2001, ApJ, 563, 592
- (55) Suzuki, M., Shirasaki, Y., Graziani, C. et al., 2003, GCNC 1888
- (56) Von Braun, K., Garnavich, P. & Stanek, K. 2003, GCNC 1881