Detection of Saturnian X-ray emission with XMM-Newton
The giant planet Saturn was observed by XMM-Newton in September 2002. We present and analyse these XMM-Newton observations and compare our findings to the Chandra observations of Saturn. Contamination of the XMM-Newton data by optical light is found to be severe in the medium and thin filters, but with the thick filter all optical light is sufficiently blocked and the signal observed in the this filter is interpreted as genuine X-ray emission, which is found to qualitatively and quantitatively resemble Saturn’s Chandra spectrum very well.
Key Words.:
planets and satellites: general - planets and satellites individual: Saturn - X-rays: general1 Introduction
Most of the larger solar system objects are now known to emit X-rays via some variety of different X-ray emission mechanisms. The most prominent example is the gas giant Jupiter, whose X-ray emission is dominated by auroral emission, produced by charged particles entering the planet’s magnetosphere (e.g., Metzger et al., 1983). A recent Chandra observation of the gas giant Saturn (Ness et al., 2004) resulted in a definitive detection of X-ray emission also from this planet, thus confirming a tentative ROSAT detection reported earlier by Ness & Schmitt (2000), however, at a level much lower than observed from Jupiter. Further, unlike Jupiter, Saturn’s X-ray emission is not concentrated in the polar regions, and in fact, the detected level of Saturnian X-ray emission is consistent with the observed level of Jupiter’s equatorial emission (Ness et al., 2004; Waite et al., 1996). The emission mechanism consistent with spectral and spatial properties of the observed X-ray emission was found to be elastic scattering and fluorescent scattering of solar X-rays, however, for this to be the case, the X-ray albedo of Saturn has to be unusually high. Ness et al. (2004) estimated the X-ray albedo required to explain the measured X-ray flux by scattering processes and found a value of , which is about a factor 50 higher than for the moon (Schmitt et al., 1991). Since models of combinations of scattering processes for Jupiter’s equatorial emission (Maurellis et al., 2000) underestimate the observed flux level (Waite et al., 1997) by a factor of 10, the scatter process scenario has to explain a high X-ray albedo in both cases, Jupiter’s equatorial emission and Saturn’s total emission.
Saturn was also observed by XMM-Newton in September 2002. We present and analyse these XMM-Newton observations and compare our findings to the Chandra observations of Saturn. We concentrate on the detection and spectral properties of the X-ray photons, while the light curve provides only little information due to its short duration.
2 Observations and Data Analysis
2.1 Observations
Saturn was observed with XMM-Newton on September 10, 2002 for a total of 60 ksec. The observations were split in three separate parts of almost equal length, with different filter settings used for the PN and MOS detectors. The MOS detectors were operated with medium filter + full frame, medium filter + large window, and thin filter + large window. At the position of Saturn no X-ray photons can be extracted from the MOS detectors, because pixels with high optical load are not read out. The RGS is not affected by optical light contamination, but the count rate is too low to obtain useful spectra. We therefore use only the EPIC-PN detector for our analysis, and the observation details are summarized in Table 1. We inspected all three PN-observations, but the data taken with the thin filter are close to useless and the data taken with the medium filter are severely contaminated by optical light. However, in the data taken with the thick filter no obvious signs of optical contamination are apparent, consistent with our expectations about the optical blocking power of the thick filter.
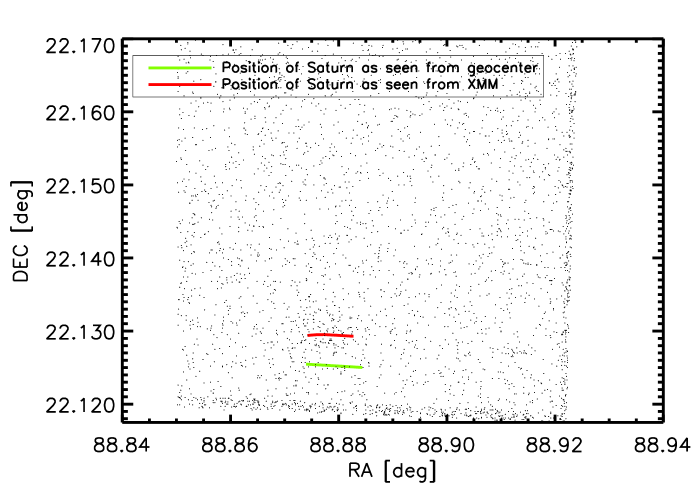
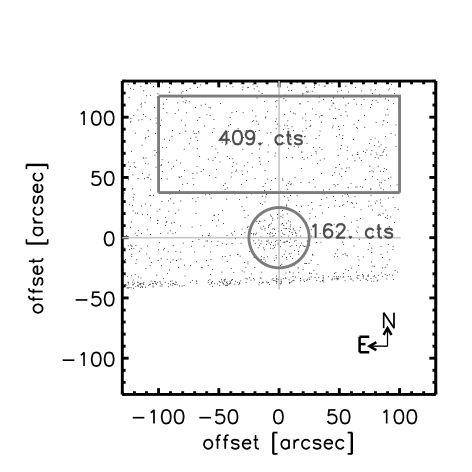
Due to the small apparent motion of Saturn (″, compare to the instrument half-power diameter of 15″) during the 20 ksec observation interval and the high sensitivity of the PN-detector we could directly identify Saturn on chip #4 without any need of a transformation following the apparent planetary motion (see Fig. 1, upper panel). After having found emission at Saturn’s position we carried out a transformation procedure (described in detail by Ness et al., 2004), which transforms all recorded events into a Saturnocentric coordinate system, and constructed an image in this new coordinate system. We then extracted all photons within an extraction radius of 25″ around the central position of the transformed coordinate system, where an enhancement of photons can be immediately recognized (cf. Fig. 1). In a circular detect cell we extract 162 photons while from the background (extracted from an adjacent 80″ 200″ box) we expect only 50.2 photons. With a total of 112 13 counts we have therefore obtained a highly significant detection.
| ObsID 0089370501 | |
|---|---|
| Exp. time | 24024 ksec |
| Start Time | 2002-10-01 10:35 |
| Stop Time | 2002-10-01 17:15 |
| PN filter | THICK FILTER |
| on-time (PN) | 21047 ksec |
| ObsID 0089370601 | |
| Exp. time | 24023 ksec |
| Start Time | 2002-10-01 17:35 |
| Stop Time | 2002-10-02 00:15 |
| PN filter | MEDIUM FILTER |
| on-time (PN) | 20966 ksec |
| ObsID 0089370701 | |
| Exp. time | 24023 ksec |
| Start Time | 2002-10-02 00:37 |
| Stop Time | 2002-10-02 07:17 |
| PN filter | THIN FILTER1 |
| on-time (PN) | 20962 ksec |
| Angular diam. | 18.1″ |
| distance (Earth) | 9.2 AU |
| distance (Sun) | 9.0 AU |
| inclination | -26.4∘ |
3 Results
We analyzed the XMM-Newton EPIC-PN data of Saturn in the same fashion as the
Chandra data as described by Ness et al. (2004). Since the recorded count
number is exactly the same (!), the detection significance in both data sets
is very similar; note, that the background values differ somewhat. Since the
angular resolution of the XMM-Newton data is lower, we are not able to locate
the X-ray emission on Saturn’s apparent disk (diameter 18.1″) from our
XMM-Newton observations.
We extracted the light curve with different time bins but found no significant
variability. The net count rate is ( cps. Only
half a rotation is covered with the short observation time and no phase
variability can be tested.
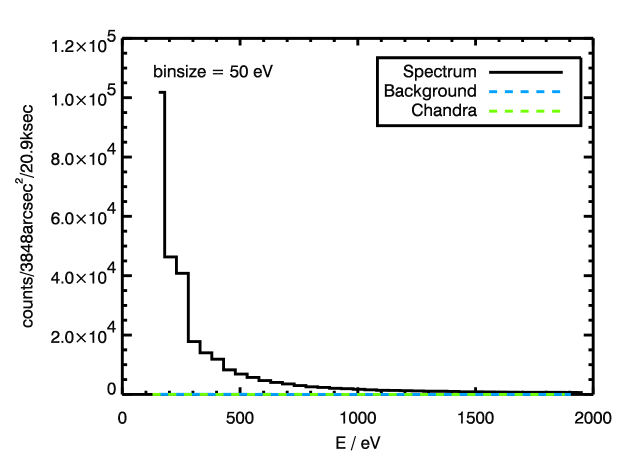
Is the signal recorded in the thick filter due to X-rays or also due to
optical contamination? In order to address this issue we analyzed the
EPIC-PN medium filter data in precisely the same fashion as the thick filter
data and extracted a background-subtracted spectrum of the photons attributed to
Saturn (cf. Fig. 2). The strong signal increase towards lower energies
is the indicator of the severe contamination due to optical light. In contrast,
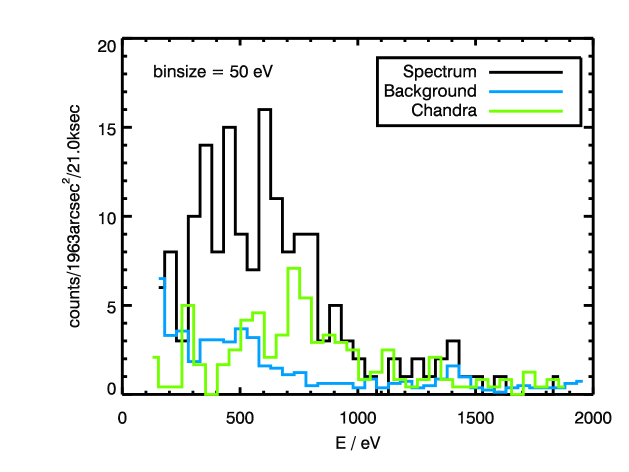
carrying out the same procedure with the thick filter data results in a
spectrum looking totally different (cf. Fig. 3). The thick filter
spectrum does not exhibit any increase towards lower energies as expected from a
genuine X-ray spectrum, since the effective areas decrease towards lower
energies. Further, the thick filter spectrum appears very similar to
the recorded Chandra spectrum, which is overplotted in a light color
after scaling to our exposure time and extraction area. The signal is lower
due to the lower
effective areas of Chandra mirrors, with the Chandra spectrum
appearing somewhat shifted towards higher energies. This might be due to some
optical loading in the Chandra observation, an effect that could not
fully be excluded by Ness et al. (2004). A rather weak emission feature appears at
1.3 keV, but is not significant; interestingly it is also seen in the
Chandra spectrum.
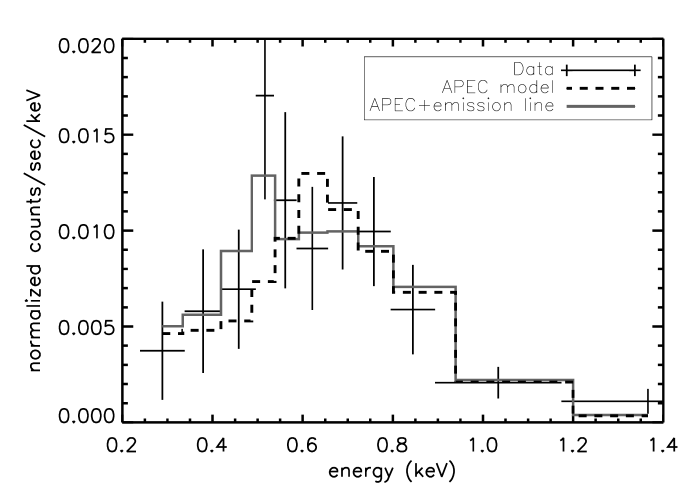
Using XSPEC we carried out spectral modeling similar to Ness et al. (2004), who found acceptable spectral fits with a (physically unmotivated) black body model and a combined MEKAL model plus a fluorescent line of oxygen. MEKAL contains continuum and line emissivities from collisionally ionized plasma in thermal equilibrium. This model is supposed to represent the spectrum of the solar corona and the model parameters are the equilibrium temperature and elemental abundances. Given the low signal-to-noise of our XMM-Newton data, we can only check to what extent the XMM-Newton and Chandra spectra are consistent with each other. We rebinned the XMM-Newton spectrum to contain at least 15 counts per bin, necessary to remain outside the Poissonian regime, otherwise a non-standard statistical treatment is necessary (e.g., Cash, 1979; Ness & Wichmann, 2002). In addition we applied the Cash statistics provided by XSPEC with the original spectrum and found consistent results. In order to present a concise goodness-of-fit parameter we here present our results from fits. Our best-fit black body model yields a temperature of kT keV ( with 9 dof), consistent with the temperature found from the Chandra observation (0.18 keV). Instead of a MEKAL model we chose an APEC model to describe an incident solar spectrum. Assuming solar abundances we find a temperature of kT keV ( with 9 dof), a little cooler than the temperature found from the combined MEKAL/fluorescent line model from the Chandra spectrum (kT keV). A slightly better fit is obtained by introducing an oxygen fluorescent line at 527 eV (modeled as a narrow emission line, only instrumentally broadened). With this combined model we obtain an APEC temperature of kT keV, consistent with the Chandra results ( with 8 dof). The fit results are summarized in Table 2 and in the last column we list the model fluxes, integrated in the wavelength interval 0.1–2 keV. For an overview of the available X-ray spectra of Saturn we plot the rebinned spectrum with the APEC model (dashed) and the best-fit model of the combined APEC/fluorescent line (solid grey) in the bottom panel of Fig. 3.
| Model | kT (keV)a | / dofb | fluxe |
|---|---|---|---|
| EPIC/PN | (erg/cm2/s) | ||
| black body | 1.09/9 | 1.66 | |
| APECc | 0.79/9 | 1.62 | |
| APECc+ | |||
| narrow lined | 0.41/8 | 1.58 | |
| Chandra | |||
| black body | 0.18 | 0.7/10 | 0.44 |
| MEKAL+ | 0.55 | ||
| narrow line | – | 0.9/9 | 0.13 |
| ROSAT | – | – | 1.9 |
a90% errors bdegrees of freedom
csolar abundances dat 527 eV, delta profile
e0.1–2 keV
f1.36 (APEC) + 0.22 (fluorescent line)
While none of the considered spectral models may be physically correct, they
allow a reasonable accurate estimate of the X-ray flux recorded by XMM-Newton.
An inspection of Table 2 shows, that an apparent X-ray flux between
erg cm-2 s-1 was recorded by XMM-Newton.
This compares well with the ROSAT flux of
erg cm-2 s-1 (in the soft ROSAT band
0.1–0.55 keV) reported by Ness & Schmitt (2000), but is above the level measured by
Chandra of erg cm-2 s-1. Thus an
interpretation of the signal recorded by XMM-Newton in the thick filter as
genuine X-ray emission yields flux values consistent with earlier observations
of X-ray emission from Saturn as well as an X-ray spectrum consistent with that
recorded by Chandra. We therefore conclude that indeed true X-ray emission
from Saturn has been recorded by XMM-Newton.
4 Discussion and Conclusions
We analyzed XMM-Newton observations of Saturn. Because of Saturn’s visual magnitude of at the time of our observations, the data taken with the thin and the medium filters are severely contaminated by optical light. However, the data taken with the thick filter are exclusively X-ray photons originating from Saturn. Thus, X-ray emission from Saturn has been established to be significantly weaker than for Jupiter; the reported flux levels range from erg cm-2 s-1 from Chandra to erg cm-2 s-1 in a marginal ROSAT detection (Ness & Schmitt, 2000). At least between the Chandra and XMM-Newton observations substantial variablity seems to have taken place, a fact hardly surprising for almost any X-ray source. The spectral models found to be consistent with the XMM-Newton data are also consistent (to within the errors) with the results from the Chandra observation. Any possibly remaining problems with optical loading do not seem to significantly affect the results. Further insights into Saturn’s X-ray production process require substantially deeper pointings than presently available.
Acknowledgements.
This work is based on observations obtained with XMM-Newton, an ESA science mission with instruments and contributions directly funded by ESA Member States and the USA (NASA). We also thank Pedro Rodriguez from the XMM helpdesk for his assistance.J.-U.N. and J.R. acknowledge support from DLR under 50OR0105.
References
- Cash (1979) Cash, W. 1979, ApJ, 228, 939
- Maurellis et al. (2000) Maurellis, A. N., Cravens, T. E., Gladstone, G. R., Waite, J. H., & Acton, L. W. 2000, Geochim. Res. Lett., 27, 1339
- Metzger et al. (1983) Metzger, A. E., Gilman, D. A., Luthey, J. L., et al. 1983, J. Geophys. Res., 88, 7731
- Ness & Schmitt (2000) Ness, J.-U. & Schmitt, J. H. M. M. 2000, A&A, 355, 394
- Ness et al. (2004) Ness, J.-U., Schmitt, J. H. M. M., Wolk, S., Dennerl, K., & Burwitz, V. 2004, A&A, accepted
- Ness & Wichmann (2002) Ness, J.-U. & Wichmann, R. 2002, Astronomische Nachrichten, 323, 129
- Schmitt et al. (1991) Schmitt, J. H. M. M., Snowden, S. L., Aschenbach, B., et al. 1991, Nature, 349, 583
- Waite et al. (1997) Waite, J. H., Gladstone, G. R., Lewis, W. S., et al. 1997, Science, 276, 104
- Waite et al. (1996) Waite, J. H., Lewis, W. S., Gladstone, G. R., Fabian, A. C., & Brandt, W. N. 1996, in Roentgenstrahlung from the Universe, 641–644