Doppler broadening of the iron line and correlation in black hole binaries
Abstract
RXTE/PCA observations of several black hole X-ray binaries in the low spectral state revealed a tight correlation between spectral parameters and characteristic frequencies of variability of X-ray flux. In particular, the amplitude of reflection increases and the slope of Comptonized radiation steepens as the noise frequencies increase. The data also suggest that there is a correlated increase of the width of the Fe fluorescent line, probably related to the Doppler broadening of the reflection features. Moreover, the width of the line seems to follow law. If confirmed with higher energy resolution observations, this result will have significant impact on the models of the accretion flow and on our understanding of the nature of characteristic frequencies of variability in X-ray binaries. In particular, it will lend support to the truncated disk picture, confirming that the spectral variations are indeed related to changes of the position of the inner disk boundary and that characteristic variability frequencies are proportional to the Keplerian frequency at the inner boundary of the accretion disk.
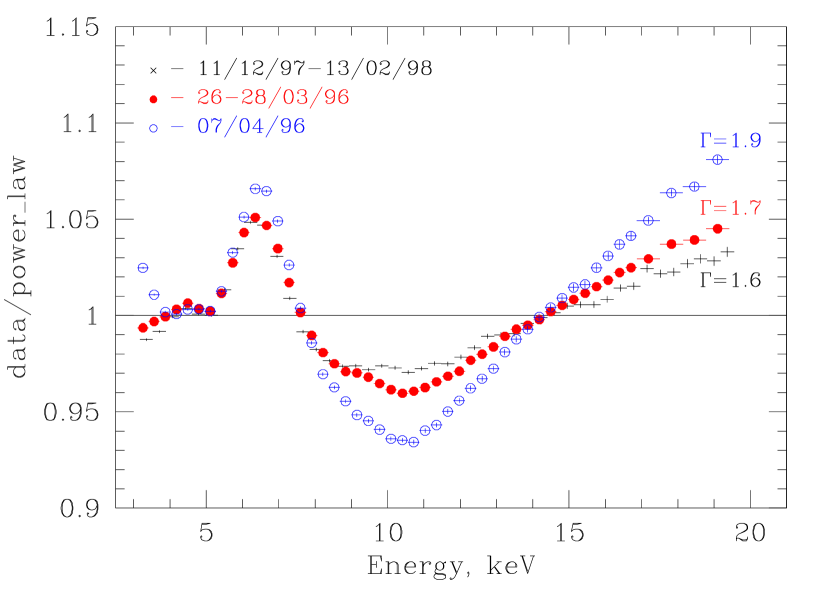
Comptonization of soft seed photons in a hot, optically thin electron cloud near the compact object is thought to be the main formation mechanism for hard X–ray emission in the low spectral state of accreting black holes (Sunyaev & Truemper, 1979; Sunyaev & Titarchuk, 1980). Reflection of this Comptonized radiation from neutral or partially ionized matter of the optically thick accretion disk leads to appearance of characteristic features in the spectra of X–ray binaries (Fig.1) – the fluorescent Kα line of iron, iron K-edge and a broad Compton reflection hump at higher energies (Basko et al., 1974; George & Fabian, 1991). Their exact shape depends on the ionization state of the matter in the disk (Ross et al., 1999) and might be modified by strong gravity effects and intrinsic motions in the reflector (e.g. Fabian, 1991). Their amplitude depends on the ionization state and on the solid angle of the reflector as seen from the source of the primary radiation. Based on the analysis of a large sample of Seyfert AGNs and several X–ray binaries Zdziarski et al. (1999), (Zdziarski et al., 2003) found a correlation between the amplitude of reflection and the slope of the underlying power law.
Power density spectra of black hole binaries in the low state, plotted in the units of , usually appear as a superposition of two or more rather broad humps containing most of the power of aperiodic variations below several tens Hz. These humps define several characteristic frequencies of variability. Despite of the fact that the characteristic noise frequencies vary from source to source and from epoch to epoch, they appear to be correlated with each other (Wijnands & van der Klis, 1999; Gilfanov et al., 2000). Although a number of theoretical models was proposed to explain the power spectra of X–ray binaries (e.g. Alpar et al., 1992; Stella Vietri & Morsink, 1999) the nature of the characteristic noise frequencies is still unclear.
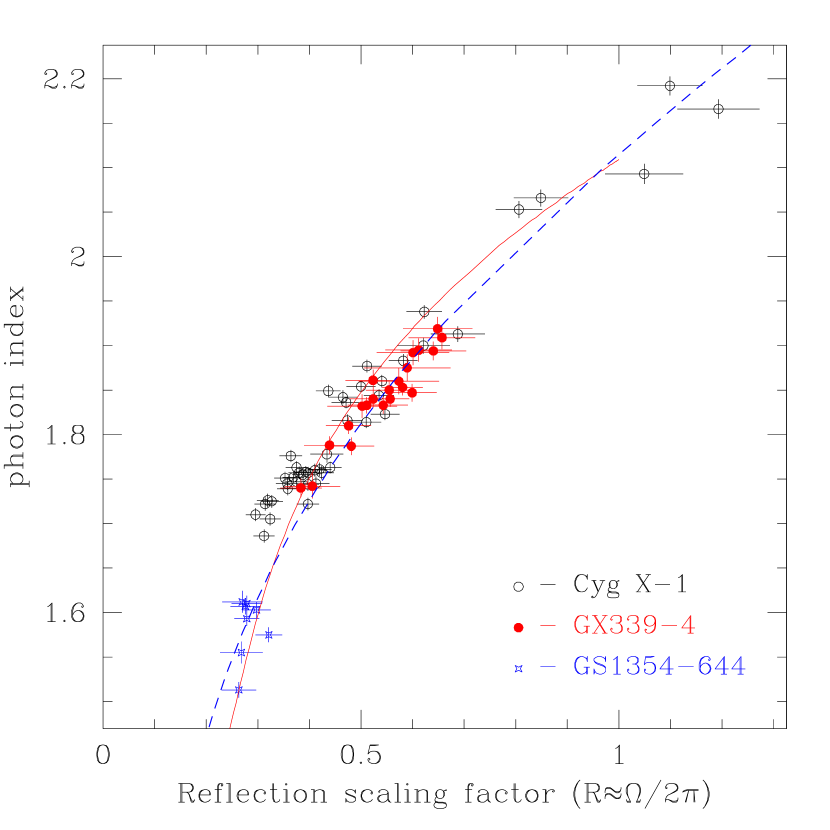
Gilfanov et al. (1999) and Revnivtsev et al. (2001) showed that a tight correlation exists between the characteristic noise frequencies and the spectral parameters in Cyg X-1 and GX339-4. Based on a large number of RXTE/PCA observations, they found that the amplitude of reflection increases and the spectrum of primary radiation steepens as the noise frequencies increase. Interpreting these correlations, Gilfanov et al. (1999) suggested that increase of the noise frequency might be caused by the shift of the inner boundary of the optically thick accretion disk towards the compact object. The related increase of the solid angle, subtended by the disk, and of the influx of the soft photons to the Comptonization region lead to an increase of the amount of reflection and steepening of the Comptonized spectrum.
Below we summarize the results on correlation between the spectral parameters and characteristic frequencies of variability and discuss the behavior of the Doppler broadening of the reflected emission.
1 Correlation between spectral and timing parameters
The results presented in Fig.2 are based on the publicly available data of a number of RXTE/PCA (Brandt et al., 1996) observations of Cyg X–1, GX339-4 and GS1354–644 performed from 1996–1999. The spectral model and procedures for spectral approximation and for fitting the power density spectra are described in (Gilfanov et al., 1999, 2000; Revnivtsev et al., 2001). We emphasize, that the model used for spectral approximation of the data is obviously oversimplified and does not include a number of physically important effects. Some of the parameters, for example, the binary system inclination, were fixed at fiducial values. Consequently, the best fit values do not necessarily represent the exact values of the physically interesting parameters. Particularly subject to various uncertainties is the reflection scaling factor , (Zdziarski et al., 2003). This might explain the values of exceeding unity, obtained for some of the spectra. However, as was shown in (Gilfanov et al., 1999) and (Revnivtsev et al., 2001), the model does correctly rank the spectra according to the strength of the reflected component and the slope of the underlying power law.
2 Toy models
The photon index of the Comptonized radiation is controlled by the Compton amplification factor which equals to the ratio of the energy deposited into the electrons to the flux of soft seed photons to the Comptonization region. The concrete shape of the relation depends on the ratio of the temperatures of the seed photons and the electrons, the Thomson optical depth and the geometry. In the simplest although not unique scenario the correlation between the amplitude of the reflected component and the slope of the Comptonized spectrum (Fig.2) could be understood assuming that there is a positive correlation between the solid angle subtended by the reflecting media, , and the flux of the soft photons to the Comptonization region (Zdziarski et al., 1999). Existence of such correlation is a strong argument in favor of the reflecting media being the primary source of the soft seed photons to the Comptonization region. In the absence of strong beaming effects a correlation between and the seed photons flux should be expected since an increase of the solid angle of the disk seen by the hot electrons () should generally lead to the increase of the fraction of the disk emission reaching the Comptonization region.
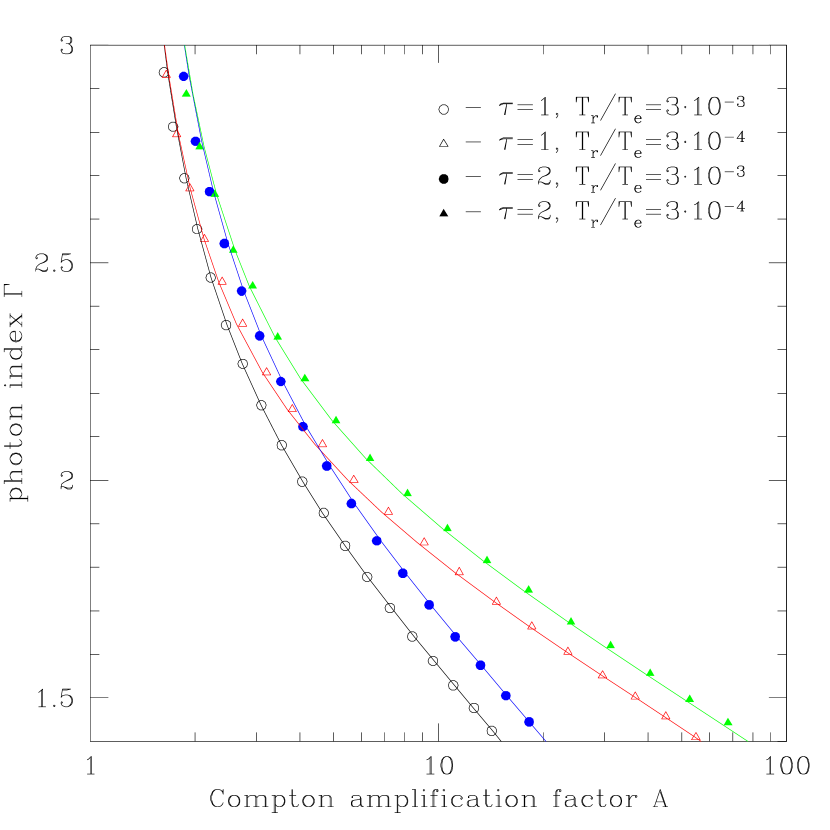
In order to demonstrate that such geometrical effects can explain the observed dependence we consider two idealized models having different mechanism of change of the . In the first, disk-spheroid model, an optically thin uniform hot sphere with radius is surrounded with an optically thick cold disk with an inner radius (e.g. Poutanen et al., 1997), the depending on the ratio . Propagation of the disk inner edge towards/inwards the hot sphere (decrease of ) leads to an increase of the reflection scaling factor, a decrease of the the Compton amplification factor and a steepening of the Comptonized spectrum. In such context the model was first studied by Zdziarski et al. (1999) and we used their results to calculate the relation between the and . In the second, plasma ejection model, proposed by Beloborodov (1999), value of the is defined by bulk motion of the emitting plasma with mildly relativistic velocity towards or away from the disk, which itself remains unchanged. Both models predict relation between reflection and which can be translated to given a dependence of the photon index of Comptonized spectrum on the amplification factor. The latter was approximated by:
This formula is based on a representation of the Comptonized spectrum by a power law in the energy range and agrees with the results of the Monte-Carlo calculations with reasonable accuracy for optical depth and (Fig.3).
The expected relations are shown in Fig.2. With a proper tuning of the parameters both models can reproduce the observed shape of the dependence and in this respect are virtually indistinguishable. The observed range of the reflection and the slope can be explained assuming variation of the disk radius in from to in the disk-spheroid model or variation of the bulk motion velocity from away from the disk to in the plasma ejection model. Finally, it should be emphasized that these idealized models do not include a number of important effects which might affect the particular shape of the dependence.
3 Doppler broadening of iron line
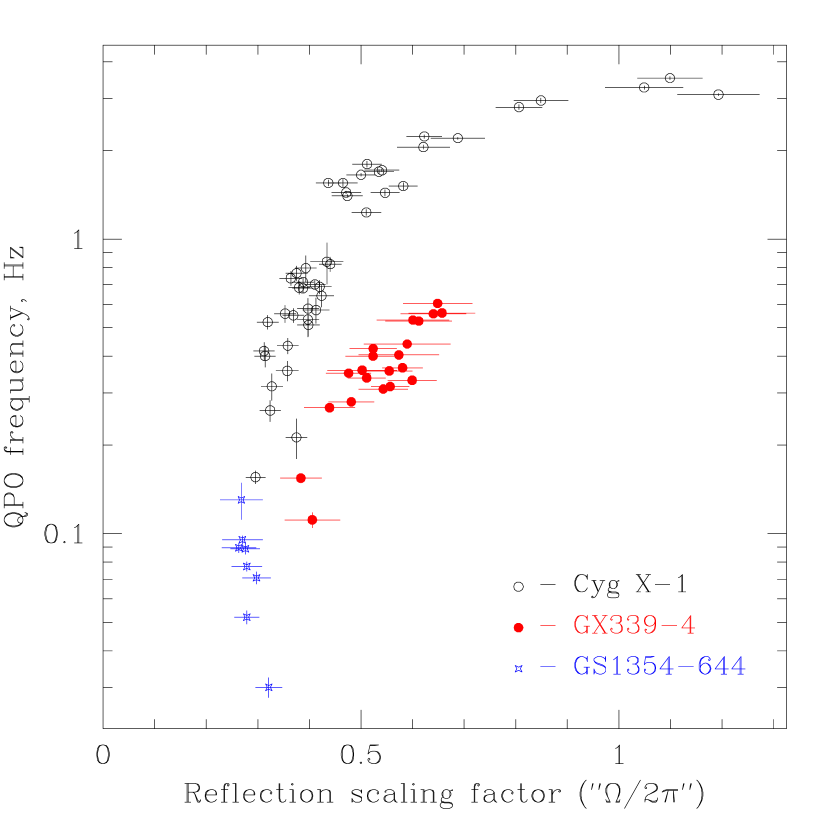
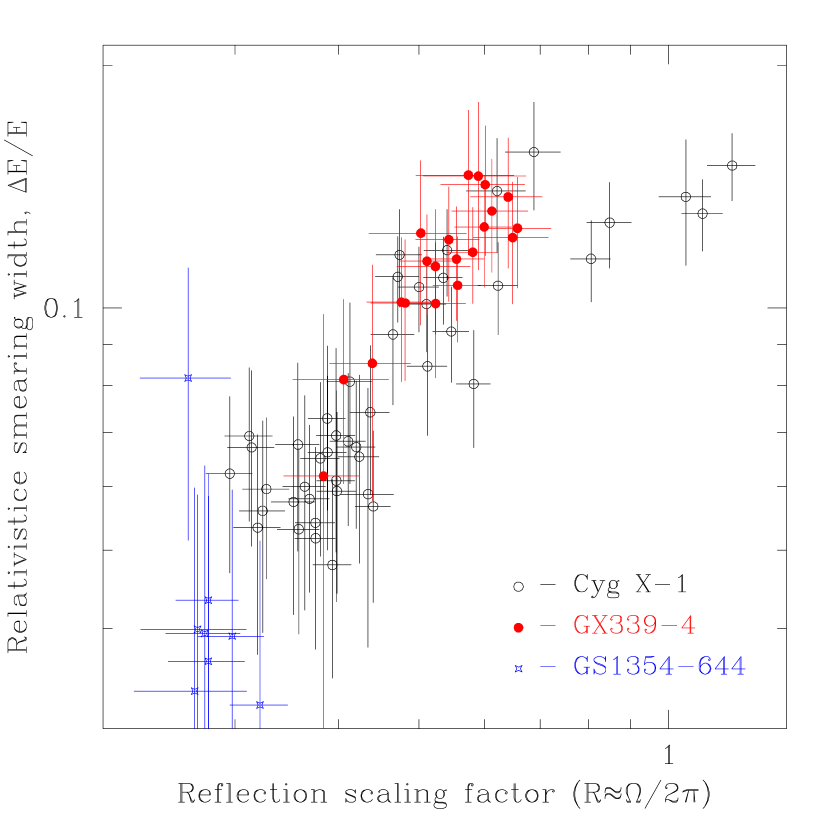
The spectrum of emission, reflected from a Keplerian accretion disk is expected to be modified by the Doppler and special and general relativity effects (Fabian, 1991). If increase of the reflection is caused by the decrease of the inner radius of the accretion disk, as predicted in the truncated disk picture, a correlation should be expected between the amplitude of reflected emission and its Doppler broadening, in particular the Doppler width of the fluorescent iron line. Such a correlation is a generic prediction of the truncated disk models and might be used to discriminate between different assumptions about geometry of the accretion flow. The energy resolution of RXTE/PCA is not adequate to study relativistic smearing of the reflection features with sufficient degree of confidence. However, the data shown in Fig.4 might present an evidence in favor of a correlated behavior of the reflection and Doppler broadening of the fluorescent line of iron.
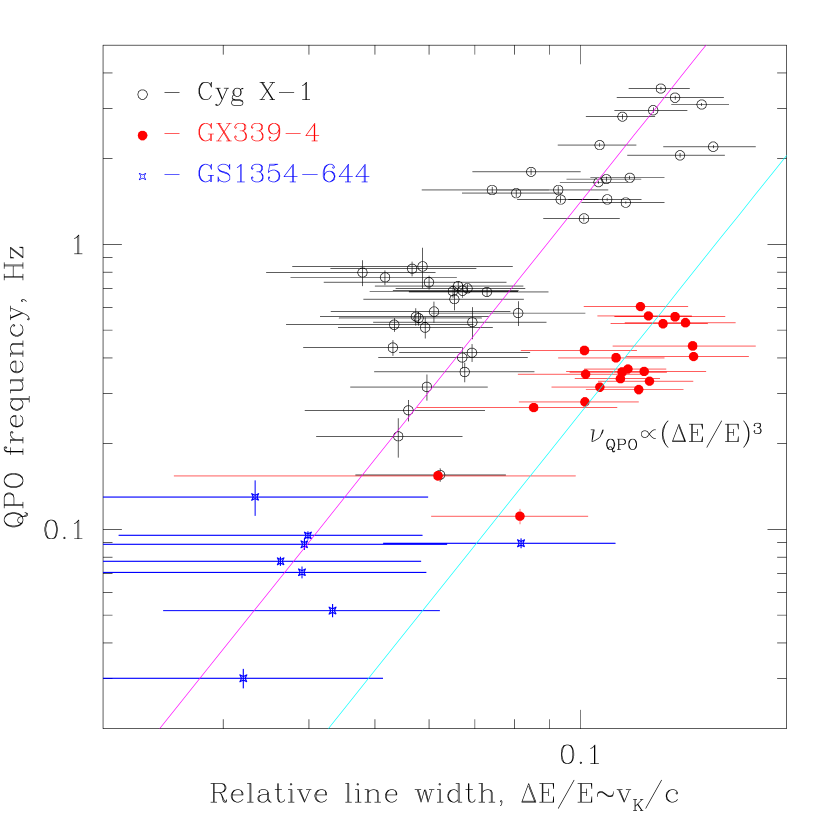
Speculating further, if the characteristic frequencies of variability are proportional to the Keplerian frequency at the inner boundary of the disk, they should scale as
As the reflected emission is likely to originate primarily from the innermost parts of the accretion disk, closest to the source of Comptonized radiation, the effect of the Doppler broadening should be proportional to the Keplerian linear velocity at the inner edge of the disk:
Therefore, one might expect, that the characteristic frequencies of variability and the Doppler broadening of the fluorescent line should be related via:
where is the black hole mass and is inclination of the binary system. The PCA data indicate, that such dependence might indeed be the case (Fig.4). If confirmed with higher energy resolution observations, this result will have a significant impact on our understanding of the geometry of the accretion flow in vicinity of the compact object and of the nature of the characteristic frequencies of variability. In particular, it will lend support to the truncated disk picture, confirming that the spectral variations are indeed related to changes of the position of the inner disk boundary and that characteristic variability frequencies are proportional to the Keplerian frequency at the inner boundary of the accretion disk.
References
- Alpar et al. (1992) Alpar M. A., Hasinger G., Shaham J., Yancopoulos S., 1992, A&A 257, 627
- Basko et al. (1974) Basko M., Sunyaev R., Titarchuk L., 1974, A&A 31, 249
- Beloborodov (1999) Beloborodov, A. M. 1999, ApJ, 510, L123
- Brandt et al. (1996) Brandt, H., Rotschild, R. & Swank, J. 1996, Memorie della Societa Astronomica Italiana, 67, 593
- Fabian (1991) Fabian A.C., 1989, MNRAS 238, 729
- George & Fabian (1991) George I.M., Fabian A.C., 1991, MNRAS 249, 352
- Gilfanov et al. (1999) Gilfanov M., Churazov E., Revnivtsev M., 1999 A&A, 352, 182
- Gilfanov et al. (2000) Gilfanov M., Churazov E., Revnivtsev M., 2000, In: Proceedings of 5th Sino-German Workshop on Astrophysics, Urumqi, China, 1999. SGSC Conference Series, Vol.1, p.114, Eds: G.Zhao, J.J.Wang, H.M.Qiu & G.Boerner.
- Poutanen et al. (1997) Poutanen, J. , Krolik, J. H. & Ryde, F. 1997, MNRAS, 292, L21
- Revnivtsev et al. (2001) Revnivtsev M., Gilfanov M., Churazov E., 2001, A&A, 380, 520
- Ross et al. (1999) Ross, R. R., Fabian, A. C. & Young, A. J. 1999, MNRAS, 306, 461
- Stella Vietri & Morsink (1999) Stella, L. , Vietri, M. & Morsink, S. M. 1999, ApJ, 524, L63
- Sunyaev & Truemper (1979) Sunyaev R., Truemper J. 1979, Nature 279, 506
- Sunyaev & Titarchuk (1980) Sunyaev R., Titarchuk L., 1980, A&A 86, 121
- Wijnands & van der Klis (1999) Wijnands R., van der Klis M., 1999, ApJ 514, 939
- Zdziarski et al. (1999) Zdziarski A.A., Lubinski P., Smith D., 1999, MNRAS 303, L11
- Zdziarski et al. (2003) Zdziarski A.A., Lubinski P., Gilfanov M. & Revnivtsev M., 2003, MNRAS 342, 355