Excess mid-IR Emission in Cataclysmic Variables
Abstract
We present a search for excess mid-IR emission due to circumbinary material in the orbital plane of cataclysmic variables (CVs). Our motivation stems from the fact that the strong braking exerted by a circumbinary (CB) disc on the binary system could explain several puzzles in our current understanding of CV evolution. Since theoretical estimates predict that the emission from a CB disc can dominate the spectral energy distribution (SED) of the system at 5 m, we obtained simultaneous visible to mid-IR SEDs for eight systems. We report detections of SS Cyg at 11.7 m and AE Aqr at 17.6 m, both in excess of the contribution from the secondary star. In AE Aqr, the IR likely originates from synchrotron-emitting clouds propelled by the white dwarf. In SS Cyg, we argue that the observed mid-IR variability is difficult to reconcile with simple models of CB discs and we consider free-free emission from a wind. In the other systems, our mid-IR upper limits place strong constraints on the maximum temperature of a putative CB disc. The results show that if any sizeable CB disc are present in these systems, they must be self-shadowed or perhaps dust-free, with the peak thermal emission shifted to far-IR wavelengths.
keywords:
binaries: close – stars: evolution – stars: cataclysmic variables – stars: individual (QR And, RX And, AE Aqr, HU Aqr, SS Cyg, IP Peg, WZ Sge, RW Tri)1 INTRODUCTION
Studies of cataclysmic variables (CVs) have largely focused on wavelengths 1 m where accretion processes dominate the system emission. Surprisingly little is known about the IR properties of CVs (Dhillon, 1998). Near-IR observations show contributions above that of the K/M donor star spectrum which peaks around m. In most cases colors are bluer than expected because of residual light from the accretion disc. In others the colors are redder, which is interpreted as the emission from the evolved secondary components or from the cool outer regions of unusually large accretion discs (Dhillon et al., 2000; Hoard et al., 2002). In well-known systems, the spectral energy distribution (SED) can be decomposed into its different components (e.g., Ciardi et al., 1998). Harrison et al. (2000) then argued that U Gem and SS Cyg have excess near-IR emission above that expected from the secondary star.
A possible source of additional IR emission is cold material located outside the binary system. Some CVs have P Cyg lines formed in an accretion disc wind ( km s-1, M⊙ yr-1); rapidly spinning white dwarf magnetic fields can propel large fractions of the gas out of the system (e.g., AE Aqr); and runaway nuclear burning in novae leads to the ejection of the white dwarf envelope ( M⊙). A small fraction of this ejected material may remain bound to the binary and form a circumbinary disc (CB disc). Another possible source of material is residual gas from the common-envelope evolution phase which precedes the onset of mass transfer. The inner edge of a CB disc is tidally coupled to the binary system, leading to the extraction of angular momentum from the orbital motion (Webbink, 1976). The CB disc therefore expands as angular momentum is redistributed by viscous interactions (Pringle, 1991) resulting in a very efficient orbital braking mechanism if the CB disc is sufficiently dense (Spruit & Taam, 2001; Taam & Spruit, 2001).
Recently, it has been pointed out by Andronov, Pinsonneault & Sills (2003) that the angular momentum loss associated with magnetic braking based on the Skumanich (1972) law severely underestimates the rotational velocities of single stars in open clusters, implying that the magnetic braking that has been the basis for CV evolution (e.g., Verbunt & Zwaan, 1981) is significantly reduced (c.f., Ivanova & Taam, 2003). Hence, additional angular momentum losses are required to understand the diversity and level of the mass transfer rates in CVs. CB discs can provide this angular momentum loss (in addition to gravitational wave radiation and magnetic braking) that may help to solve some of the puzzles of CV evolution, such as the lack of a peak at the minimum in the orbital period distribution, the order of magnitude spread in mass transfer rates at a given or the very high implied by steady nuclear burning on the white dwarf in the supersoft sources (see, for example, Taam, Sandquist & Dubus 2003). As mass in the CB disc builds up, a feedback effect increases above the values expected from standard evolution eventually leading to the dissolution of the binary (Taam & Spruit, 2001; Dubus, Taam & Spruit, 2002; Taam, Sandquist & Dubus, 2003). At this point, CB discs will typically be optically thick with sizes 1-10 AU and effective temperatures of a few 1000 K in their innermost regions. These properties make them very similar to protostellar discs.
Observations of stationnary, faint lines with narrow velocity widths in several objects suggest the presence of circumbinary material (Z Cam, Robinson 1973; IP Peg, Piché & Szkody 1989; AM CVn, Solheim & Sion 1994; SS Cyg, Steeghs et al. 1996; QR And, Deufel et al. 1999; BY Cam, Mouchet et al. 2003). The continuum emission from a CB disc (possibly responsible for the narrow lines) could easily have escaped detection up until now. Spectral energy distributions (SEDs) calculated by Dubus, Taam & Spruit (2002) and Taam, Sandquist & Dubus (2003) show that massive CB discs start dominating over the binary emission at about 5m in mid-IR. The mid- and far-IR remain unexplored, with IRAS providing loose upper limits or detections subject to source confusion (see below).
Motivated by the prospect of finding excess emission from a CB disc in the poorly known mid-IR regime, we observed a total of eight systems (Tab. 1). A SED spanning the visible and mid-IR is crucial to identify the upturn caused by the CB disc, and we observed these systems nearly simultaneously with the Palomar 60-inch (visible) and Keck I telescopes (near- and mid-IR). Our prime objective was SS Cyg because of its brightness, parallax distance and hint of excess IR emission (Harrison et al., 2000). The SED of CVs involves various, poorly constrained components (accretion emission, white dwarf, secondary etc). Their contribution is a priori expected to decrease at mid-IR wavelengths, making any excess more straightforward to identify than at visible or near-IR wavelengths. However, we caution that since very little is known about the mid-IR emission of CVs, any excess will not necessarily imply circumbinary material.
The other targets are well-studied systems representing a wide range of CV sub-classes as we have little a priori knowledge of which types of CVs are more likely to have more circumbinary material. The list includes binaries with below the period gap, driven by gravitational wave radiation, and some with hrs presumably driven by magnetic wind braking. We included the supersoft QR And despite its faintness and large distance to test the possibility that a large CB disc drives the high mass transfer rate.
Some of the CVs had previously published mid-IR measurements. The earliest mid-IR measurements of CVs are those of Berriman, Szkody & Capps (1985) who reported ground-based 2 upper limits at 10 m of 27 mJy for SS Cyg and 36 mJy for AE Aqr. The more recent ISO measurements of AE Aqr by Abada-Simon et al. (2002) are discussed in §4.2. All other published measurements are based on IRAS. Jameson et al. (1987) report detecting SS Cyg as it underwent a dwarf novae outburst. The fluxes at 12 and 25 m are 55 and 30 mJy (the quiescent levels are 10 and 8 mJy). But a later study using the same data (Harrison & Gehrz, 1992) quotes a 3 upper limit of 30 mJy at 12 m and a 15040 mJy detection at 25 m for SS Cyg (110 mJy at 60 m). Harrison & Gehrz (1992) also report 3 upper limits for RX And of 30 mJy at 12 and 25 m. Source confusion, particularly in the galactic plane, is a major issue with IRAS, which could explain some of the discrepancies111For instance, the referee points out a possible confusion between SS Cyg and the star Misselt 1 which is 2′ away. and very high far-IR fluxes (Howell, Herzog & Robson, 1996). At 12 m the angular resolution is only 30″. There is much that remains to be clarified as regards the mid-IR emission from CVs.
The paper is organized as follows. In §2 we describe our Palomar and Keck observational setup and the data reduction. The visible to near-IR SEDs of the systems are shown in §3 where we fit the expected secondary star SEDs to the observations and investigate any anomalous excess. Only two systems are detected at mid-IR wavelengths: AE Aqr and SS Cyg. The measurements and consequences on models are set out in §4 (AE Aqr) and §5 (SS Cyg). In §6 (which may be skipped by the observationally minded reader) we return to our original motivation for this project and explore the implications of our mid-IR upper limits on the presence and observational prospects for detecting CB discs. We conclude in §7.
| Object | Clas. | Sec. | Dist. | Refs | |
|---|---|---|---|---|---|
| (hrs) | (pc) | ||||
| AE Aqr | IP | 9.88 | K4V | 102p | (1) |
| SS Cyg | DN | 6.60 | K4V | 159p | (2) |
| RX And | DN | 5.04 | K5V | 191w | (3) |
| HU Aqr | P | 2.08 | M4V | 191b | (4) |
| IP Peg | DN | 3.80 | M4V | 130b | (5) |
| WZ Sge | DN/IP | 1.26 | M7V | 48w | (6) |
| RW Tri | NL | 5.57 | M0V | 341p | (7) |
| QR And | SS | 15.8 | ? | 2000c | (8) |
Spectral types determined from visible or IR spectroscopy. Distances determined from: parallax (), white dwarf UV emission models (), -band flux (Bailey, 1981, ), Caii line (). Data from Ritter & Kolb 1998 and (1) Friedjung 1997; (2) Harrison et al. 2000; (3) Smith & Dhillon 1998; Sepinsky et al. 2002; (4) Glenn et al. 1994; (5) Szkody & Mateo 1986 (6) Ciardi et al. 1998; Smak 1993 (7) Dhillon et al. 2000; McArthur et al. 1999; (8) Beuermann et al. 1995.
2 OBSERVATIONS AND REDUCTION
The observations were carried out on the nights of September 15 and 16, 2002 using the 10-m Keck I telescope at IR wavelengths and the Palomar 60-inch for visible light. The telescope pointings were time-correlated to obtain in as much as possible near simultaneous photometry across the spectrum. Some additional mid-IR data was obtained at Keck I using director’s time on August 18, 2002.
| SiC | 17.6 | |||||||||||
|---|---|---|---|---|---|---|---|---|---|---|---|---|
| AE Aqr | 22.2 | 55.5 | 104.3 | 156.1 | 211.5 | 274.6 | 301.0 | 215.3 | 55.32.0 | 24.11.0 | 26.85.5 | |
| SS Cyg | 26.7 | 29.9 | 47.7 | 73.3 | 104.5 | 130.0 | 146.9 | 110.7 | 33.21.5 | 11.60.9 | 3.26.7 | |
| RX And | 13.7 | 9.0 | 9.7 | 11.7 | 16.3 | 19.4 | 21.3 | 16.8 | 14.5 | 6.1 | 152.0 | |
| QR And | 60.4 | 47.3 | 40.8 | 36.7 | 32.6 | 20.1 | 14.2 | 10.3 | 6.4 | 4.0 | … | |
| HU Aqr | 0.7 | 0.5 | 0.6 | 0.2 | 0.8 | 1.2 | 1.3 | 1.0 | 6.6 | 5.3 | … | |
| IP Peg | 0.5 | 1.8 | 1.4 | 1.2 | 4.6 | 11.2 | 12.6 | 10.3 | 8.4 | 10.5 | … | |
| WZ Sge | 5.3 | 4.3 | 3.9 | 3.8 | 3.4 | 2.3 | 2.3 | 2.4 | 7.6 | 4.7 | … | |
| RW Tri | 18.6 | 21.4 | 22.1 | 23.5 | 26.5 | 23.3 | 21.9 | 15.7 | 7.3 | 3.0 | … |
The averages are error-weighted and include all measurements, including those taken during eclipses. Relative errors for single measurements are about 4.5% in and 2% in and 1% in . The mid-IR errors are those of the average value. Upper limits are 5.
2.1 Mid-IR photometry
The mid-IR photometry was acquired with the Long Wavelength Spectrometer (LWS, Jones & Puetter 1993) which shares the forward Cassegrain module of the Keck I with the Near InfraRed Camera (NIRC, Matthews & Soifer 1994). We used the (4.4-5.0 m), SiC (10.5-12.9 m) and 17.6 filters (17.2-18.1 m). Data were taken on a 128x128 Block Impurity Band Si:As infrared array (0.08″ per pixel) in chop-nod mode to correct for sky and telescope thermal background. The frame integration time and number of coadds per chop/nod were set to their nominal values by the controller software once a filter and total integration time on object (excluding overheads) had been chosen. We used combinations of several 100-400s exposures to lower our detection threshold.
The average FWHM during the run was 4.30.9 pixels. We extracted the count rate from a 16 pixel diameter circular aperture and estimated any residual sky from a 20-30 pixel diameter annulus centered on the source. The count rates were converted to fluxes using observations of Ari for which an absolutely calibrated spectrum222Electronic table available at http://www.journals.uchicago.edu /AJ/journal/issues/v117n4/980440/HD12929.tem has been established by Cohen et al. (1999). The observations of Ari were at airmass 1.0 and have a S/N in , 6400 in SiC and 540 with the 17.6 filter. Taking into account the filter transmission, the expected band fluxes are 3.3 10-15 W cmm-1 in band (4.8 m), 1.29 10-16 in SiC (11.7 m) and 2.46 10-17 in the 17.6 m filter. The absolute calibration error is 3.6% () 2.5% (SiC) and 3.4% (17.6). To correct for atmospheric extinction, we adopt the Mauna Kea median values of Krisciunas et al. (1987), 0.22 mags/airmass at 4.8 m, 0.15 at 11.7 m and 0.45 at 17.6 m (with a mags/airmass error on the mean). All the science exposures were taken at airmass . We checked our procedure by verifying that the derived fluxes of the standards ( Dra, Lyr, Peg, Cap, Cet) observed at various times/airmass in between science exposures were consistently found within 1 of their expected values.
AE Aqr is detected at 4.8 and 11.7 m with a S/N20. AE Aqr is also detected in three of the 17.6 m exposures at a flux level 40 mJy and a S/N3 (once on Aug. 18 and twice on Sep. 16). The source is easily identified in the corresponding sky-subtracted images. On Sep. 15, coadding the two best 17.6 m exposures yields a marginal 2.5 detection with a flux of 28 mJy.
SS Cyg is detected at 4.8 and 11.7 mwith S/N10, but not detected at 17.6 m. To increase sensitivity, we combined the four consecutive 312 s exposures made on Sep. 15 and find 7.07.5 mJy at the position of SS Cyg. During those observations the sky steadily increased by about 5% as the airmass increased from 1.24 to 1.43. Combining the two 17.6 m exposures obtained on Aug. 18 yields 6.715 mJy.
For a given LWS pointing, the source position on the array varies by 1 pixel between filters. For AE Aqr and SS Cyg the source location in the instrument field-of-view is known accurately from several filters. For the non-detections of AE Aqr or SS Cyg in single 17.6 m exposures, the count rate was integrated at the expected location to determine an upper limit. When the target is not detected in any band, there is no a priori knowledge of the source position on the detector (because of the wavelength regime and limited field-of-view there is no other object in the image to use for this purpose). In this case, we checked that there is no flux excess in the image with an aperture photometry S/N5 and, hence, adopted a conservative 5 upper limit.
2.2 The mid-IR variability of AE Aqr and SS Cyg
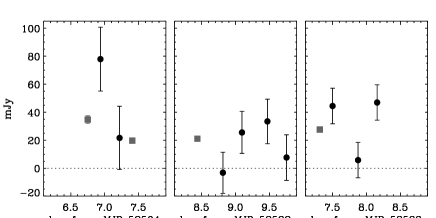
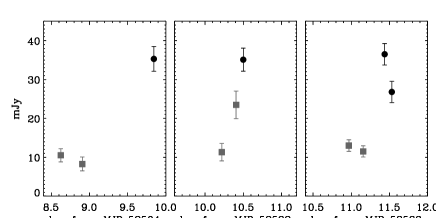
Both AE Aqr and SS Cyg show variations in the mid-IR fluxes measured during the program. These are shown in Figs. 1-2. Since sky transparency or cirrus could be responsible, we inspected the variations in the thermal background of the , SiC and 17.6 m filter chop-nodded images. The night of Sep. 16 offered the best conditions for mid-IR photometry: on Sep. 15 and Aug. 18 the mean sky level was about 15% higher (5% in ). During the exposures, the thermal background was stable to a level % on Sep. 15-16 and 2-5% on Aug. 18.
For AE Aqr, the average sky level was constant during the three consecutive 17.6 m observations of Sep. 16 (airmass 1.1). The non-detection during the second 17.6 m exposure on Sep. 16 is therefore very likely due to source variability. The variability at 4.8 m (%, 4.5 away from the mean) and 11.7 m (50%, 5.5), where the source is well detected above the background should not be affected by sky brightness changes.
The IR fluxes of SS Cyg are constant but for two single measurements which deviate by from the median flux: a factor 2 increase at 11.7 m (3.2) and a 30% decrease at 4.8 m(3.4), both on timescales of a few minutes. The measurements are so close in time that the atmospheric extinction should not play a role. For both observations the sky background was stable to better than 1% both within the exposure and compared to the preceding/following exposure.
In both SS Cyg and AE Aqr there is a well-defined mean at 4.8 and 11.7m. This strenghens our confidence in the data reduction / error analysis and reinforces our conviction that the flux variations are real, particularly when they occur within consecutive exposures on short timescales. Although there does not seem to be any hints of varying sky conditions, a larger set of observations would place the variability beyond any reasonable doubt.
2.3 Near-IR photometry
The , and band photometry was obtained by switching to NIRC (Matthews & Soifer, 1994) either just before or after the LWS mid-IR measurements. Data were taken on a 128x128 pixels (0.15″ per pixel) infrared InSb subarray with integration times of 0.038-1.5s to avoid detector saturation. For each source, between 20 and 500 short integrations were coadded to increase signal-to-noise at two telescope nod positions 5″ apart. Subsequent subtraction of the two images removes the sky thermal contribution at the source position.
During the program, the average FWHM was 3.8 pixel. Count rates were extracted from a 10 pixel diameter circular aperture. Absolute photometry was derived from observations of SJ 9107 (=11.9340.005, =11.6100.004, =11.4920.011, see Persson et al. 1998). Atmospheric extinction is corrected using the median values observed at Mauna Kea (0.102 mag/airmass in , 0.059 in and 0.088 in , see Krisciunas et al. 1987). We checked the consistency of our calibration with four other standards observed during the run. Comparing the count rates of the standard stars at the two consecutive nod positions, we find the error budget is dominated by a systematic uncertainty 0.05 mags. Individual , and band measurements for the cataclysmic variables are listed in Tab. 1. Magnitudes are converted to fluxes in Jy using the California Institute of Technology (CIT) zero points.
2.4 Visible light photometry
Optical images were taken in Johnson , , and Kron-Cousins , filters for each object at the Palomar 60-inch. Each object was observed 1-4 times in each filter. Images were dark-subtracted, flat-fielded using twilight exposures, and cosmic-ray subtracted. Aperture photometry was performed with a 9.4″ (25-pixel) radius aperture (except WZ Sge, described below), estimating the sky background from an annulus with inner and outer radii of 10″ and 20″ (27 and 54 pixels). The IDL procedure aper, a component of the IDL Astronomy Users Library, was used for the photometry and sky subtraction. Landolt (1992) standards 110 441, 115 420, and 110 502 (reduced using the same aperture photometry as above) were used for absolute calibration and estimation of color and extinction corrections.
The field of WZ Sge was too crowded to use the same aperture, so a 2″ aperture and sky annulus with radii of 10″ and 5″ were used. Two nearby differential photometry standards, stars 7 and 12 of Misselt (1996), identical to stars 48 and 45 of Henden & Honeycutt (1997), were analyzed using both the smaller and larger apertures to estimate the aperture correction to match measurements of the other objects and standard stars. A number of other differential standard stars from Misselt (1996); Henden & Honeycutt (1997), in the fields of AE Aqr, SS Cyg, RX And, IP Peg, and RW Tri, were analyzed to ensure that photometric conditions were consistently good throughout the observing run.
2.5 Visible and near-IR variability
Some objects show small-amplitude variability in the visible, perhaps due to flickering (usually interpreted as stochastic processes in the accretion flow). This is most prominent at short wavelengths where accretion dominates the SED. Four objects are also known to undergo eclipses of the primary (HU Aqr, IP Peg, RW Tri) or of the hot spot (WZ Sge). Using published ephemeris for these objects (respectively Schwope, Mantel & Horne, 1997; Beekman et al., 2000; Robinson, Shetrone & Africano, 1991; Patterson, Richman & Kemp, 1998), we find that the data for HU Aqr were taken at phases , the data for IP Peg were taken at phases and that the data for WZ Sge is taken at phases . All of these measurements are likely to be affected by an eclipse.
3 SECONDARY STAR CONTRIBUTION TO THE SPECTRAL ENERGY DISTRIBUTIONS
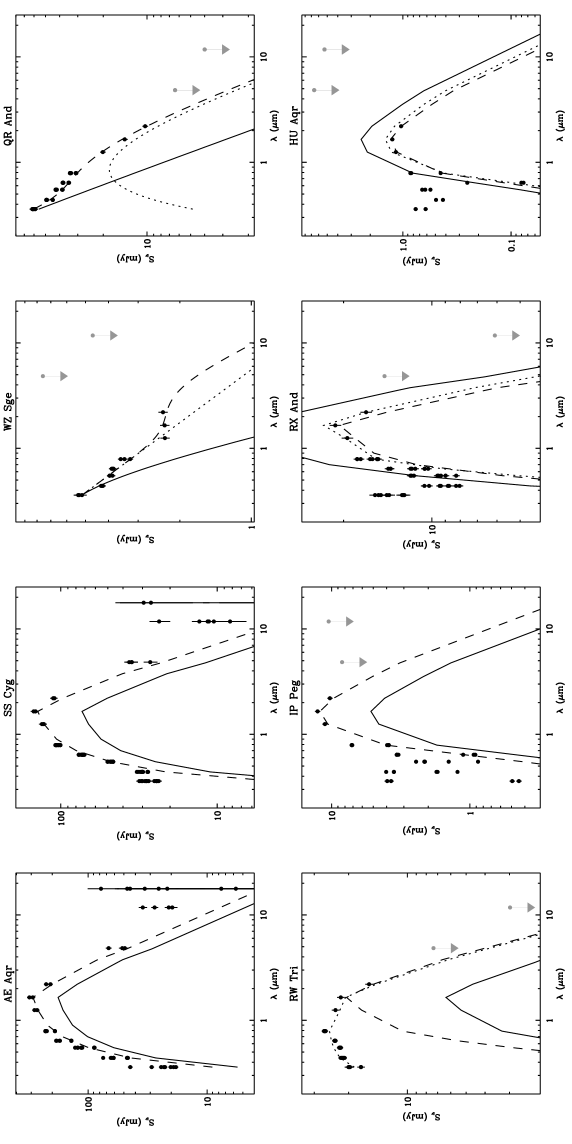
We constructed the spectral energy distribution of each system from visible to IR wavelengths using this new data. All of our derived fluxes, errors and upper limits are plotted in Fig. 3. We detect all of the objects in near-IR but only two objects at mid-IR wavelengths, SS Cyg and AE Aqr (these measurements are discussed in §4 and §5). In this section we analyze the visible and near-IR flux densities in terms of the expected contributions from the secondary star and investigate any long wavelength excess.
3.1 Expected secondary star SEDs
Our choice of plotting flux densities in mJy against wavelength in Fig. 3 highlights the K/M secondary star contribution which peaks in near-IR. Except for the short period WZ Sge and the supersoft QR And, the donor star is easily identified as a bump in the SED. We list in Tab. 1 the spectral type of the secondary in each system as determined from previous visible/IR spectroscopy studies (references are listed in Tab. 1). The uncertainty is typically one subtype. In principle, knowledge of the spectral type and distance allows one to subtract the contribution of the secondary from the SED. To compute expected secondary star SEDs we use the tables of colour and absolute magnitudes as function of spectral type compiled in Cox (2000, p.151 and p.388) with additional data from Johnson (1966) and Bessel (1991). These tables cover the to (or ) bands. The fluxes at longer wavelengths were extrapolated assuming a Rayleigh-Jeans tail.
The expected SED of the secondary star under the assumptions of Tab. 1 is plotted as a solid line in Fig. 3. For AE Aqr, SS Cyg, IP Peg and RW Tri the expected flux is smaller than the observed SED. For HU Aqr and RX And the expected flux is too large. In both cases, the observed and expected near-IR SED can be matched by varying the distance (dashed line in Fig. 3). In so doing, we assume the secondary contributes all of the near-IR flux from the system hence a priori neglecting contributions from the accretion flow, hot spot, white dwarf and CB disc. The inferred distance to the system is a lower limit. We obtain 80 pc for AE Aqr, 115 pc for SS Cyg, 85 pc for IP Peg, 190 pc for RW Tri, 270 pc for RX And and 260 pc for HU Aqr.
3.2 IP Peg, RX And and HU Aqr
The distance listed in Tab. 1 for IP Peg is based on the mid-eclipse band flux while our out-of-eclipse SED clearly includes flux from accretion, thus making the source appear closer. Assuming the distance to IP Peg is 130 pc (Szkody & Mateo, 1986), we find the secondary contributes 43% of the near-IR flux while Littlefair et al. (2001) find that the secondary contributes about 62% from band spectra. In both RX And and HU Aqr, the expected secondary is too luminous at the distance in Tab. 1. The distance to HU Aqr is based on the band flux and has an uncertainty compatible with our measurement (191 pc). The distance to RX And is based on the UV spectrum of the white dwarf and can probably also accomodate the 35% discrepancy. Alternatively, a slightly later spectrum could reconcile the observed SED and the distance in Tab. 1 for both objects (K7V instead of K5V for RX And and M4.5V instead of M4V for HU Aqr, shown as a dotted line in Fig. 3). Ciardi et al. (1998) find that the eclipse fluxes of HU Aqr are best fitted by a M6V star.
3.3 RW Tri, SS Cyg and AE Aqr
The parallax distances for RW Tri, SS Cyg and AE Aqr (respectively 341 pc, 159 pc and 102 pc) allow a more accurate determination of the contribution from the secondary. Our inferred distance is within the error on the parallax distance of AE Aqr, hence the secondary could well contribute all of the near-IR flux from the system. For SS Cyg and RW Tri, our photometric distance is much lower. Assuming the parallax distance and spectral type of SS Cyg and RW Tri are correct333We note that the parallax distance of SS Cyg is inconsistent with the system being a dwarf novae: within the usual assumptions of the disc instability model, the luminosity would then imply a novae-like mass transfer rate (Schreiber & Gänsicke, 2002)., the secondary contributes 60% of the near-IR flux in SS Cyg and 38% in RW Tri. Considering the residuals this would leave for SS Cyg, it is more likely that the luminosity of the secondary is underestimated rather than there is a large residual flux from accretion (in which case one would expect power law residuals). By comparing such photometric estimates of the fractional secondary contribution to others obtained by template fitting of spectroscopic data, Harrison et al. (2000) also find that the secondary star of SS Cyg is more luminous than its spectral type would indicate. Secondaries in long-period CVs (such as AE Aqr or SS Cyg) are likely to be evolved and have larger radii than main-sequence stars of the same spectral type (Smith & Dhillon, 1998).
For RW Tri, a secondary contributing all of the -band flux would leave significant residuals. Dhillon et al. (2000) find that 65% of the -band light from RW Tri is from the M0 secondary. Fixing the M0 contribution to 65% of the band flux, we find the residuals are adequately fitted by a blackbody of temperature 10,000 K and a peak flux at m of 22 mJy. This two-component model is shown by a dotted line in Fig. 3. The corresponding blackbody radius444Defined so that the solid angle under which the blackbody is seen is cm is comparable to the expected size of the hot ( K) and stable accretion disc in this novae-like system (Smak, 1995). RX And and SS Cyg which have comparable (comparable disc sizes) are dwarf novae observed in quiescence in which the disc is cold.
3.4 WZ Sge
There is no obvious signature of the secondary in WZ Sge. The and band fluxes of WZ Sge agree well with a Rayleigh-Jeans tail (solid line, Fig. 3). The blackbody temperature would be 15,000 K, in line with UV data fits which give a quiescent temperature of 16,500 K for the white dwarf primary (Smak, 1993). However, there are other contributions at and longer wavelengths which cannot be explained by a simple combination of the Rayleigh-Jeans tail with another, lower temperature blackbody. Our SED is identical to that of Ciardi et al. (1998), showing WZ Sge has returned to a similar quiescent state following its 2001 outburst. Following their work, we also found that the overall SED could be reproduced by the sum of a flattish power law (, dotted line in Fig. 3) and a blackbody with a temperature 1700 K. Previous studies have shown that most of the visible and near-IR light in WZ Sge could arise from the hot spot (Spruit & Rutten, 1998; Ciardi et al., 1998). The flat index of the power law may therefore be linked to the hot spot rather than to the accretion disc. The ’flattening’ at is due to the small contribution from the secondary (dashed line in Fig. 3). We find the blackbody radius of the fitted 1700 K secondary is 0.1 R⊙ (/48 pc), consistent with the expected Roche lobe size (Smak, 1993). The secondary would contribute 20% of the -band flux, in rough agreement with spectroscopic estimates that give 10% (Ciardi et al., 1998; Dhillon et al., 2000).
3.5 QR And: signs of an F-subgiant secondary ?
In the supersoft source QR And, the white dwarf has a temperature eV. As in WZ Sge, there are additional sources of radiation above the Rayleigh-Jeans tail of the white dwarf radiation. Unlike WZ Sge, this extra component is very well modelled by a single blackbody with a temperature of 6000 K. The corresponding blackbody radius is 3 R⊙ (/2 kpc). This emission could arise from the accretion disc or the secondary. A hot, optically thick disc (as expected in a supersoft with a high mass transfer rate) would have a flatter spectrum blueward of the peak. On the other hand, the temperature and radius correspond well to a late F subgiant filling its Roche lobe.
This is the type of secondary expected in models in which continuous nuclear burning on the white dwarf is fueled by Roche lobe overflow (Kahabka & van den Heuvel, 1997). Light from accretion processes and from the white dwarf swamps the stellar features from the companion (H and metal lines) in visible spectra, rendering identification arduous. In our spectral decomposition, the secondary contributes 80% of the light above 1 m. The absence of ellipsoidal modulations would imply a low system inclination. At the same time the system cannot be face-on since eclipses of the hot inner disc are observed in UV (Hutchings et al., 2001).
We are aware of only one previous IR study of QR And, that by Quaintrell & Fender (1998). Their near-IR spectra show no lines from the secondary as expected from a late F type. Their broad band SED does not show the excess we identify. However, their photometry associates data with data taken two years earlier and the non-simultaneity could explain the discrepancy. Our data tentatively provides the first hint of the secondary star in a supersoft source.
4 MID-INFRARED EMISSION FROM AE Aqr
The average mid-IR flux levels are well in excess of the Rayleigh-Jeans tail from the secondary star, even when it contributes all of the near-IR flux. At 4.8 m, the lowest fluxes (50 mJy) are compatible with the Rayleigh-Jeans tail but the highest flux (67 mJy) is 4.5 above. At longer wavelengths the discrepancy is much greater (see Fig. 4). The variability and 17.6 m detection clearly require an additional source of radiation.
4.1 Thermal circumbinary emission ?
If the source is thermal, the increase in flux (upturn) from 11.7 to 17.6 m suggests its temperature is in the range 200-300 K. Assuming blackbody radiation, the required area would be cm2, larger than the binary size.
Based on the Sep. 16 observations, the timescale for the mid-IR variability is 15 mn. It is doubtful that such a large emitting area can coherently vary on such a short timescale. In a CB disc the shortest timescale is the Keplerian timescale at the inner edge of the disc and this is longer than the 9.88 hr system orbital period. Flickering on timescales of mn with amplitude mag in the visible lightcurve of CVs has been attributed to the outer accretion disc hotspot (where incoming material intersects the disc), circumventing the Keplerian timescale lower limit. We cannot strictly rule out similar flickering produced by material added in a boundary layer at the CB disc inner edge or from MHD turbulence in the CB disc. Reprocessing by circumbinary material of variable high energy photons emitted deeper in the potential well is unlikely since the mid-IR flux is of the same order as the UV/X-ray flux ( erg cm-2 s-1, Eracleous & Horne 1996). A 50% mid-IR variability would require changes of a factor 5 or more in the irradiation luminosity. We conclude that the variability would be quite outstanding if the flux is thermal. There is, however, a much simpler non-thermal explanation.
4.2 IR synchrotron from expanding clouds
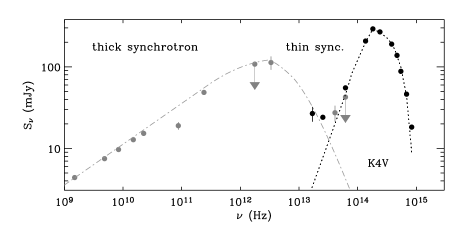
AE Aqr is unique amongst cataclysmic variables for its radio flares. These flares are interpreted as self-absorbed synchrotron emission from expanding clouds of relativistic electrons propelled out of the system by the fast-spinning white dwarf (Bastian, Dulk & Chanmugam, 1988). These same clouds can produce highly variable IR emission in their early stages, which can explain our observations.
The time-averaged radio spectrum has a slope (Abada-Simon et al., 1993) flatter than the 2.5 slope expected from self-absorbed synchrotron from a power-law distribution of relativistic electrons. This likely results from the superposition of many flares emitted at different times and cooling adiabatically. Within the framework of van der Laan (1966) the spectral index of the summed contribution can be shown to have an asymptotic value of:
| (1) |
where is the energy index of the electron power-law distribution and characterizes the cloud expansion ( for steady expansion and for expansion in a uniform medium). The 0.5 radio slope suggests decelerating blobs if, as is likely, .
In Fig. 4 we plot the SED including the radio and ISO measurements (7.3, 90 m) or upper limits (4.8, 170 m) reported in Abada-Simon et al. (1993, 2002). Our observations fit in well, confirming the synchrotron emission does extend to the IR in the optically-thin regime. The variability and mid-IR fluxes are easily interpreted in terms of this emission. If the synchrotron peak is at frequencies close to 3300 GHz, then the initial electron cloud size is of the order:
| (2) |
The adiabatic cooling timescale is of the order 10 hr for an initial expansion speed of 1000 km/h. The synchrotron cooling timescale is initially of order
| (3) |
but increases quickly as the cloud expands (). Synchrotron losses largely dominate in the IR, causing rapid variability. In fact, the mid-IR probably varies on much shorter timescales (seconds to minutes) than we observe.
With synchrotron losses dominating, the spectral slope in the optically-thin regime steepens from to (Kardashev, 1962). The IR spectral index can be estimated from the consecutive 11.7 m and 17.6 m measurements taken at the beginning of Aug. 18 and Sep. 16. We find (Aug. 18) and -1.1 (Sep. 16) implying , close to the canonical .
Our observations do not have the time-resolution and multiwavelength simultaneity necessary to prove that the mid-IR emission does come from ejected clouds. Such information could readily be obtained by the Multiband Imaging Photometer flown on SIRTF and would yield important information on the first stages of particle acceleration/cooling. Brighter and closer than neutron stars in the propeller regime, AE Aqr is an ideal test-bed for studies of the magnetic field - accretion flow interaction.
5 MID-INFRARED EMISSION FROM SS Cyg
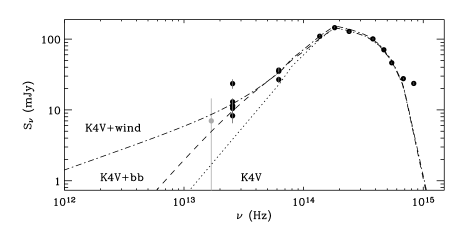
Inspection of the AAVSO lightcurve shows our observations of the dwarf novae SS Cyg occurred while the system was in quiescence. Our SED is consistent with that reported in quiescence up to the band (3.4 m) by Szkody (1977). We detect this system at 4.8 m and 11.7 m with fluxes of 33 mJy and 11.6 mJy respectively. Both fluxes are well in excess of the mid-IR levels expected from extrapolating a K4V secondary star normalised to the flux if we conservatively assume that the secondary is contributing all of the near-IR (Fig. 5). Even with accurate distances, deconvolving the SED for the various contributions (accretion, white dwarf, secondary…) introduces too many parameters to unambiguously identify an excess at visible to near-IR wavelengths (e.g., Harrison et al., 2000).
Our maximum measured 11.7 m flux (23.53.6 mJy) is 5 away from the expected secondary star Rayleigh-Jeans flux, clearly in excess of our optimistic estimate of a few mJy. The measurements, which were obtained in quiescence, are consistent with the upper limits obtained by Jameson et al. (1987) when SS Cyg was not yet in full outburst (see §1). But the 11.7 and 17.6 m measurements fall far below the (conflicting) 12 and 25 m IRAS detections in outburst reported by Jameson et al. (1987) and Harrison & Gehrz (1992). It remains possible that the mid-IR flux increases considerably during outburst, perhaps due to the IR tail of the much brighter accretion disc.
5.1 Emission from circumbinary material ?
The IR variability suggests another emission component is present besides the secondary star. As SS Cyg was in quiescence during the observation, we consider it unlikely that the origin is the accretion disc. Quiescent accretion discs have flat temperature distributions (as inferred from eclipse mapping and theoretical models) and are probably optically thin with K. A disc blackbody (see §6) with an outer radius equal to the white dwarf Roche lobe (5 1010 cm) and a uniform temperature of 3000 K still fails to account for the average 11.7 m flux by a factor (an order-of-magnitude with the highest flux).
If thermal, the extra component is more likely to peak at those wavelengths where we see most of the variability, and hence is characterized by a lower temperature. A blackbody with a temperature lower than 1000 K could account for the observations (see Fig. 5). But with a constant emitting area cm2 (at 159 pc), the component is larger than the binary size (cm) and thus not associated with the accretion disc.
Just as we previously argued for AE Aqr, such thermal circumbinary emission is hard to reconcile with rapid flux changes. Naively, the intrinsic emission from a CB disc is expected to be constant on timescales shorter than the 6.6 hr orbital period. However, more complex models taking into account MHD turbulence, mass input into a fluctuating boundary layer or modes excited by tidal torques could lead to rapid flickering in circumbinary material and cannot be ruled out. A longer set of data would be needed to characterize this variability (stochastic, periodic, intermittent, etc).
Reprocessing of the binary radiation seems difficult. The IR variability would imply large variations of the irradiating luminosity by a factor (the reprocessed flux in the Rayleigh-Jeans regime). In quiescence, the high energy photons from the boundary layer are emitted in X-rays with a flux erg cm-2s-1 (Wheatley et al., 2003), which is only a factor of a few higher than the IR fluxes. We cannot rule out that there is a large, varying EUV flux but this stretches plausibility. Because of these arguments (and others in §6), we cannot make a solid case for thermal circumbinary emission and have explored other possibilities.
5.2 Free-free emission from a stellar wind ?
The white dwarf in SS Cyg has a lower magnetic moment than the intermediate polar AE Aqr. Since it is not detected in radio (Cordova, Hjellming, & Mason, 1983) and does not show the large flares that are so prominent in AE Aqr, the IR fluxes in SS Cyg do not likely result from matter ejected by a propeller.
An alternative explanation for the mid-IR excess involves optically thick free-free radiation emitted by a wind from the secondary star or accretion disc. Magnetic braking of the binary system by the secondary star wind is widely believed to be responsible for the evolution of CVs above the period gap (see however, §1). The free-free emission from a uniform, spherically symmetric ionised wind leads to a power law spectrum in radio and IR with (Panagia & Felli, 1975; Wright & Barlow, 1975).
The median 4.8 and 11.7 m fluxes of SS Cyg give an index . However, the thermal spectrum of the secondary is a significant contribution to the 4.8 m flux. Assuming the median 10 mJy flux at 11.7 m comes entirely from the wind, the expected 4.8 m flux is 17 mJy. Since the median 4.8 m flux is 35 mJy, this would imply the secondary star contributes about 18 mJy at this wavelength, consistent with the Rayleigh-Jeans tail. At 17.6 m, the expected flux would be mJy at the limit of our sensitivity. The extrapolated flux would be 0.05 mJy at 6 cm, which is consistent with the 0.1 mJy upper limit of Cordova, Hjellming, & Mason (1983). The excess appears compatible with a spectrum extending to the radio. The proposed low frequency contribution to the SED from wind free-free emission is shown in Fig. 5
The wind mass loss rate required to explain the IR flux is (Wright & Barlow, 1975) :
| (4) |
where we have assumed a wind speed of 50 km s-1 and a wind temperature of 10,000 K. The corresponding radius of the emitting region at 11.7 m is about cm which also happens to be the size of the Roche lobe of the star and comparable to the outer radius of the accretion disc. Variations in the IR flux could well be attributed to inhomogeneities in the temperature, density or ionisation of the wind close to the launching region. Alternatively, the variations could be due to coherent emission during flares. This would probably require very powerful magnetic fields (107 G, white dwarf origin ?) for the gyrofrequency to be in IR.
The derived wind mass loss rate is very high, orders of magnitude more than what would be expected from a field red dwarf and of the same order as the mass loss through Roche lobe overflow. UV resonance lines from a disc wind are observed during outbursts of dwarf novae but these have lower mass loss rates and higher speeds by several orders of magnitudes and we can only speculate as to the connection with the present observations. The assumptions underlying our estimate may be too simplistic. The IR photons are emitted close to the launching region, not only where the wind is still accelerating but also where spherical symmetry breaks down. The rapid rotation of the phase-locked secondary and/or the complex configuration of the magnetic fields will give substantial deviations from the time-averaged, simple model used above. A fast magnetic rotator in this context could give rise to flares of enhanced wind mass loss rate compared to the Sun. Our estimate should therefore be considered with caution. Observations at longer wavelengths, which probe a larger volume and will be less prone to the caveats described, are urged to establish the nature of the IR excess and (eventually) to give a better estimate of any wind mass loss.
6 LIMITS ON CIRCUMBINARY MATERIAL
CB discs, once in place around a binary, have a nearly indefinite life time and there are several avenues by which material could end up in a CB disc during the birth and evolution of a binary (see §1). CB discs are a tantalizing possibility for explaining several anomalies in CV phenomenology, but direct observation is the only way to firmly establish their presence or absence. In this section we explore in some detail what we can deduce in this respect from the observations presented above. The conclusions of this section are compiled in §6.5.
We start by showing that if there is a significant amount of circumbinary material then it has to be in a circumbinary (CB) disc. By using the expected SED, the observations can limit the maximum temperature in the disc. At the same time, passive reprocessing of the binary light gives a minimum temperature of the CB disc. Within the uncertainties in the distance and the inclination angle of the systems, our results cannot definitively indicate the presence or absence of a CB disc. The CB discs in these systems may be shadowed, or have their inner regions vaporized and devoid of dust. Any sizeable CB disc in the systems we observed is likely to be predominantly cold and/or optically thin with a peak thermal emission at longer wavelengths than we observed. We conclude on the observational prospects for CB discs.
6.1 IR emission from optically thin material and limits on dust mass
Cataclysmic variables do not show large visual extinctions, even at high inclinations. In our sample, the most reddened object is the eclipsing source RW Tri, which only has (Verbunt, 1987). Any circumbinary material covering a large solid angle must therefore be optically thin (this is briefly mentioned by Berriman, Szkody & Capps, 1985). At low temperatures dust dominates the opacity so the requirements that translates into an upper limit on the column number density of grains of size :
| (5) |
where ( in cm, in K) is the Planck-averaged absorption efficiency of grains with respect to radiation of temperature . We use this upper limit below.
Dust will be destroyed if its temperature is above the sublimation point K. The radiative equilibrium of dust grains at a radius heated by radiation of temperature and luminosity can be written as (e.g., Clayton & Wickramasinghe, 1976):
| (6) |
where is the size of the grains and their temperature. The dust temperature for =1032 erg s-1 at 1 AU will be:
| (7) |
where the upper limit comes from taking for absorption (high ) and m, characteristic of condensation nuclei. Larger or lower yield lower . The integrated optical to near-IR luminosities we observe range between 1031-32 erg s-1 except in QR And ( erg s-1). The luminosity from accretion in a cataclysmic variable (emitted in UV) reaches at most a few erg s-1. Nova episodes during which the luminosity increases to Eddington values may periodically destroy the grains at radii AU. In QR And nuclear burning is continuous so that the UV flux is probably too high for dust to be present close to the source. Nova outbursts occur on timescales of 1000 - 10000 years, which should leave time for dust to reform in the circumbinary material. For a typical CV, we conclude the temperatures are likely sufficiently below sublimation (Eq. 7) for dust to exist at radii cm.
The settling timescale for a condensation nucleus ( m, g cm-3) is
| (8) |
at the inner edge of a CB disc (1011 cm) with g cm-2. This is usually taken to give an idea of the timescale on which larger grains might grow. However, there is considerable uncertainty since turbulence, radial drift, drag, coagulation and others are likely to change how large the dust can get and on what timescale. Whether dust can form at all in a CB disc is an open question. Note that the material from which the CB disc is formed could be intrinsically dusty if it comes from the remnants of the common envelope phase. Alternatively, observations of some novae show that M⊙ of dust is formed in the shell ejecta within days of outburst. Most of the ejecta has escape velocity but a small fraction at the low velocity end could stay bound to the system and provide a way to fuel the CB disc in dust. In the following, we assume dust is present when the temperatures are below sublimation.
The flux density at a frequency due to optically thin dust at temperature and distance to observer is:
| (9) |
where at 10 m (Draine & Lee, 1984) and is total number of grains. At 11.7 m, is maximized at K. The characteristic radius of the dust is given by Eq. 6. Since then, using Eq. 5, we rewrite the flux density as a function of :
| (10) |
and the requirement that gives an upper limit on . Note that the dependence on cancels out so that this depends only on , and . Our observational upper limits at 11.7 m are about 7 mJy. Depending upon whichever is lower for the parameters considered, we take this observed value or that given by Eq. 10 at 11.7 m (with =0.1) and calculate the maximum allowed dust mass . Fixing pc and the grain density 2.25 g cm-3, we find that the maximum dust mass at radii less than 10 AU is very small M⊙ for K and erg s-1, decreasing rapidly with .
Using (1) that the extinction to CVs is low and (2) our IR upper limits, we find there cannot be a significant amount of optically thin material within 10 AU covering a large solid angle as viewed from the source. If a large mass of bound material has piled up at circumbinary radii then it must have formed an optically thick, geometrically thin disc. Even then, the low extinction hints that the circumbinary discs cannot be too massive: for instance, Bertout (2000) finds that on average more than 20% of T Tauri circumstellar discs irradiated by a K7V star should be extinguished if their mass flow rates M⊙ yr-1. At most, CVs show only a weak trend of being redder with higher inclination (Hoard et al., 2002).
The small amount of matter surrounding CVs also gives some ideas on mass transfer onto this circumbinary disc. An upper limit on the mass transfer rate at a given radius is set by dividing by the Keplerian orbital timescale at . Most of the matter leaving the binary is added at small radii where the orbital timescale is short. is M⊙ yr-1 at radii AU if the dust reprocesses efficiently a 1032 erg s-1 luminosity. Assuming a dust-to-gas ratio of 1% (typical of protoplanetary discs) the circumbinary mass transfer rate is very small, probably much less than 0.1% of the mass transfer rate between the secondary and white dwarf. We note, however, that these limits do not apply if (i) the dust-to-gas ratio in the transfered material is very small because dust is vaporised or has not had sufficient time to condense and/or (ii) the transfer occurs within a small opening angle within the orbital plane.
6.2 SED of optically thick CB disc
The transport of angular momentum in a geometrically thin, optically thick circumbinary disc generates ‘viscous’ heat which is radiated thermally. Theoretical models show that the optically thick region of a CB disc expands to AU scales on timescales of tens of Myrs (Dubus, Taam & Spruit, 2002; Taam, Sandquist & Dubus, 2003). The luminosity and SED of the disc will depend on its (uncertain) evolutionary stage but the effective temperature can be written as a power law:
| (11) |
with the inner radius of the circumbinary disc, the effective temperature at this radius and the index. Models show is initially steep with . As the disc evolves, the mass flow rate becomes almost constant in the optically thick region, approaching the steady-state Shakura-Sunyaev index of 3/4 (Dubus, Taam & Spruit, 2002). Assuming each annulus in the optically thick disc radiates as a blackbody, the expected SED is the standard:
| (12) |
where is the binary inclination, the distance and is given by Eq. 11. For intermediate frequencies the spectrum is a power law . At smaller frequencies the spectrum has a Rayleigh-Jeans tail and at higher frequencies the spectrum has a Wien cutoff. As increases or when the disc is not very extended, the spectral window where the power law approximation is valid is reduced and the SED approaches a blackbody.
6.3 Upper limit on the CB disc temperature from mid-IR fluxes
The CB disc inner radius is set by tidal truncation at where is the binary separation and the origin is at the binary centre-of-mass (Artymowicz & Lubow, 1996; Günther & Kley, 2002). cm for the systems we surveyed (the values are given in Tab. 3). At a given frequency and for a given index , the expected flux as given by Eq. 12 depends only on and . determines only the location of the Rayleigh-Jeans tail at low frequencies and our observations are insensitive to it. Therefore, for a given , the observed SEDs allow us to place an upper limit on .
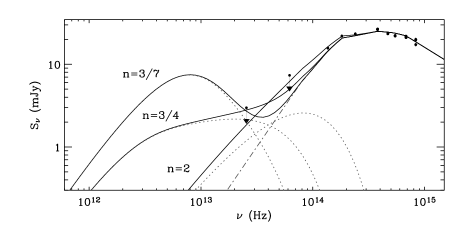
As an example we take RW Tri and plot in Fig. 6 the expected SEDs obtained by finding the maximum consistent with the observed mid-IR fluxes, for various values of . For RW Tri we have cm, and we arbitrarily choose AU (a higher would move the Rayleigh-Jeans tail to lower in Fig. 6). The maximum allowable is 2150 K for =2, 1070 K for =3/4 and 610 K for =3/7. A steep temperature distribution decreases the sum of the blackbody contribution at a given frequency and allows higher temperatures. Except for high , the observations require the disc SED to be in the Wien regime at mid-IR wavelengths: our upper limits ‘force’ the peak contribution from the CB disc to longer wavelengths. The visible and near-IR flux would be grossly overestimated if the temperature were high enough to have the mid-IR in the power-law regime of the disc SED.
Tab. 3 lists the maximum temperatures that can fit the observations of the various systems if we assume a disc with =3/7 (an optically thick irradiation dominated isothermal CB disc, see §6.4) with =3/4 (appropriate for a large, evolved viscous CB disc) or =2 (representative of a small, unevolved CB disc). The distance and inclination angle have the values listed in Tab. 3. We omit AE Aqr as the evidence clearly points towards a different origin for the mid-IR emission. In all the systems, the CB discs must have low temperatures in order to fit the observations. Comparison with theoretical models suggests that, because of the temperature limit, the putative CB discs in our systems would not be large and massive.
6.4 Lower limit on CB disc temperature from stellar irradiation
Protoplanetary discs are very similar in size, density and temperature to large, evolved circumbinary discs. The visible to near-IR SEDs of CVs and T Tauris are comparable: the distance to the objects ( pc) and spectral type of the stellar component (K-M) are not very different. T Tauris show large IR excesses associated with thermal emission from circumstellar dust heated by stellar radiation (see e.g., Rucinski, 1985). Reprocessing can largely enhance the emission above that expected from ‘viscous’ heating alone.
The temperature in a flat disc reprocessing light from a star of radius and temperature is (Friedjung, 1985; Adams & Shu, 1986):
| (13) |
where . At large radii mimicking a viscous disc. Any other source of heat (viscosity) will raise the temperature above this minimum. Such a disc can reprocess up to 25% of the stellar radiation. The assumption of a flat disc is acceptable if most of the dust (dominating the opacity) has settled down to the midplane. However, irradiation heating will likely puff up the disc and enable more of the stellar flux to be intercepted. Dust in the optically thin upper layers of the disc will also raise the IR flux (Chiang & Goldreich, 1997). Taking the flaring into account, a steady, optically thick, passive disc dominated by the reprocessing of light from a point source will have a height and a temperature distribution , much shallower than that of Eq. 13.
Neglecting flux from the primary and other sources, the minimum irradiation is that from the secondary. The time-averaged flux is approximately equivalent to placing the secondary star at the binary centre-of-mass and irradiating the inner edge of the CB disc at a distance of 1.7. If all of the stellar radiation is absorbed by dust and the CB disc is not shadowed (we come back on these assumptions below), the minimum will be given by (Eq. 13). We take the Roche lobe radius for and the effective temperature corresponding to the secondary spectral type for . The value of for each system can be found in Tab. 3.
Fits to the observed SEDs with a multicolour disc (Eq. 12) give upper limits to for given power-law distributions which must be compatible with the expected minimum temperature from irradiation . The results of Tab. 3 shows that the lower limits, , are inconsistent with the upper limits, , for irradiation-dominated discs (those with ), in all cases except HU Aqr and WZ Sge, the systems with the shortest . Consistency requires steeper values of , hence some intrinsic viscous heating. In most systems values of between 3/7 and 3/4 (the temperature distribution of a stationnary optically thick Shakura-Sunyaev disc) are sufficient. In SS Cyg and RX And steeper temperature distributions are required, implying small CB discs. Any flaring will increase the value of , although not above that given by geometric dilution which are a factor 2 higher than the values in Tab. 3. Additional contributions to irradiation from the white dwarf or accretion flow will also increase this minimum value. Higher values of will require even higher values of for consistency in systems other than SS Cyg and RX And.
| Object | max | ||||||
|---|---|---|---|---|---|---|---|
| (1010cm) | (K) | ={3/7,3/4,2} | |||||
| SS Cyg | 26.1 | 5.1 | 4340 | 870 | 450 | 630 | 1300 |
| WZ Sge | 6.8 | 0.8 | 1500 | 220 | 480 | 760 | 1000 |
| QR And | 47.6 | 12. | 6000 | 1490 | 900 | 1900 | 2700 |
| RW Tri | 18.8 | 4.5 | 3800 | 890 | 610 | 1070 | 2150 |
| IP Peg | 17.7 | 3.5 | 3180 | 640 | 550 | 930 | 1300 |
| RX And | 20.6 | 3.7 | 4340 | 820 | 500 | 770 | 1500 |
| HU Aqr | 10.1 | 1.5 | 3180 | 520 | 840 | 1100 | 1250 |
is the inner CB disc radius. is the secondary star Roche lobe radius. is the effective temperature corresponding to the secondary star spectral type (Tab. 1). is the expected temperature at for a flat disc reprocessing the stellar radiation, which represents a temperature lower limit (§6.4). is an upper limit to the temperature at allowed by our observations for a CB disc with a temperature distribution (§6.3). The last three columns are for (left to right) , and . was set at 1 AU. The binary parameters used (mass, , , ) are taken from Ritter & Kolb (1998). For QR And we took =2M⊙, =2, =60 and =6000 K (§3.5).
Our analysis regarding reprocessing may overestimate its effect if most of the CB disc is shadowed and is not exposed to the light emanating from the binary system (secondary or other sources). Provided that the shadowed region is cold enough that its intrinsic emission has a minor impact in the IR, the overall effect would be identical to having a very small . The maximum allowable is insensitive to except when the disc becomes small, and the small area allows high temperatures while keeping the fluxes low. The pressure scale height variation in CB disc models does suggest that the outer disc is shadowed (Dubus, Taam & Spruit, 2002). Detailed radiative transfer calculations are needed to verify that the inner edge of the CB disc can indeed shadow the rest of the material.
An alternative to shadowing would be a dust-free disc. As discussed in §6.1, it is unclear whether dust in CB discs can form in situ. Since the absorption is essentially due to grains, the efficiency with which radiation is reprocessed (or, equivalently, the inner radius of the optically thick region) would change if the inner CB disc was dust-free. The situation would be comparable to the circumstellar discs of Herbig Ae/Be stars where the large radiation vaporizes the dust at small radii. An optically thin layer of grains can be vaporized up to cm for an average irradiating luminosity of erg s-1 (see §6.1). If there is no reprocessing up to this radius then agreement between and at the optically thick disc inner edge is easier to achieve. A larger requires a lower temperature to fit the IR but the upper limits are looser as the peak thermal emission moves to the far-IR, leaving more room for adjustment between the (optically thick) lower limit and upper limit .
6.5 Summary: prospects for detecting CB discs
We summarize our results before addressing the prospect for finding CB discs.
-
1.
Distributions for circumbinary material other than a thin disc lead to high extinctions or negligible mass.
-
2.
The observations limit the maximum in an optically thick circumbinary disc.
-
3.
The maximum temperature is approximately consistent with the minimum expectations from passive reprocessing of the binary emission. In SS Cyg and RX And the temperature distribution must be steep, implying small CB discs. This will generalise to other systems if we underestimated reprocessing.
-
4.
A small IR luminosity from the CB disc may result from a small or shadowed disc or one in which its inner regions are vaporized.
The contribution from any sizeable CB disc will be significantly affected if it is either shadowed or has little dust in the IR-emitting inner region. In these cases most of the matter will be cold or optically thin, resulting in a shift of the peak emission to longer wavelengths. Observations in far-IR or sub-mm wavelengths would then be more appropriate.
Narrow lines centered at the systemic velocity in high inclination systems may prove a different, more amenable test of circumbinary discs than their continuum emission (§1). For example, Mouchet et al. (2003) reported H2 narrow absorption lines in the FUSE UV spectrum of the polar BY Cam that are intrinsic rather than interstellar. This is particularly important since molecular hydrogen is a clear signature of cold, dusty material. The total column density of H2 in BY Cam is high: cm-2. Hutchings et al. (2001) also report H2 absorption in their FUSE spectrum of QR And with cm-2. However, it is not clear that the absorption is intrinsic in this system. The more accessible H2 1-0 S(1) lines at 2.122 m could be more fruitful than space-based UV in a systematic search for molecular hydrogen in other CVs.
The molecular hydrogen column density can be used to estimate (for instance) the 13CO J=1-0 line at 110.2 GHz in a reverse fashion from what is usually done to interpret sub-mm observations of circumstellar discs (e.g., Scoville et al., 1986; Sargent & Beckwith, 1987). The expected integrated line flux is:
| (14) |
where is measured in units of 1019 cm-2, is the abundance of CO compared to H2 (taken to be 10-4), is the excitation temperature of CO, its optical depth and is the angular size of the emitting source. Taking =1″ =30 K and to estimate the line flux, 13CO emission could be detected in BY Cam (15 mJy km s-1) with present instrumentation.
7 CONCLUSIONS
A search for mid-IR excess emission in several cataclysmic variables has been undertaken, motivated by the possibility that some of them may contain large circumbinary discs influencing their evolution. Simultaneous visible to mid-IR photometry were obtained from which we constructed spectral energy distributions.
We find that the near-IR SEDs of the observed CVs are reproduced by a stellar SED with the spectral type expected from the secondary. Given the uncertainties on distance and that secondaries in CVs may be more luminous than their isolated main-sequence counterparts, we conclude that there is no need for extra components in the near-IR. In RW Tri, a 10,000 K blackbody is needed in addition to the M0 secondary to explain the large visible flux. In WZ Sge, the SED can be reproduced by a power law (accretion or hot spot) + a cool blackbody for the faint, low-mass secondary. In QR And, the SED is decomposed into a Rayleigh-Jeans tail from the hot white dwarf and a blackbody of temperature 6,000 K and radius 3 R⊙. This component is consistent with a late-F subgiant and we propose this is the hitherto undetected companion in this supersoft system.
We detect AE Aqr and SS Cyg in the mid-IR at levels significantly above the extrapolation from the near-IR measurements. In both sources the mid-IR flux is variable on short timescales which may prove difficult to reconcile with intrinsic or reprocessed emission from circumbinary material. The IR detection of AE Aqr fits in very well within the overall picture of a propeller ejecting clouds of relativistic electrons. The synchrotron emission is first seen in IR before the electrons cool and emit in the radio regime. The mid-IR detection of SS Cyg is exciting and puzzling. The base-line flux may be due to a free-free wind. The IR emitting region is close to the wind launching region, explaining the variability. Coherent emission from magnetic flares is another possibility. Follow-up observations with SIRTF of these two objects could provide key insights into the processes at work.
The non-detections at 4.8 and 11.7 m limit the possibilities for circumbinary material. We find that any significant amount of circumbinary material must lay within a small opening angle to avoid significant visual extinction or a large IR flux. For CB discs to be important in the evolution of CVs the discs should be large and massive and characterized by temperatures 1000 K in their inner regions. Recent calculations reveal that the evolution of CB discs to this phase where they would be detectable (Taam, Sandquist & Dubus, 2003) is longer than previously estimated. The existence of less massive and less evolved CB discs is a possibility left open by our data. Reprocessing of the binary emission would make evolved CB discs stand out in the mid IR unless the inner regions of the CB disc are not efficient reprocessors (because dust is destroyed and/or cannot form) or if the CB disc is self-shadowed by its inner edge. In both cases the output from the CB disc is displaced to the far-IR. Sub-mm observations are urged to search for the cold, optically thin material at large radii.
Acknowledgements
Some of the data presented herein were obtained at the W.M. Keck Observatory, which is operated as a scientific partnership among the California Institute of Technology, the University of California and the National Aeronautics and Space Administration. The Observatory was made possible by the generous financial support of the W.M. Keck Foundation. The authors wish to recognize and acknowledge the very significant cultural role and reverence that the summit of Mauna Kea has always had within the indigenous Hawaiian community. We are most fortunate to have the opportunity to conduct observations from this mountain. The authors wish to acknowledge Fred Chaffee, the W.M, Keck Observatory Director, for contributing part of a director’s night to acquire some of these data.
References
- Abada-Simon et al. (1993) Abada-Simon, M., Lecacheux, A., Bastian, T. S., Bookbinder, J. A., & Dulk, G. A. 1993, ApJ, 406, 692
- Abada-Simon et al. (2002) Abada-Simon, M. et al. 2002, SF2A Semaine de l’Astrophysique Francaise, Paris, June 24-29, 2002, Eds.: F. Combes and D. Barret, EdP-Sciences Conference Series, p. 497
- Adams & Shu (1986) Adams, F. C. & Shu, F. H. 1986, ApJ, 308, 836
- Andronov, Pinsonneault & Sills (2003) Andronov, N., Pinsonneault, M., & Sills, A. 2003, ApJ, 582, 358
- Artymowicz & Lubow (1996) Artymowicz, P. & Lubow, S. H. 1996, ApJ, 467, L77
- Bailey (1981) Bailey, J. 1981, MNRAS, 197, 31
- Bastian, Dulk & Chanmugam (1988) Bastian, T. S., Dulk, G. A., & Chanmugam, G. 1988, ApJ, 330, 518
- Beekman et al. (2000) Beekman, G., Somers, M., Naylor, T., & Hellier, C. 2000, MNRAS, 318, 9
- Berriman, Szkody & Capps (1985) Berriman, G., Szkody, P., & Capps, R. W. 1985, MNRAS, 217, 327
- Bertout (2000) Bertout, C., 2000, A&A, 363, 984
- Bessel (1991) Bessel, M.S. 1991, AJ, 101, 662
- Beuermann et al. (1995) Beuermann, K. et al. 1995, A&A, 294, L1
- Chiang & Goldreich (1997) Chiang, E. I. & Goldreich, P. 1997, ApJ, 490, 368
- Clayton & Wickramasinghe (1976) Clayton, D. D. & Wickramasinghe, N. C. 1976, Ap&SS, 42, 463
- Ciardi et al. (1998) Ciardi, D. R., Howell, S. B., Hauschildt, P. H., & Allard, F. 1998, ApJ, 504, 450
- Cohen et al. (1999) Cohen, M., Walker, R. G., Carter, B., Hammersley, P., Kidger, M., & Noguchi, K. 1999, AJ, 117, 1864
- Cordova, Hjellming, & Mason (1983) Cordova, F. A., Hjellming, R. M., & Mason, K. O. 1983, PASP, 95, 69
- Cox (2000) Cox, A. N. (Ed.), 2000, Allen’s astrophysical quantities (4th ed.; New York: AIP Press, Springer)
- Deufel et al. (1999) Deufel, B., Barwig, H., Simic, D., Wolf, S., & Drory, N. 1999, A&A, 343, 455
- Dhillon et al. (2000) Dhillon, V. S., Littlefair, S. P., Howell, S. B., Ciardi, D. R., Harrop-Allin, M. K., & Marsh, T. R. 2000, MNRAS, 314, 826
- Dhillon (1998) Dhillon, V. 1998, ASP Conf. Ser. 137: Wild Stars in the Old West, eds. S. Howell, E. Kuulkers, & C. Woodward, 132
- Draine & Lee (1984) Draine, B. T. & Lee, H. M. 1984, ApJ, 285, 89
- Dubus, Taam & Spruit (2002) Dubus, G., Taam, R. E., & Spruit, H. C. 2002, ApJ, 569, 395
- Eracleous & Horne (1996) Eracleous, M. & Horne, K. 1996, ApJ, 471, 427
- Friedjung (1997) Friedjung, M. 1997, New Astr., 2, 319
- Friedjung (1985) Friedjung, M. 1985, A&A, 146, 366
- Glenn et al. (1994) Glenn, J., Howell, S. B., Schmidt, G. D., Liebert, J., Grauer, A. D., & Wagner, R. M. 1994, ApJ, 424, 967
- Günther & Kley (2002) Günther, R. & Kley, W. 2002, A&A, 387, 550
- Harrison & Gehrz (1992) Harrison, T., Gehrz, R. D. 1992, AJ, 103, 243
- Harrison et al. (2000) Harrison, T. E., McNamara, B. J., Szkody, P., & Gilliland, R. L. 2000, AJ, 120, 2649
- Henden & Honeycutt (1997) Henden, A. A., & Honeycutt, R. K. 1997, PASP, 109, 441
- Hoard et al. (2002) Hoard, D.W., Wachter, S., Lee Clark, L., & Bowers, T .P. 2002, ApJ, 565, 511
- Howell, Herzog & Robson (1996) Howell, S. B., Herzog, A., Robson, I. 1996, AJ, 111, 899
- Hutchings et al. (2001) Hutchings, J. B., Crampton, D., Cowley, A. P., Schmidtke, P. C., & Fullerton, A. W. 2001, AJ, 122, 1572
- Ivanova & Taam (2003) Ivanova, N., & Taam, R., E., 2003, ApJ, 598, in press
- Jameson et al. (1987) Jameson, R. F., King, A. R., Bode, M. F., & Evans, A. 1987, The Observatory, 107, 72
- Johnson (1966) Johnson, H. J. 1996, ARA&A, 4, 193
- Jones & Puetter (1993) Jones, B., & Puetter, R. C., 1993, Proc. SPIE, 1946, 620
- Kahabka & van den Heuvel (1997) Kahabka, P., & van den Heuvel, E. P. J., 1997, ARA&A, 35, 69
- Kardashev (1962) Kardashev, N. S. 1962, Astr. Zh., 39, 393
- Krisciunas et al. (1987) Krisciunas, K., et al. 1987, PASP, 99, 887
- van der Laan (1966) van der Laan, H. 1966, Nature, 211, 1131
- Landolt (1992) Landolt, A. U. 1992, AJ, 104, 340.
- Littlefair et al. (2001) Littlefair, S. P., Dhillon, V. S., Marsh, T. R., & Harlaftis, E. T. 2001, MNRAS, 327, 475
- Matthews & Soifer (1994) Matthews, K., & Soifer, B. T. 1994, in Infrared Astronomy with Arrays: the Next Generation, ed. I. McLean (Dordrecht: Kluwer), 239
- McArthur et al. (1999) McArthur, B. E. et al. 1999, ApJ, 520, L59
- Misselt (1996) Misselt, K. A. 1996, PASP, 108, 146.
- Mouchet et al. (2003) Mouchet, M. et al. 2003, A&A, 401, 1071
- Panagia & Felli (1975) Panagia, N. & Felli, M. 1975, A&A, 39, 1
- Patterson, Richman & Kemp (1998) Patterson, J., Richman, H., & Kemp, J. 1998, PASP, 110, 404
- Persson et al. (1998) Persson, S. E., Murphy, D. C., Krzeminski, W., Roth, M., & Rieke, M. J. 1998, AJ, 116, 2475
- Piché & Szkody (1989) Piché, F., Szkody, P. 1989, AJ, 98, 2225
- Pringle (1991) Pringle, J. E. 1991, MNRAS, 248, 754
- Quaintrell & Fender (1998) Quaintrell, H., & Fender, R. P., 1998, A&A, 335, L17
- Ritter & Kolb (1998) Ritter, H., & Kolb, U. 1998, A&AS, 129, 83
- Robinson (1973) Robinson, E. L. 1973, ApJ, 186, 347
- Robinson, Shetrone & Africano (1991) Robinson, E. L., Shetrone, M. D., & Africano, J. L. 1991, AJ, 102, 1176
- Rucinski (1985) Rucinski, S.M., 1985, AJ, 90, 2321
- Sargent & Beckwith (1987) Sargent, A. I., & Beckwith, S. 1987, ApJ, 323, 294
- Schreiber & Gänsicke (2002) Schreiber, M. R. & Gänsicke, B. T. 2002, A&A, 382, 124
- Schwope, Mantel & Horne (1997) Schwope, A. D., Mantel, K.-H., & Horne, K. 1997, A&A, 319, 894
- Scoville et al. (1986) Scoville, N. Z., Sargent, A. I., Sanders, D. B., Claussen, M. J., Masson, C. R., Lo, K. Y., & Phillips, T. G. 1986, ApJ, 303, 416
- Sepinsky et al. (2002) Sepinsky, J. F., Sion, E. M., Szkody, P., & Gänsicke, B. T. 2002, ApJ, 574, 937
- Skumanich (1972) Skumanich, A. 1972, ApJ, 171, 565
- Smak (1995) Smak, J. 1995, Acta Astronomica, 45, 259
- Smak (1993) Smak, J. 1993, Acta Astronomica, 43, 101
- Smith & Dhillon (1998) Smith, D. A., & Dhillon, V. S. 1998, MNRAS, 301, 767
- Solheim & Sion (1994) Solheim, J.-E., & Sion, E. M. 1994, A&A, 287, 503
- Steeghs et al. (1996) Steeghs D. et al. 1996, MNRAS, 281, 626
- Spruit & Rutten (1998) Spruit, H. C., & Rutten, R. G. M., 1998, MNRAS, 299, 768
- Spruit & Taam (2001) Spruit, H. C., & Taam, R. E. 2001, ApJ, 548, 900
- Szkody (1977) Szkody, P. 1977, ApJ, 217, 140
- Szkody & Mateo (1986) Szkody, P., & Mateo, M. 1986, AJ, 92, 483
- Taam & Spruit (2001) Taam, R. E., & Spruit, H. C. 2001, ApJ, 561, 329
- Taam, Sandquist & Dubus (2003) Taam, R. E., Sandquist, E. L., & Dubus, G. 2003, ApJ, 592, 1124
- Verbunt (1987) Verbunt, F. 1987, A&AS, 71, 339
- Verbunt & Zwaan (1981) Verbunt, F., & Zwaan, C. 1981, A&A, 100, L7
- Webbink (1976) Webbink, R. F. 1976, ApJ, 209, 829
- Wheatley et al. (2003) Wheatley, P. J., Mauche, C. W., & Mattei, J. A. 2003, MNRAS, in press
- Wright & Barlow (1975) Wright, A. E. & Barlow, M. J. 1975, MNRAS, 170, 41