Effects of Helium Phase Separation on the Evolution of Giant Planets
Abstract
We present the first models of Saturn and Jupiter to couple their evolution to both a radiative-atmosphere grid and to high-pressure phase diagrams of hydrogen with helium. The purpose of these models is to quantify the evolutionary effects of helium phase separation in Saturn’s deep interior. We find that prior calculated phase diagrams in which Saturn’s interior reaches a region of predicted helium immiscibility do not allow enough energy release to prolong Saturn’s cooling to its known age and effective temperature. We explore modifications to published phase diagrams that would lead to greater energy release, and find a modified H-He phase diagram that is physically reasonable, leads to the correct extension of Saturn’s cooling, and predicts an atmospheric helium mass fraction in agreement with recent estimates. We then expand our inhomogeneous evolutionary models to show that hypothetical extrasolar giant planets in the 0.15 to 3.0 Jupiter mass range may have s 10-15 K greater than one would predict with models that do not incorporate helium phase separation.
1 Introduction
The interiors of Jupiter and Saturn, extrasolar giant planets (EGPs), and brown dwarfs (BDs) are all described by similar physics: these bodies are mainly composed of liquid metallic hydrogen, and their interior energy transport mainly occurs through efficient convection Hubbard et al. (2002), leading to largely isentropic interiors. Jupiter and Saturn, whose radius, mass, luminosity, and age are known precisely, can serve as calibrators of thermal-history calculations for the entire class of objects. They can provide a test of the adequacy of the diverse physical models, including interior thermodynamics, heat transport mechanisms, and model-atmosphere grid, that enter into the general thermal-history theory for EGPs and BDs. However, at very low effective temperatures ( 100 K), the corresponding interior temperatures may become low enough for phase separation of abundant interior components to occur, and this effect must be quantitatively evaluated before Jupiter and Saturn can be used as calibrators. This work provides a quantitative assessment of inhomogeneous evolution in Jupiter, Saturn, and low-mass EGPs.
Relevant calculations and data for Jupiter and Saturn follow:
-
•
Saturn is currently over 50% more luminous than one would predict with a homogeneous, adiabatic cooling model. Saturn models reach the planet’s known of 95.0 K in only 2.0 to 2.5 Gyr Fortney & Hubbard (2003).
-
•
For Jupiter, homogeneous, adiabatic cooling models allow Jupiter to reach its known of 124.4 K in 4.7 Gyr. This is a good match.
- •
2 Hydrogen and Helium under High Pressure
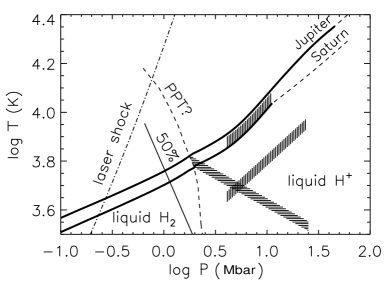
Under extreme pressure dense molecular hydrogen dissociates and ionizes to become liquid metallic hydrogen. The transition is likely continuous over a pressure of 1-5 Mbar at the temperatures of interest ( K) in giant planets. Also at these temperatures, helium, which makes up about 8% of the atoms in a solar composition mixture, likely becomes immiscible in liquid metallic hydrogen Stevenson (1975); Hubbard & Dewitt (1985); Pfaffenzeller et al. (1995). Figure 1 shows the interior temperature-pressure profile of Jupiter and Saturn superimposed on a hydrogen phase diagram.
Detailed calculations on the dynamics and distribution of helium in giant planets have been performed Stevenson & Salpeter (1977b). These authors found that when helium becomes immiscible in liquid metallic hydrogen, the composition that separates out is essentially pure helium, and this helium on fairly short timescales (relative to the convective timescale) will coalesce to form helium droplets. These droplets, being denser than the surrounding liquid metallic hydrogen, will fall through the planet’s gravitational field. If the droplets reach a region where helium is again miscible at higher concentration, they will redissolve, enriching the deeper regions of the planet in helium. Helium would be lost from regions with pressures lower than the pressures in the immiscibility region, since the planet is fully convective up to the atmosphere. Excess helium would be mixed down to the immiscibility region and be lost to deeper layers. This “helium rain” could be a substantial additional energy source for giant planets.
3 Calculations
We find that the calculated phase diagram of HDW Hubbard & Dewitt (1985), which is essentially equivalent to that of Stevenson Stevenson (1975), are inapplicable to the interiors of giant planets, if helium phase separation is Saturn’s only additional energy source. As Figure 2 shows, this phase diagram prolongs Saturn’s cooling 0.8 Gyr, even in the most favorable circumstance that all energy liberated is available to be radiated, and does not instead go into heating the planet’s deep interior. As we show in our published work Fortney & Hubbard (2003), we find that a modified version of the phase diagram of Pfaffenzeller et al. Pfaffenzeller et al. (1995), with a higher temperature for the onset of helium immiscibility (see Figure 1), allows Saturn to reach its known and age, while Jupiter evolves homogeneously until 5 Gyr. Saturn’s falls to 0.185 at 4.5 Gyr, which is at the low end of Saturn’s derived value Conrath & Gautier (2000).

This modified phase diagram can be applied to various hypothetical giant planets Fortney & Hubbard (2004). We follow the evolution of planets with masses from 0.15 (1/2 Saturn’s mass) to 3.0 . Figure 3 shows the evolution of these planets with and without the effects of helium phase separation. These planets are in isolation and possess 10 cores. At Gyr ages the model planets undergoing phase separation can have s 10-15 K higher than the homogeneous models, making the planets somewhat easier to detect.

References
- Hubbard et al. (2002) Hubbard, W. B., Burrows, A., & Lunine, J. I. 2002, Ann Rev of Astronomy & Astrophyics, 40, 103
- Fortney & Hubbard (2003) Fortney, J. J. & Hubbard, W. B. 2003, Icarus, 164, 228
- von Zahn et al. (1998) von Zahn, U., Hunten, D. M., & Lehmacher, G. 1998, Journal of Geophysical Research, 103, 22815
- Conrath & Gautier (2000) Conrath, B. J. & Gautier, D. 2000, Icarus, 144, 124
- Stevenson (1975) Stevenson, D. J. 1975, Physical Review B, 12, 3999
- Hubbard & Dewitt (1985) Hubbard, W. B. & Dewitt, H. E. 1985, Astrophysical Journal, 290, 388
- Pfaffenzeller et al. (1995) Pfaffenzeller, O., Hohl, D., & Ballone, P. 1995, Physical Review Letters, 74, 2599
- Stevenson & Salpeter (1977b) Stevenson, D. J. & Salpeter, E. E. 1977b, Astrophysical Journal Supplemental, 35, 239
- Fortney & Hubbard (2004) Fortney, J. J. & Hubbard, W. B. 2004, Astrophysical Journal, submitted