The Ionized Gas in Local Starburst Galaxies:
Global and Small–Scale Feedback from Star Formation.11affiliation: Based on observations obtained with the NASA/ESA
Hubble Space Telescope at the Space Telescope Science Institute, which
is operated by the Association of Universities for Research in
Astronomy, Inc., under NASA contract NAS5-26555.
Abstract
The small– and intermediate–scale structure and the fraction of the ISM ionized by non–radiative processes is investigated in a small sample of four local starburst galaxies, imaged with the Hubble Space Telescope Wide Field and Planetary Camera 2. The sample comprises three dwarf galaxies, NGC3077, NGC4214, and NGC5253, and one giant spiral, NGC5236 (M83). The galaxies span a range in metallicity (0.2–2 Z⊙), luminosity (M17 – 20), and environment (isolated, interacting), enabling the investigation of non–radiative ionization processes in a variety of galactic conditions. For this purpose, the four galaxies were imaged in the lines of H(4861 Å), [OIII](5007 Å), H(6563 Å), and [SII](6717,6731 Å). This is a unique set of data, as very few galaxies (and only our four starbursts) have ever been imaged by HST in the relatively faint lines of H and [SII]. The use of the HST has allowed us to trace non–photoionized gas in these galaxies on scales ranging from a few tens of pc to a few hundred pc, and thus provide a full budget for this ionized gas component. Using the ‘maximum starburst line’ of Kewley et al. (2001) to discriminate between photoionized and non–photoionized gas, we find that in all four galaxies non–photoionization processes are responsible for a small fraction of the total H emission, at the level of 3%–4%. Because the non–photoionized gas is associated with low H surface brightness, it occupies between 1/6 and 1/4 of the total imaged area. The central starbursts yield enough mechanical energy to produce the non–photoioned gas in the four galaxies, via shocks from massive star winds and supernova explosions. In particular, the starbursts in the three dwarf galaxies deposit a significant fraction, 70%–100%, of their mechanical energy into the surrounding interstellar medium (ISM), in order to account for the observed luminosity of the non–photoionized gas. The morphology of the non–photoionized regions is different in the dwarfs and the giant spiral. As already established in previous works, non–photoionized gas in dwarfs is mainly associated with extended ‘shells’ or filamentary regions, likely areas of supernova–driven expanding gas. In all three dwarfs star formation has been an ongoing process for the last few107 yr to 108 yr; time–extended star formation episodes are a requirement to sustain the observed luminosity of the non–photoionized gas. In the massive spiral, the non–photoionized gas is concentrated in localized areas surrounded by active star–formation, with no evidence for extended structures on the same (or smaller) spatial scales as (than) the ‘shells’ in the dwarfs. The two H cavities in NGC5236 may be evolved regions within the starburst. This confirms the picture that starbursts remain confined events in massive galaxies, likely due to the deep potential well.
1 Introduction
One missing piece for placing star formation within the broader context of galaxy evolution is the quantification of the feedback mechanisms between galactic–scale star formation and the host galaxy’s interstellar medium (ISM). One of the extant questions is: What are the regulating mechanisms for the production of structures at all scales (associations, rings, bubbles, superbubbles)? In a star–formation event, stellar winds and supernova explosions from massive stars inject metals and kinetic energy into the surrounding ISM. The energy injected may produce gas outflows and, in more extreme cases, superwinds (Heckman, Armus, & Miley, 1990; Cecil, Bland-Hawthorn & Veilleux, 2002), which may act as regulating mechanisms by removing gas from the site of star formation and quenching the star formation itself (Elmegreen, 1992; Meurer et al., 1997). Such feedback mechanisms may have strong influence on the evolution of dwarf galaxies (Dekel & Silk, 1986; Marconi, Matteucci & Tosi, 1994), although the exact details of the process are still uncertain and depend on the nature/geometry of the galaxy (De Young & Heckman, 1994; Mac Low & Ferrara, 1999). OB associations will drive ionization and shock fronts through the ISM that may in some cases cause the star formation to propagate spatially (Elmegreen & Lada, 1977; McCray & Kafatos, 1987; Puxley, Doyon & Ward, 1997).
Adding pieces to the puzzle requires exploring the feedback mechanisms on all scales, from the 100–1000 pc scales of superbubbles and outflows/superwinds down to the 10 pc scales typical of the interfaces between the massive stars and the ionization and shock fronts. While the former has received the most attention in the past years because of its macroscopic effects on the host galaxy’s ISM (Heckman, Armus, & Miley, 1990; Martin, 1998; Cecil, Bland-Hawthorn & Veilleux, 2002), the latter has been so far only coarsely explored (Martin, 1997; Calzetti et al., 1999), despite its key role for understanding the large scale processes. In this paper, we employ Hubble Space Telescope high angular–resolution images of nearby starburst galaxies to investigate the role of non–radiative ionization processes within and around sites of star formation. We quantify the amount of non–photoionized gas present in the starburst regions of these galaxies, investigate the influence of external environmental factors on the gas properties/structure, and relate the gas morphology to that of the young stellar populations.
Throughout the paper, we define as ‘photoionized’ the gas ionized by radiative processes, and as ‘non–photoionized’ the gas ionized by any other mechanism. There are a number of processes other than radiative that can produce observable ionized gas in galaxies. Shocks, and their precursors, from supernovae and massive star winds (Shull & McKee, 1979; Allen et al., 1999) are a viable mechanism in the presence of intense star formation. Alternative mechanisms are turbulent mixing layers (Slavin, Shull, & Begelman, 1993) and changes in the gas temperature. The latter has been invoked to explain the observed forbidden line ratios in galaxy haloes, at scale heights from 1 kpc to 5–6 kpc above the galactic plane of the Milky Way and other quiescently star–forming galaxies (Rand, 1998; Haffner, Reynolds & Tufte, 1999; Otte & Dettmar, 1999; Otte, Gallagher & Reynolds, 2002). The present analysis will not enable us to unambiguously discriminate between different non–photoionization processes; we will tend to privilege the mechanical input from supernovae and massive star winds, thus shocks, as the simplest mechanism for driving non–photoionization and producing the observed morphology and scale (a few 100 pc to kpc) of the non–photoionized gas in the starburst galaxies (Martin, 1997, 1998)). A more detailed justification for this choice is given in section 6.1.
One result of this study is that the non–photoionized gas represents a small fraction, about 3%–4%, and possibly up to 10%–20% depending on the assumptions, of the integrated emission line spectrum in the starbursts. Thus, the presence of non–photoionized gas will have small or negligible effect on the interpretation of diagnostics of distant galaxies. However, even such small fraction is key for tracing the location and morphology of possible large–scale shock structures in spatially resolved data. These structures indicate whether and where large amounts of mechanical energy are being deposited in the interstellar medium, and where larger-scale phenomena (e.g., superwinds) may start.
The sample consists of four starburst galaxies closer than 5 Mpc, that we imaged in the light of hydrogen and metal forbidden line emission. The basic characteristics of the four galaxies are listed in Table 1. Three of the galaxies, NGC3077, NGC4214, and NGC5253, are dwarf irregulars (M109 M⊙), with similar blue magnitudes, although with different metallicities and infrared–to–blue ratios. NGC4214 is a blue, relatively low–extinction, low–metallicity, and isolated galaxy. NGC5253 is likely in interaction with NGC5236 (M83); although NGC5253 is as blue and as metal–poor as NGC4214, it has about 60% more infrared emission than the latter, an indication of its higher dust content or concentration. NGC3077 is a member of the M81 group, forming a triplet together with M81 and M82, and has a metallicity about 5 times higher than the other two dwarfs in the sample, with a value close to solar. NGC5236, the galaxy in likely interaction with NGC5253, is also in our sample, and is a massive (M1011 M⊙), grand–design, barred spiral, seen almost face–on.
The present paper is organized as follows. Section 2 provides a brief description of the four galaxies in the sample. Section 3 describes the observations and the data reduction, with emphasis on the derivation of emission–line images. Section 4 presents the derivation of the line ratio images. Section 5 describes how non–photoionized gas is discriminated from photoionized gas and presents the main findings of this work. Section 6 discusses the results and section 7 summarizes them.
2 Sample’s Description
2.1 NGC 5253
NGC5253 is a benchmark starburst with centrally concentrated star formation superimposed on an older, quiescent stellar population. The galaxy is possibly in interaction with NGC5236, given the small radial (500 kpc) and projected (130 kpc) distance between the two (Thim et al., 2003). A close encounter between the two galaxies about 1 Gyr ago was first proposed by van den Bergh (1980) on the basis of various evidence, including the warping of the HI disk of NGC5236 (Rogstad, Lockart & Wright, 1974). NGC5253 is at the same time a strong UV and FIR emitter because the starburst’s spectral energy distribution is very blue, but is also crossed by dust lanes that produce patchy obscuration (Kinney et al., 1993; Telesco et al., 1993; Calzetti et al., 1997). Radio observations indicate that a large fraction of the most recent star formation is hidden by dust (Turner, Ho & Beck, 1998; Turner, Beck & Ho, 2000). The main E–W dust lane is also the location where weak CO emission has been detected; the lane has been suggested to be the funnel of accretion of unprocessed gas that is feeding the central starburst (Turner, Beck & Hurt, 1997; Meier, Turner & Beck, 2002). Gas ionization is centrally concentrated in this galaxy (Martin & Kennicutt, 1995; Calzetti et al., 1997, 1999), and dominated in the optical by a 1–2 Myr old, and possibly younger, super-star-cluster candidate heavily extincted by dust (Calzetti et al., 1997; Crowther et al., 1999; Tremonti et al., 2001). This super-star-cluster candidate may be coincident with the brightest infrared source in the galaxy, as the two are only slightly displaced from each other, about 5 pc in projection (Turner et al., 2003). Gorjian, Turner & Beck (2001) place the age of the super-star-cluster candidate at no more than a few hundreds of thousand years, based on its infrared properties. The UV–detected stellar clusters are systematically younger than 20 Myr (Tremonti et al., 2001; Harris et al., 2003), and are distributed amid a typically older, UV–bright, diffuse stellar population spread across the central 350 pc (Meurer et al., 1995; Calzetti et al., 1997). The characteristics of the cluster and diffuse populations suggest that the clusters may be dissolving into the diffuse population on timescales of a few tens of Myr, due to tidal disruption, similar to what has been found in the center of the Milky Way (Tremonti et al., 2001). The velocity structure of the ionized gas becomes disturbed beyond 200 pc radius from the center, with velocity gradients of 10–30 km s-1, possibly a tracer of slowly expanding gas (Martin & Kennicutt, 1995). Ground–based images show that gas ionized by mechanisms other than photoionization is present at least between 560 pc and 1.4 kpc distance from the galaxy center (Calzetti et al., 1999). This is in agreement with the presence of two kpc–size superbubbles in the periphery of the ionized gas emission, roughly along the major and minor axis, respectively, one of which expanding with v35 km s-1 (Marlowe et al., 1995).
2.2 NGC 5236 (M 83)
The central region of the massive, metal–rich spiral NGC5236 is the site of a powerful starburst, although star formation is active across the entire body of the galaxy, along the spiral arms. The central starburst occupies a region about 400 pc across, and is bright at all wavelengths, from the X-ray to the radio (e.g., Ehle et al., 1998; Kinney et al., 1993; Rouan et al., 1996; Telesco et al., 1993; Turner & Ho, 1994). Two peaks of CO emission, detected at the insertion points of the main stellar bar onto the outer circumnuclear ring (Petitpas & Wilson, 1998; Elmegreen, Chromey & Warren, 1998; Israel & Baas, 2001), suggest a picture in which the starburst is fueled by gas inflow along the main stellar bar, collecting at the inner Lindblad resonance (see, however, Regan & Teuben (2003)). In addition, a central minibar connecting the outer circumnuclear ring to the inner circumnuclear ring may provide a further channel for the gas to fuel the starburst (Elmegreen, Chromey & Warren, 1998). The large amount of dust extinction, as inferred from infrared data (Gallais et al., 1991; Rouan et al., 1996) and from the large infrared–to–blue ratio, is highly inhomogeneous, and multiple dust lanes criss–cross the central region of the galaxy, alternating heavily obscured with relatively unobscured regions. The population of UV–bright clusters in the galaxy center has a mean age peaked around 5–7 Myr, and is distributed along the inner circumnuclear ring, in the shape of a semi–circular ringlet between 50 pc and 130 pc from the optical nucleus. Clusters younger than 5 Myr are located at the edges of the ringlet, suggesting an outward propagation of star formation, but also propagation from the southern area of the ringlet towards the north (Harris et al., 2001; Puxley, Doyon & Ward, 1997). Ground–based narrow–band imaging of the center of the galaxy shows that the distribution of the H emission follows closely that of the blue stars and that photoionization is the predominant ionization mechanism (Calzetti et al., 1999); however, the coarse angular resolution of the ground–based images (1′′.330 pc) has prevented establishing whether small–scale non–photoionized regions are present within/around the starburst site.
2.3 NGC 4214
NGC4214 is a blue, low–metallicity, Wolf–Rayet Magellanic irregular (Sargent & Filippenko, 1991; Kobulnicky & Skillman, 1996). The low extinction values measured from optical spectroscopy (Maiz-Apellániz et al., 1998), together with the low infrared–to–blue ratio, point consistently to a low dust content in the center of this galaxy. Star formation is mainly active in two large complexes, altogether spanning a size of 900 pc, more than twice the size of the central site of star formation in NGC5253. A few additional distinct actively star–forming regions are also present in the central area of the galaxy, along the main bar (Maiz-Apellániz et al., 1998). Multiwavelength observations indicate that star formation may have started a few times 107 yr ago in this region (Huchra et al., 1983). NGC4214 shows a large variety of young (10 Myr) star forming complexes, from obscured, filled compact HII regions to relatively unobscured, shell-like extended regions, which MacKenty et al. (2000) interpret as an evolutionary/aging trend. The brightest UV stellar knot in the starburst (NGC4214–1) is relatively young, only 4–5 Myr old; it is located at the southern edge of an H cavity, and is likely to be density bounded (Leitherer et al., 1996). Several shells of expanding gas surround the main sites of star formation, with velocities between 30 km s-1 and 100 km s-1 (Martin, 1998).
2.4 NGC 3077
The gravitational interaction with M81 and M82 (Cottrell, 1976; van der Hulst, 1979; Yun, Ho & Lo, 1994) is the likely trigger of the starburst in the center of NGC3077. The HI morphology of this galaxy is heavily disrupted by the interaction, with an extended tidal arm to the east of NGC3077 that contains about 90% of the atomic gas of the galaxy and is the site of a massive molecular complex (van der Hulst, 1979; Yun, Ho & Lo, 1994; Walter & Heithausen, 1999; Walter et al., 2002). Similarly to NGC5253, star formation is centrally concentrated, and its optical morphology is heavily affected by patchy dust extinction. The dusty regions are fairly well traced by a number of CO clouds, and their presence produces an offset between the optical center and the infrared center of the galaxy (Price & Gullixson, 1989; Walter et al., 2002). The bright H core is surrounded by a number of expanding shells with velocities in the range 40–100 km s-1 (Martin, 1998). The starburst hosts a number of stellar clusters covering a fairly large range of ages, mostly 1–100 Myr, with a cluster as old as 300 Myr (Harris et al., 2003). This agrees, as order of magnitude, with the estimates on the time since the last encounter of NGC3077 with M81, that numerical simulations place at a few108 yr ago (Brouillet et al., 1991; Thomasson & Donner, 1993).
3 Observations and Data Reduction
The images used in this work, all obtained with the Wide Field Planetary Camera 2 (WFPC2) on-board the HST, are from a combination of new observations (program IDs 8234 and 9144) and old or archival data (program IDs 6124, 6524 and 6569), obtained during the period May 29, 1995 through July 18, 2001. A summary of the filters and exposure times is given in Table 2. The focus of this work is on the ionized gas as probed by strong emission lines, thus the emphasis will be on the narrow-band filter observations, although observations in the medium/broad-band filters are also briefly discussed (Table 2), as they are used for stellar continuum-subtraction or for comparing the blue stellar population (UV filters) with the gas emission.
A subset of the emission-line data used here have been already presented and discussed in previous papers. Calzetti et al. (1997) use the HST H and H images of NGC 5253 to derive dust reddening maps. MacKenty et al. (2000) discuss the morphology of the H and [OIII] 5007 Å emission in NGC 4214. Harris et al. (2001, 2003) present the HST H images of NGC 5236, NGC 5253 and NGC 3077 for the purpose of constraining the ages of the stellar clusters in those galaxies, and use the reddening maps derived in the present work. The distinguishing characteristic of the present work relative to those previous ones is the study of the interstellar gas ionization mechanisms, rather than the investigation of the stellar population content of the galaxies; thus, previous results will be used only as necessary. We add to previously published datasets images in the narrow-band filters corresponding to the line emission in [SII] 6726,6731 Å (all galaxies), [OIII] 5007 Å (NGC3077, NGC5236, and NGC5253), and H 4861 Å (NGC3077 and NGC4214). Also, although Harris et al. (2001, 2003) presented H images for NGC3077, NGC5236, and NGC5253, these were not discussed in detail. Table 2 gives the full list of narrow- and medium/broad-band imaging for completeness. We performed anew the data reduction and combination of those datasets that had not been previously presented by us, to ensure homogeneity across the full suite of images.
Different programs used slightly different observing strategies, as detailed in Calzetti et al. (1997); MacKenty et al. (2000); Harris et al. (2001, 2003). We briefly recall here those characteristics of relevance to the following analysis. The centers of the four galaxies were imaged in the WF3 chip (8080′′, NGC3077 and NGC5253), in the PC1 chip (3636′′, NGC5236), or straddling mainly the WF2 and WF3 chips (NGC4214). In all cases, the selected WFPC2 chip contains the full central starburst region. In particular, the WF3 or full–WFPC2 FOVs used for the three dwarf galaxies, NGC3077, NGC4214, and NGC5253, subtend between 1.4 kpc and 2 kpc of the central regions, with NGC4214 being probed on the largest spatial scale (column 6 of Table 1). In NGC5236, the PC chip probes less than 1 kpc across the center (column 6 of Table 1), still sufficient to cover the extent of the entire nuclear starburst and surrounding regions.
Program 9144, whose scope was to observe NGC3077 and to complete the narrow-band datasets of NGC 4214 and NGC 5253, was implemented to reproduce as closely as possible the pointings of the pre-existing images. Typical rotations between narrow-band datasets for these galaxies were small, 5o. Images from programs 6124, 6524 and 9144 were dithered by a few pixels among exposures in the same filter, to easily remove hot pixels during the data combination steps. Programs 6569 and 8234 did not employ a similar observing technique, and hot pixels were simply corrected for or flagged using the IRAF/STSDAS task WARMPIX. Flagged data were not used in the analysis. Observations of the emission lines used the same set of four narrow-band filters for all four galaxies, as redshifts are small enough that the lines fall within the filter bandpasses (Table 1). For the V–band continuum, programs 6524, 8234, and 9144 used the medium band filter F547M, as its bandpass excludes emission from strong lines, in particular the [OIII] 5007 Å; program 6569 used the wider F555W filter as V–band continuum, and this case will be treated separately below.
The data, both new and archival, were reduced by the STScI calibration pipeline, via the On-The-Fly-Reprocessing (OTFR, see Baggett et al. (2002)). The OTFR uses the best calibration reference files available at the time of retrieval from the HST Archive; most datasets were retrieved between mid–2001 and early 2002. The calibration pipeline performs basic steps such as flagging of bad pixels, A/D conversion, bias and dark current subtraction, flatfielding. Post-processing steps performed by us included: identification/correction of hot pixels using the task WARMPIX, registration of each galaxy’s dataset to a common position using rotations and linear shifts; cosmic ray rejection, hot pixel rejection (for dithered images), and combination using the IRAF/STSDAS task CRREJ.
Absolute photometric calibrations were applied to the images using the calibration keyword PHOTFLAM included in the image headers. The zeropoint offsets (drifts) discussed in Baggett & Gonzaga (1998) imply small corrections, 3% or less, to our absolute photometry. The effect of contaminant build-up onto the WFPC2 window is small or negligible at the optical wavelengths, but can be significant in the UV. Observations in the most contamination–sensitive filter, F255W, were obtained about 23 days after decontamination, implying an efficiency loss of 11% (Calzetti et al. 1997). For observations in the other filters, most of them obtained within 7 days of decontamination, corrections are smaller, typically 1–2% or less, with only the F336W (NGC4214) needing as much as a 3.8% correction.
Charge Transfer Efficiency (CTE) corrections can in principle be severe in the narrow–band filters, where background and source counts tend to be low (Whitmore, Heyer & Casertano, 1999; Dolphin, 2000). In our case, the problem is partially mitigated by the fact that the ‘background’ is represented by the smooth galaxy’s stellar population, as all our sample galaxies fill the WF or PC apertures. In the specific case of NGC4214, the pointing location was specifically chosen to minimize CTE problems. In order to evaluate the impact of CTE on our emission line measurements, we examine the case of the F487N and F502N images of NGC5236. These images/galaxy combinations are chosen because of the low CCD efficiency in the blue, of the high-angular resolution of the observations (PC chip), and of the low observed H and [OIII] 5007 Å surface brightnesses. All these facts combine up to make the galaxy background (0.55 DN/pix in F487N and 0.84 DN/pix in F502N) and source counts some of the lowest in our sample. Thus, this case represents a reasonable upper limit to the impact of CTE corrections in our images. Using the formulae of Whitmore, Heyer & Casertano (1999), the loss in signal at the leading readout edge (the West side of the galaxy) is about 15% and 13% in F487N and F502N, respectively; the loss at the trailing edge is expected to be negligible, as our sources are extended (Riess, 2000). The line emission is more concentrated than the stellar continuum emission, and the leading edge is almost exclusively continuum; the faint line emission at this edge will be excluded by our sensitivity cuts in the final images. A few pixels inside the leading edge, the ‘background’ is already as high as 3 DN/pix, which implies a CTE loss of about 7%–8% and 5%–6% in F487N and F502N, respectively, for a typical source of 40 DN. To avoid undersubtracting the stellar continuum, we privilege the continuum levels at the trailing edge when performing the subtraction in the narrow–band filters (see below). Although CTE is a systematic error, we quote the combined ‘loss’ in the F487N and F502N filters, about 10%, as part of our random uncertainty when discussing the [OIII]/H ratios, because of the difficulty of controlling continuum subtration at that level of accuracy.
A 44 pixel area in the F555W images of NGC4214 corresponding to knot I-As ((J2000)=12:15:39.441, (J2000)=36:19:34.99, MacKenty et al. (2000)) is saturated. The F555W image is used for the subtraction of the stellar continuum from the F502N and F487N line filters. Uncorrected saturation leads to undersubtraction of the continuum and overestimate of the line strength in the saturated region. In the following analysis of emission lines in NGC4214, the small saturated area will be neglected. In NGC5253, the pixel corresponding to the peak of the F656N emission ((J2000)=13:39:56.016, (J2000)=31:38:25.05, Calzetti et al. (1997)) is saturated even in the shortest exposure. Although Calzetti et al. (1997) attempts at correcting for the saturation in this pixel, we will ignore it in the following analysis.
Finally, all images were binned by 3x3 pixels (0′′.32 for NGC3077, NGC4214, and NGC5253, and 0′′.142 for NGC5236), to smooth out small registration shifts between images. The final bin size corresponds to a physical scale between 3 pc and 5.8 pc, depending on the galaxy and the chip used (column 7 of Table 1). This scale is comparable or larger than the typical half–light radii of young stellar clusters in starbursts (Meurer et al., 1995; Calzetti et al., 1997), but smaller than the typical diameters of HII regions, these being in the range 50–300 pc (Oey et al. (2003) and references therein); thus, the binning still preserves high enough spatial detail to investigate small–scale ionization characteristics.
3.1 Derivation of the Emission Line Images
3.1.1 Subtraction of the Stellar Continuum
The most delicate post-processing step in the present work is the subtraction of the stellar continuum from the narrow–band images to produce emission–line–only images. This step is particularly tricky for the H and [OIII] images of NGC3077 and NGC5236, owing to the unfavorable combination of weak lines (due to the high metallicities and large dust reddening in the galaxies, Table 1), and low detector quantum efficiency of the WFPC2 at blue wavelengths (Biretta et al., 2002). For these two galaxies, as well as for NGC5253, we verified the correcteness of the continuum subtraction by comparing the WFPC2 line fluxes with the fluxes measured from the large–aperture spectra of McQuade, Calzetti & Kinney (1995) and Storchi-Bergmann, Kinney & Challis (1995).
The nebular emission lines contributing to the flux in each of the four narrow–band filters are listed in column 2 of Table 2. Basically, each narrow–band filter is targeting a single major emission line, with the exception of F656N, which includes both H and [NII]. The subtraction of the [NII] contribution from the F656N flux will be discussed at length in section 3.1.2. No additional nebular lines are expected to provide major contributions to the total flux in the filters.
For NGC5253, stellar continuum images at the central wavelengths of the narrow–band filters were obtained by linear interpolation/extrapolation from the continuum F547M and F814W images (Calzetti et al., 1997). Re-scaling factors of 10% or less were then applied to the continuum images to match the intensity of stars in the narrow–band filters. The linear extrapolation of continuum images could not be applied to NGC3077 and NGC5236, because of the significant small-scale color variations of the stellar populations. For these two galaxies, re-scaled F547M and F814W frames were directly applied as continuum images to the F487N and F502N images and to the F656N and F673N images, respectively; re-scaling factors were again selected to match the intensity of stars in the narrow–band frames. In NGC4214, the F555W filter contains contributions from the [OIII] 5007 Å and the H emission; the first line is located on the blue side of the filter’s transmission curve, at 77% of the peak, while the second line is in the red wing, at 13% of transmission peak. A recursive technique, conceptually similar to that described in MacKenty et al. (2000), is used to recover a pure stellar continuum image by iterative subtraction of the F502N and F656N images from the F555W image. The pure–stellar F555W image and the F814W image were then linearly interpolated/extrapolated to create the stellar continuum images at the appropriate wavelengths for the narrow band filters.
The continuum–subtracted fluxes in the narrow–band images were compared with fluxes from ground–based spectra for NGC3077, NGC5236, and NGC5253 (McQuade, Calzetti & Kinney, 1995; Storchi-Bergmann, Kinney & Challis, 1995). The WFPC2 images were rotated to the standard N–E position, and the flux contained in an aperture corresponding to the spectral aperture was measured. The ground–based spectra were convolved with the WFPC2 narrow–band filter’s spectral response, and continuum–subtracted. Line fluxes agree within typically 10% between images and spectra for H, and H, and within 15% for [SII]. Discrepancies between images and spectral measurements are generally in the same direction for all lines in each galaxy, in the sense that for each galaxy the line fluxes from images will be either systematically higher or systematically lower than the fluxes from spectra. This characteristic greatly mitigates discrepancies, for the purpose of analyzing line ratios (e.g., [OIII]/H or [SII]/H). For the [OIII] line, agreement between imaging and spectroscopy fluxes is more variable, possibly owing to the large range of metallicities (and thus, of [OIII] strength) covered by our galaxies. In the low–metallicity, strong [OIII] emission galaxy NGC5253 the agreement between images and spectra is about 12%, which we consider good enough for our purposes. In the high–metallicity, weak [OIII] emission galaxies NGC3077 and NGC5236, the [OIII] line fluxes in the images are about 30% and almost a factor of 2 higher, respectively, than the same lines in the spectra. Because of their intrinsic weakeness, measurements of the spectroscopic [OIII] lines in these two galaxies are highly uncertain, and this may account for part of the discrepancy. Attempts to bring the [OIII] fluxes in the NGC3077 and NGC5236 images into better agreement with the spectroscopic fluxes, e.g., by increasing the amount of stellar continuum subtracted from the narrow–band image, have not been successful. The product is an obviously oversubtracted line image. The line images adopted in the analysis are those corresponding to the subtraction of the maximum continumm that does not produce obvious oversubtraction.
The continuum–subtracted narrow–band images were then corrected for the throughput values of the filter transmission curves at the observed wavelength of the emission lines (Table 3). Only in the case of the [OIII] and H emission in NGC5236 are these corrections as high as 10% and 22.5%, respectively, substantially more than the few percent values that characterize all the other cases. NGC5236 is the galaxy with the highest redshift in our sample, and the [OIII] and H lines fall close to the red wing of the filters. Such a large correction induces also a larger uncertainty in the final fluxes, that will be folded in the subsequent analysis.
To further test the correcteness of our continuum subtraction in the case of NGC5236, we checked the [OIII]/H and [SII]/H ratios measured from our images against the small–aperture spectroscopic results of Dufour et al. (1980) (for H, we first subtracted the [NII] contribution, see next section). These authors targeted the nucleus and a number of HII regions in the galaxy; the line ratios we measure for the photoionized regions in the center of NGC5236 are consistent with those authors’ nuclear values.
In the case of NGC4214, we compared our H[NII] and [OIII] line photometry with the published values of MacKenty et al. (2000) for their Regions I and II. To prevent biases in the results from differences in the centering of the apertures, we performed the comparison using only the large apertures listed in Table 2 of MacKenty et al. (2000), all of them with radius 10′′ or larger. For both lines, our values are 26%–28% systematically lower than MacKenty et al. (2000)’s values, independently of the Region used. Since the data come from the same original images (Table 2), a possible explanation for the discrepancy is that we have performed a more stringent subtraction of the underlying continuum than those authors.
To verify that such discrepancy does not impact our conclusions on NGC4214, the [OIII]/H and [SII]/H line ratios from our images were compared with the spectroscopic ratios of Martin (1997) and Maiz-Apellániz et al. (1998). Our line ratios occupy, indeed, similar loci in the [OIII]/H–versus–[SII]/H and [SII]/H–versus–H intensity planes as those from Martin (1997) and Maiz-Apellániz et al. (1998), after accounting for differences in spatial resolution and depth between the images and the spectra. Thus, our line emission images of NGC4214 can be considered adequate for the purpose of the following analysis.
3.1.2 Subtraction of the [NII] Emission Line
The contribution of the [NII] 6548 Å (plus [NII] 6584 Å in NGC3077) to the F656N images has been removed using two different assumptions: (1) that the values measured from the large-aperture spectroscopy are a good representation of the average ([NII]H); (2) that the [SII] line emission map is a good tracer of the [NII] ([NII][SII]). The second assumption stems from one main reason: the ratio [NII]/[SII] has been observed to remain relatively constant, with variations of a factor of 2 or less, in the diffuse ionized gas of a number of galaxy haloes (Rand, 1998; Haffner, Reynolds & Tufte, 1999; Otte & Dettmar, 1999; Otte, Gallagher & Reynolds, 2002), far less than the variation of [NII]/H. The fact that [NII]/[SII] is relatively constant compared to [NII]/H is due to two factors: (a) the lower dependence of [NII]/[SII] on abundance and (b) the lower sensitivity of [NII]/[SII] to the ionization properties of the extreme UV radiation field (Kewley & Dopita, 2002). Thus, the assumption of a constant [NII]/H ratio is an over-simplification, which may impact the H flux determinations in low–excitation regions, where the [NII]/H ratios are expected to be high. We discuss here both methods as a way to bracket extremes in the line ratio values, and evaluate their impact on our conclusions.
The first assumption for the [NII]-subtraction is of straightforward application to our data. For NGC4214, for which we do not have a large-aperture optical spectrum, we have adopted the same [NII]/H ratio as in NGC5253; this is justified by the similar metallicity and ionization conditions of the two galaxies (Table 1 and section 4). Table 3 reports the fractional contribution of [NII] to the F656N flux for each galaxy, as calculated from the large aperture spectra. The only case in which the [NII] correction to the F656N images is significantly above a few percent is NGC5236, owing to its high metallicity. NGC3077 is also an above–solar metallicity galaxy, with [NII]/H0.33; however, because of the low redshift of the galaxy, the two [NII] lines fall in the wings of the F656N filter, providing a very small contribution to the total flux.
For the second [NII]-subtraction assumption, we have generated ‘[NII]’ images that are proportional to the [SII] images, with the proportionality constant derived from the ground–based spectra of McQuade, Calzetti & Kinney (1995) and Storchi-Bergmann, Kinney & Challis (1995). New H emission line maps have then been created after subtraction from the F656N images of the ‘[NII] images’. The difference between these H images and those created under the first assumption is rather small, 2%, for NGC4214 and NGC5253, and 3.5% for NGC3077. It is, however, significant in NGC5236, where differences up to a factor 2.8 in the H fluxes of the low–ionization regions are observed between the two methods. In the following, we adopt the H maps obtained from the [NII][SII] assumption as our default, but recall the H from the [NII]H assumption whenever relevant to bracket the parameters’ range in NGC5236.
Once H–‘only’ emission line images have been created, the H and H fluxes are corrected for the effects of the underlying stellar absorption, in order to fully recover the nebular fluxes. The weak H is more affected than H by this problem, but the images of both lines have been corrected. We have adopted a value of EWEWabs,Hβ=2 Å for our galaxies (McCall, Rybski, & Shields, 1985), which is representative of the values measured in HII regions and starburst galaxies (McCall, Rybski, & Shields, 1985; Storchi-Bergmann, Calzetti & Kinney, 1994). The correction is performed as follows. The emission line images are divided by the appropriate stellar continuum image to create images of the line equivalent width (EW), for all bins above a 5 threshold. The bin values in each EW image are then increased by 2 Å , and new line fluxes are computed based on the revised EWs. The resulting emission line H and H images are used throughout this paper.
4 Line Ratios
Maps of the line ratios [OIII]/H, [SII]/H, and H/H are created for each galaxy from the line images, after selecting only the data above the 5 threshold in each image (Table 3 for a list of the 1 flux levels in each line image). The threshold is chosen so to avoid that our results are dominated by sources of random or systematic error.
The H/H maps are used to apply pixel-by-pixel dust reddening corrections to fluxes, surface brightnesses, luminosities, and the metal line ratios. These corrections are typically small for the metal line ratios, owing to the proximity in wavelength of H to [OIII] and of H to [SII]. For the same reason, our simplistic assumption that the dust is located in a foreground screen is not affecting these line ratios in a measurable way. However, fluxes, surface brightnesses, and luminosities will be more influenced by variations in the dust amount along the line of sight. In particular, global values will be somewhat underestimated, because in regions of high dust content the assumption of foreground dust will provide insufficient corrections, and/or the hydrogen emission lines will be undetected altogether. In what follows, the impact of dust on these quantities and our results will be evaluated on a case-by-case basis.
Line intensity and ratio maps for the four galaxies are shown in Figures 1–4, panels b–d. Figure 5 shows the histograms of the area occupied by different values of the metal line ratios, [OIII]/H and [SII]/H, for each of the four galaxies. The peak in each histogram marks the completeness limit of the line ratio, as verified by the following experiment. Histograms of the [SII]/H line ratios were produced at two different sensitivity thresholds, 5 and 3 ; as expected in the case of a selection effect (completeness limit), the histogram peaks moved to higher values of [SII]/H for the deeper images. As an additional experiment, the sensitivity cut was pushed to lower values by selecting a 3 threshold in images binned by 55 pixels (rather than our adopted 33 pixels bins); the histogram from these deeper images reinforced the trend of the previous ones, thus confirming the selection effect nature of the peaks. Despite this effect, comparisons among the line ratio histograms of the four galaxies are still meaningful, as similar depths are achieved between images of the same emission line (Table 3).
In the case of [SII]/H (Figure 5, left panel), the value of the peak is similar for all four galaxies; this is due to the low sensitivity of the line ratio to metallicity (Figure 6) and to the hardness of the ionizing radiation field (for high ionization parameter values, Martin (1997)). Conversely, in the case of [OIII]/H (Figure 5, right panel) the position of the peak changes from galaxy to galaxy, due to the high sensitivity of this line ratio to the galaxy’s metal content and radiation field’s hardness. For example, for fixed ionizing field and ionization parameter, [SII]/H varies by a factor 6 across the entire metallicity range (Figure 6); in the same conditions, [OIII]/H varies by a factor 150 (Kewley et al., 2001). For fixed metallicity, e.g. 20% the solar oxygen abundance, a decrease of 25% in the effective temperature of the ionizing source produces a change of 30% or less in the [SII]/H ratio, and a far larger decrease, a factor 2.5 or larger, in the [OIII]/H ratio, for ranges of the ionization parameter typical of star–forming regions (, Martin (1997)). The latter example helps explain the case of NGC4214 and NGC5253: the two galaxies have almost identical metallicities but slightly different peaks in the [OIII]/H histogram. Likely, the ionizing sources in NGC5253 are harder, i.e., stars have higher effective temperatures on average, than those in NGC4214. This could be accomplished if photoionization were dominated by somewhat younger (by a few Myr) stars or star clusters in NGC5253 than in NGC4214.
5 Photoionized and Non–Photoionized Regions
5.1 Separating Photoionization from Other Mechanisms
The Baldwin, Phillips & Terlevich (1981) and Veilleux & Osterbrock (1987) diagnostic diagrams provide an excellent means of classifying galaxies according to their excitation mechanism. These diagrams are composed of easily measured line ratios: log([OIII]/H) line ratio on the y-axis against log([NII]/H), log([SII]/H), or log([OI]/H) on the x-axis. Starbursts fall onto the lower left-hand region of these plots, while narrow-line Seyferts are located in the upper right and LINERs lie in the lower right hand zone. The log([SII]/H) ratio has traditionally been used as a diagnostic for shock-excited gas and for the identification of supernova remnants (e.g., Mathewson & Clarke, 1972; Phillips & Cuesta, 1998; Dopita, 1997). Shock models predict that relatively cool high-density regions form behind the shock front and emit strongly in [SII] (Dopita, 1978).
Recently, Kewley et al. (2001) combined stellar population synthesis modeling with the MAPPINGs III photoionization and shock code (Sutherland & Dopita, 1993) to produce starburst grids on the standard optical diagnostic diagrams. These grids were produced for a wide range of metallicities (Z=solar) and ionization parameters (cm/s, where is linked to the nondimensional ionization parameter U by: U=). Using these grids, Kewley et al. (2001) established an upper boundary on the diagrams called the ‘maximum starburst line’. The flux ratios of any object lying above this boundary cannot be modelled by pure starburst models alone. Such ratios require the additional contribution by a harder ionizing source like an AGN or shock excitation. In a sense, the use of this maximum starburst line is conservative because some objects lying to the left and below the line may have a non-negligible component of non-photoionization. Indeed, the mixing line in Kewley et al. (2001) shows that objects lying just to the left of the maximum starburst line in the log([OIII]/H) versus log([SII]/H) diagram may have a contribution of up to 30% of non-photoionization to their emission. On the other hand, the maximum starburst line is useful for our purposes because any point in our sample lying to the right of the maximum starburst line is very likely to be dominated by non–photoionization processes.
Comparisons with shock models confirm the above statement. The locus of shock models by Shull & McKee (1979) is shown in Figure 7, denoted by an ’S’; these models include ionization from both the shock and the photoionized precursor. The photoionized precursor is a region of gas in front of the shock which has been ionized by the radiation field emitted by the high-density gas at the shock front. A similar locus is occupied by the shock models of Allen et al. (1999). This lends support to the fact that points lying above and to the right of the maximum starburst line are likely to be dominated by shock emission or other non–photoionization process. Although the maximum starburst line was derived for discriminating the main ionization mechanisms in ‘whole’ galaxies, we apply it to our spatially–‘resolved’ analysis of the excitation mechanisms within starbursts as a conservative approach to the problem.
Using our data, we have therefore constructed diagnostic diagrams log([OIII]/H) versus log([SII]/H) for each galaxy (Figure 7, where the data points are bins from the line ratio images); photoionization models from Kewley et al. (2001) at the appropriate metallicity for each galaxy are reported in each panel, together with the maximum starburst line.
Despite our conservative approach, both NGC5236 and NGC5253 show clear evidence for the presence of a number of regions dominated by non–photoionization processes (Figure 7), that is, lying above the maximum starburst line. The situation is less clear for NGC4214 and NGC3077, and two considerations should be kept in mind:
-
1.
The 5 flux cut affects the locus of the bins on Figure 7. We show NGC4214 and NGC3077 in Figure 8 with 3 cuts. It is clear that there are more data points in the non–photoionized region of the diagram than there were in Figure 7. This is expected as non–photoionized gas tends to occupy low surface brightness regions. A similar increase in the non–photoionized data points is observed in NGC5253 and NGC5236 when 3 cuts are chosen in their images.
-
2.
The parameter range covered by the data points in Figure 7 is limited by the comparatively shallow [OIII] and H images; in the specific case of NGC3077 and NGC4214, the images are probably not deep enough to extensively probe non–photoionized regions, when using a 5 sensitivity cut. Indeed, the deeper [SII] and H images show that a larger fraction of bins have [SII]/H0.7–0.9 for all four galaxies (e.g., Figure 5, left panel, and Figure 10) than is apparent from the diagnostic diagram of Figure 7; such high ratios are tell–tale signs of non–radiative processes (Shull & McKee, 1979; Veilleux & Osterbrock, 1987; Allen et al., 1999).
For the purpose of our analysis, regions of non–photoionization (Figures 1–4, panels e) are defined to satisfy at least one of the following two conditions: (1) the line ratios in the regions are above/right of the ‘maximum starburst line’ (Figure 7); (2) the [SII]/H ratio is high enough to be compatible with non–photoionization processes (Figure 10).
For NGC5236, we investigate also the impact of the adopted [NII]–subtraction method for the H images on the discrimination between photoionized and non–photoionized regions. Figure 9 shows the effect on the diagnostic diagram of each of the two assumptions: [NII][SII] (the default in all Figures) or [NII]H. The first assumption clearly causes more data bins to be located in the non–photoionized area of the diagnostic diagram. Its main effect on the non–photoionzed regions is to make them more extended, rather than ‘creating’ new ones. In addition, the two assumptions produce nearly identical integrated H fluxes, with the flux from the [NII][SII] assumption being only 2% smaller than with the other assumption; this implies a negligible impact on the integrated luminosities and derived quantities in Table 4. The two methods give similar results in terms of the number and overall morphology of the non–photoionized regions, but other quantities related to those regions, like the H flux, the size, and the areal fraction, do change and, in particular, they decrease in value for the case [NII]H. Although our default assumption, [NII][SII], is the most physically justified (see discussion and references in section 3.1.2), we report in Table 5 also the numbers from the assumption [NII]H, to highlight the differences between the two methods for NGC5236 (see also discussion below).
Non-radiative ionization is typically confined to regions of low H surface brightness, as already observed by other authors for these and other galaxies (Ferguson, Wyse & Gallagher, 1996b; Martin, 1997; Wang, Heckman & Lehnert, 1998; Calzetti et al., 1999; Haffner, Reynolds & Tufte, 1999). Figure 10 shows the distribution of values of [SII]/H as a function of the normalized H surface brightness, /. is defined as the mean surface brightness at the half–light radius (Wang, Heckman & Lehnert (1998) and Table 4). The [SII]/H–versus–H plot show a relatively uniform behaviour across the four galaxies. The photoionized gas, identified by the low–valued [SII]/H, spans the full range of surface brightness in each galaxy (modulo the sensitivity limits of our images), while the non–photoionized gas crowds in the low surface brightness/high [SII]/H locus of the diagram. Conversely, the plot of [OIII]/H as a function of the normalized H surface brightness differs markedly from galaxy to galaxy (Figure 11). In NGC5236, the high H surface brightness regions (HII regions) are characterized by low values of the ratio [OIII]/H, lower than the values found in the low surface brightness areas. The trend is clearly opposite in NGC4214 and NGC5253, where high surface brightness regions have consistently high values of [OIII]/H. The datapoints of NGC3077 show a trend that is in–between those of NGC5236 and NGC4214/NGC5253. At the high end of the H surface brightness (/3), there is a factor 60 or more difference in [OIII]/H values between the four galaxies, showing that the [OIII]/H–versus–H surface brightness plot is heavily affected by the galaxy’s metallicity, with a clear trend going from the metal–rich NGC5236, through NGC3077, down to the metal–poor NGC4214 and NGC5253. At the same time, the plot shows more uniform values at the low surface brightness end (/0.5), where non–photoionized gas is present; here, the [OIII]/H ratio spans a factor less than 5 between the four galaxies.
Under our assumptions, in all four galaxies the fraction of H emission contributed by mechanisms other than photoionization is modest, around 3%–4% (Table 5). In NGC5236, this fraction becomes noticeably lower, about 1%, when the [NII]H assumption, rather than the default [NII][SII], is adopted. In order to extract the largest possible fraction of non–photoionized gas from the images, we use the 3 line ratio images to derive the values reported in Table 5, columns 2–5. If the 5 line ratio images are instead used, the numbers in columns 2–5 of Table 5 for NGC3077, NGC4214, and NGC5253 drop by fractions that range between 30% and 65%, with negligible changes in the case of NGC5236. The use of the 3 images, rather than the 5 ones, is preferred in this case for a more meaningful comparison with predictions from models (see section 6).
Most of the data points for all four galaxies are in the ‘photoionzed gas’ part of the diagnostic diagram (Figure 7). The low–[SII]/H points of NGC4214 and NGC5253 are compatible with the tracks for gas at the measured metallicity (and harder radiation spectrum for NGC5253).
For NGC3077, the low–valued [SII]/H points have lower [OIII]/H than expected from models at the galaxy’s metallicity (left-top panel of Figure 7); a track closer to the observed data points is the one at Z=2 Z⊙, with gas density n=350 cm-3. However, even this track does not fully account for the distribution of the data points in NGC3077, especially those located below the track itself. A starburst population comprising of ionizing stars in a range of evolutionary stages, and a combination of high– and low–ionization components, may account for the dispersion of the datapoints in the low–[OIII]/H/low–[SII]/H part of the diagram (Moy, Rocca-Volmerange & Fioc, 2001). The Z=2 Z⊙, n=350 cm-3 track is located well below the maximum starburst line (Figure 7); if the track itself is used as a boundary to separate photoionized gas (below–left of the track) from non–photoionized gas (top–right of the track) in NGC3077, we get that the H emission of the non–photoionized gas is 26% of the total. This fraction is 6 times higher than what we calculate under the ‘standard’ assumptions above, and it is also over 4 times larger than what the starburst itself can support if all its mechanical energy is used to shock the gas (Table 6). Thus, the distribution of the data points in the [OIII]/H–versus–[SII]/H diagram for NGC3077 appears to be due to a combination of multiple processes, which possibly include the high– and low–ionization components of Moy, Rocca-Volmerange & Fioc (2001), in addition to a non–photoionized component.
In NGC5236 we find an even more extreme behavior than in the case of NGC3077. While the low–[SII]/H points are in the general region of the high–metallicity theoretical tracks for photoionized gas, they do not follow any specific track in this galaxy (top–right panel in Figure 7). The qualitative trend of the data does not change if the H images are corrected for [NII] using the assumption [NII]H, rather than [NII][SII] (Figure 9). One possible interpretation is that, in addition to the presence of a complex age distribution in the starburst stellar population and of regions of low– and high–ionization (Moy, Rocca-Volmerange & Fioc, 2001), non–photoionized processes heavily affect the weak metal line ratios in this metal–rich galaxy (e.g., Martin, 1997). Alternatively, the emission may result from a shock–only component (without a photoionized precursor), as the ones modelled by Allen et al. (1999). This can occur if the shock is propagating into a low density environment like the neutral interstellar medium, or if we are in the presence of low–velocity shocks. Thus, the difference in line emission characteristics between the giant spiral and the three dwarfs may arise from the uniqueness of nuclear environments. If the Z=2 Z⊙, n=350 cm-3 track is again used as a boundary between photoionized gas and non–photoionized gas, the fraction of H emission associated with the non–photoionized component increases to 9%, about three times larger than what derived with our ‘standard’ assumptions. This more extreme scenario is still, although barely, energetically supportable by the current starburst (Table 6). Morphologically, in the more extreme scenario the two regions A and B merge together and region A gets extended along areas of low H surface brightness towards the nucleus of NGC5236.
In summary, even under less restrictive assumptions for the identification of non–photoionized gas, the photoionized gas still accounts for the majority of the H emission, at the level of at least 75% and 90% in NGC3077 and NGC5236, respectively.
Not surprisingly, the geometry of the photoionizing sources is more complex than just a simple central point source, in all four galaxies. This is easily seen in Figure 5, left panel, where the expected trend of areal coverage as a function of [SII]/H is shown for a central point–like source; the line ratio in the case of a central source is a function of the radial distance R from the source itself, [SII]/HR2. In all cases, the observed areal coverage exceeds the prediction from the single central source, clearly showing that the ionizing sources are distributed across the entire starburst region, as already evident from the UV images of the same galaxies (Figures 1–4, panels a, Harris et al. (2001, 2003)). In particular, deviations from the single point-like source geometry happen at radii smaller than 17–36 pc for the four galaxies, where the radii increase from NGC5236, to NGC4214, NGC5253, and NGC3077; this fact is compatible with the presence of multiple ionizing clusters distributed within the starburst region with intracluster distances typical of the sizes of HII regions. Indeed, each ‘transition’ radius is much smaller than the radius of the Stromgën sphere and of the UV half–light radius (Table 4, even after the UV half–light radius is corrected for residual effects of dust obscuration, see section 6.3), the latter confirming the spatially extended nature of the starburst population in each galaxy.
5.2 Morphology of the Non–Photoionized Regions
The morphologies of the non–photoionized regions can offer clues as to the mechanism underlying the observed ionization. Here we review the various structures observed in the four sample galaxies. They show two basic morphologies: cavities or ‘enclosed’ regions and shell (with more or less filamentary structure) regions.
The cavities (e.g., regions A and B in NGC5236, Figure 3, and region As in NGC4214, Figure 2) are areas of low H surface brightness surrounded by actively star–forming knots or regions, the latter with marked high H surface brightness. The radii of the non–photoionized regions range, in our cases, from 20 pc to 50 pc.
The H shells surround the central starburst, and have more or less marked filamentary structure. They often trace the closest edge of more external bubbles or arcs to the central peak of star–formation. In our three dwarf galaxies, these regions are located at a radius of 0.2 kpc from the area of peak star–formation. In NGC3077 and NGC5253, these radii are a factor 2 larger than the H half–light radii (cf. Table 4 with Table 5), and are also larger than the UV half–light radii or the Stromgën radii, even after accounting in the latter for the uncertainties in the filling factor and gas density. In NGC4214, the size of the non–photoionized shell is smaller than both the H and the UV half–light radii.
In NGC5236 there is one additional concentration of non–photoionized gas (region C), located at the periphery of the central starburst, on the southern side. This region appears to coincide with the point of insertion of the main stellar bar onto the outer circumnuclear ring (Elmegreen, Chromey & Warren, 1998). Interestingly, there is no similarly obvious non–photoionization region close to the other insertion point (i.e., close to the other CO region as marked in Figure 3, panel e). Likely, the extinction due to the dust lane that dominates this other area has prevented a detection.
The PC chip image of NGC4214 contains a non–photoionization region with a markedly annular geometry, of physical radius of 40 pc and thickness of 20 pc. This H ring is located in a fairly isolated area, devoid of other H emitting regions and is not surrounded by knots of active star formation, as the other cavities discussed above. It is also located in a region of lower stellar density than the central starburst. Within the ring, the [OIII] emission is more centrally concentrated than the [SII] emission, and the line ratio values are: [SII]/H0.9–1 across the 90 pc covered by the ring; [OIII]/H1–3 within the inner 20 pc radius, with [OIII] undetected on larger scale. The total H luminosity associated with the ring is 4.31037 erg s-1, as measured from our images. We believe this structure to be a candidate supernova remnant located in the outskirts of the starburst in NGC4214, with coordinates (J2000)=12:15:42.436 and (J2000)=36:19:47.34. The measured size, total H luminosity, and line ratios are not untypical of SNRs (e.g., Blair, Kirshner & Chevalier, 1981; Chu & Kennicutt, 1988; Blair & Fesen, 1994). For an inner radius of 20 pc and an adopted shock speed of 100 km s-1, the Sedov-Taylor solution predicts an age of 8104 yr for the candidate SNR (Osterbrock, 1989).
6 Discussion
For three of the four galaxies in our sample, NGC3077, NGC4214, and NGC5253, evidence for the presence of non–photoionized gas had already been found by the spectroscopic and kinematic studies of Martin (1997, 1998). However, because of the limited areal coverage of the spectroscopic study, and of the absence of metal–line information in the kinematic study, those previous works could not quantify the prominence and extent of the non–photoionized gas within the starburst. These limitations are overcome by the present investigation, that combines metal– and hydrogen–line high–resolution imaging data to identify and quantify non–photoionized gas.
The comparable depths reached by the emission line images and the relatively small difference in distance between the four galaxies allow us to compare them in a statistically meanignful fashion.
Despite their different morphologies, there is a common trend in the observed non–photoionized regions; they tend to show up as extended, coherent structures, rather than, for instance, small individual ‘blobs’ as may be expected from multiple, uncorrelated supernova remnants. This suggest that the underlying mechanism responsible for the non–photoionized gas results from collective processes, such as multiple supernova explosions occuring over short timescales in spatially correlated or ‘grouped’ stellar clusters.
In all four of our sample galaxies, the non–photoionization mechanisms are responsible for only a small fraction of the projected H emission, around 3%–4% of the total detected in the WPFC2 images (Table 5). This should be regarded to some extent as a lower limit, because of the conservative approach we have adopted in identifying non–photoionized gas. Regions marked as ‘photoionized’ may still contain a fraction of emission which originates from non–radiative processes and which can substantially increase, e.g., by a factor of a few in our metal–rich galaxies, the H flux fraction associated with non–photoionized gas (section 5.1). The areal coverage of non–photoionized gas in the four galaxies is between 15% and 25% of the total H area, thus much larger than the fraction by flux, as emission due to processes other than photoionization is associated in general with regions of low H surface brightness (Figure 10).
Even making allowances for the fact that our observations may not cover the full extent of the diffuse H emission in the four galaxies, we do not expect the H flux fraction of non–photoionized gas to increase significantly if wider–field observations were employed. The non–photoionized gas is found in regions of low H surface brightness, and including more areal coverage is not expected to increase the overall flux fraction by large amounts (see also the discussion on the ground–based observations of NGC5253 at the end of section 6.1). However, the areal fraction occupied by the non–photoionized gas may increase significantly if wider–field observations were employed.
Not all low H surface brightness regions coincide with non–photoionized areas; notable exceptions are areas of high absorption due to large concentrations of dust. Here the H surface brightness is low because the strong dust absorption prevents an accurate correction of the line and stellar continuum fluxes for its effect.
In this category are the main dust lane in the center of NGC5253 and the gas and stellar ‘holes’ in the center of NGC3077. Where the signal-to-noise is sufficient, the line ratios in these areas are consistent with photoionization of the gas. These high–dust-absorption areas also coincide with the location of the detected CO emission in both NGC3077 and NGC5253 (Walter et al. (2002); Turner, Beck & Hurt (1997); Meier, Turner & Beck (2002); see Figure 1 and Figure 4, panels e). Thus, as expected, CO emission is associated with young regions of star formation, and photoionization of the ISM, while non–photoionization is displaced relative to these regions.
A similar conclusion holds for the CO emission in NGC4214. The H cavity in this galaxy is ‘sandwiched’ between the two main CO peaks detected by Becker et al. (1995) (our Figure 2, panel e); here, too, the CO emission corresponds to an area where photoionization dominates, although, for one of the two peaks, it also corresponds to relatively high H surface brightness. A parallel analysis cannot be performed for the nuclear region of NGC5236, as the two peaks of CO emission (Sofue & Wakamatsu, 1994; Israel & Baas, 2001) are located outside the detected line ratio areas in our images.
6.1 The Energy Balance of the Non–Photoionization Component: The Case for Shock–Ionization
As mentioned in the Introduction, we are favoring ionization from shocks and their precursors as a viable mechanism to produce the non–photoionization component observed in the four galaxies (Martin, 1997). This is different from the mechanisms invoked for the haloes (Rand, 1998; Haffner, Reynolds & Tufte, 1999; Otte & Dettmar, 1999; Otte, Gallagher & Reynolds, 2002) or the diffuse medium of more quiescently star–forming galaxies (Hunter & Gallagher, 1990; Ferguson et al., 1996a), but there are some important differences between these galaxies and our starbursts. The non–photoionized emission in our starburst galaxies is more compact, covering the range 200–1,000 pc, than that in galaxy haloes (1–5 kpc). The typical H surface brightness of the non–photoionized regions discussed in this paper is in the range 510-16–210-14 erg s-1 cm-2 arcsec-2 (Figure 10 and Table 4), or about 20–100 times higher than the typical surface brightness of the diffuse ionized medium in more quiescent galaxies (Wang, Heckman & Lehnert, 1998), and higher by a much larger factor than the DIG emission in galaxy haloes. The half–light radius H surface brightness is also 1–3 orders of magnitude higher in the starbursts than in the more quiescently star–forming galaxies (Wang, Heckman & Lehnert, 1998).
Furthermore, X–ray observations are available from ROSAT, Chandra, or XMM-Newton for all four galaxies (Bi, Arp & Zimmermann, 1994; Martin & Kennicutt, 1995; Strickland & Stevens, 1999; Soria & Wu, 2002; Hartwell et al., 2003), and show presence of extended soft X–ray emission in their centers over the scales of interest (a few tens of arcsecs, up to 1.4′ in NGC4214). In all cases, this extended X–ray component has been attributed to thermal plasma emission from hot, diffuse gas. These arguments provide circumstantial evidence that the mechanism for the non–photoionized component in our starbursts is shock heating, rather than the unkown “extra heating” process invoked for the very dilute ionized gas in galaxy haloes or the diluted photoionization mechanism used to explain the diffuse medium of more normal galaxies.
A basic check needs to be performed to verify whether the current starbursts can provide the mechanical energy output necessary to produce the observed non–photoionized H emission.
The H emission expected as a result of the starburst’s mechanical output, LHα,mech, is derived adopting the Binette, Dopita & Tuohy (1985) prescription: L0.025 Lmech, where Lmech is the mechanical luminosity produced by the starburst. To derive the latter, we adopt the Starburst99 models (Leitherer et al., 1999). In particular, each starburst is assumed to be well described by continuous star formation in the range 10–100 Myr, and Salpeter stellar Initial Mass Function up to 100 M⊙. Each galaxy is matched to the model closest in metallicity value. The number of ionizing photons predicted by the Starburst99 models are rescaled to match the observed photoionized H luminosity (Table 4, after subtraction of the non–photoionized component, see also column 2 of Table 6). The rescaling factors are then used to derive the expected mechanical luminosities Lmech for each starburst, and, finally, the expected LHα,mech and their fraction to the total H luminosity (Table 6). The values of LHα,mech/LHα listed in Table 6 represent therefore the expected fractions of H luminosity that the four starbursts can produce via shocks triggered by massive star winds and supernovae, and should be compared with the observed non–photoionized H luminosity fractions measured from our 3 images (Table 5, column 4). We prefer the use of the 3 images for this part of the analysis, instead of our default 5 images, as higher sensitivity cuts tend to exclude low surface brightness regions, and, therefore, exclude preferentially the non–photoionized areas in the images. A quantification of how much non–photoionization is excluded by the 5 images is given in section 5.1. Therefore, the 3 images can place more stringent constraints on the ability of the current starbursts to sustain the measured LHα,nph.
In all cases, the current starburst can support the observed non–photoionized H luminosities, implying that the mechanical energy input into the ISM from supernovae and high–mass star winds is sufficient to produce the level of non–photoionization observed in all four galaxies, if star formation has been constant over the last few 107 yr. In the case of the massive galaxy NGC5236, a starburst as young as 10 Myr can already account for the observed LHα,nph, and an older starburst could produce even larger mechanical H luminosities. For the three dwarf galaxies, the observed LHα,nph fall closer to the high range of predicted values LHα,mech from models. In the Starburst99 models, the ratio of the mechanical energy output to the number of ionizing photons (and therefore to the photoionized H emission), Lmech/N, reaches a constant value after 3107 yr, for constant star formation. This implies that the starbursts in the three dwarfs need to have produced stars at the same rate as (or higher than) the present one for at least 30 Myr, to account for the observed LHα,nph. This is likely to be the case for our dwarf galaxies (section 6.4). Overall, shocks are a viable mechanism, from an energetic point–of–view, for the observed luminosity of the non–photoionized gas in the center of all four galaxies.
The near–UV emission from the galaxies probes the radiative output from stars more massive than 5 M⊙, and thus can be used as a tracer of the mechanical output from the starburst on timescales of a few hundred million years (with assumptions on the star–formation history), much longer than the ‘instantaneous’ output traced by the H emission. The reddening–corrected near-UV fluxes, luminosities, and corresponding mechanical luminosities of the four galaxies predicted by the Starburst99 models are listed in Table 6.
For all galaxies, LHα,mech derived from the near–UV emission is in very good agreement with the same quantity derived from the photonionized H, despite uncertainties in the dust extinction correction of both the UV and H images (especially in the high–opacity CO regions). To estimate the potential impact of the latter, we consider the cases of NGC5253 and NGC3077. The basic premise is that heavy dust extinction will preferentially affect the central, photoionization–dominated regions of the starbursts.
Dust opacity indicators, such as the UV slope and the infrared-to-UV or infrared-to-blue ratios (Calzetti, 2001), give average UV attenuations A1.1 mag and A1.4 mag, for the starburst regions of NGC5253 and NGC3077, respectively; these are factors 2 and 2.2 higher, respectively, than what we derive directly from our H/H images. Using the same dust diagnostics, the average attenuation at H in the centers of NGC5253 and NGC3077 is a factor 1.4 and 1.8 higher, respectively, than what estimated from our optical images. Even if all the ‘extra’ dust attenuation is associated with the photoionized gas for both galaxies, the revised numbers for the intrinsic LHα and, therefore, for the expected Lmech, provide a LHα,mech luminosity that is at most 6% and 13% of the total measured H luminosity in NGC5253 and NGC3077, respectively. This fraction will decrease if any of the ‘extra’ dust is associated with the non–photoionized regions as well, and will converge to the LHα,mech/LHα values of Table 6 (column 4) in the limiting case of an homogeneous distribution of the ‘extra’ dust among the photoionized and non–photoionized regions.
In summary, the mechanical energy output from the starbursts is sufficient to support the observed LHα,nph as measured in section 5.1 (Table 5). Furthermore, a considerable fraction of this mechanical energy, between 70% and 100% (Table 6), needs to be used.
To support this conclusion, the large–scale H emission (both photoionized and non) needs to be included in the full budget accounting. For this purpose, we combine the present results for NGC5253 with those of Calzetti et al. (1999). Our HST images and their ground–based images probe complementary regions in this galaxy in terms of non–photoionization (the HST images being at higher angular resolution, but shallower than the ground–based images). This implies that the non–photoionized shell in NGC5253 extends from 0.22 kpc all the way to 1.5 kpc from the center of the galaxy. The sum of the non–photoionized H from this work and that of Calzetti et al. gives LHα,nph=1.61039 erg s-1; from that same work, the extinction–corrected H integrated flux is 2.910-11 erg s-1 cm-2, implying LHα,mech=(0.012–0.038) LHα=(0.68–2.10)1039 erg s-1, in good agreement with LHα,nph. Incidentally, even on this extended spatial scale, LHα,nph/L0.03. Therefore, the measured luminosity of the non–photoionized gas is still perfectly supportable by the current starburst. We can expect that a similar argument holds for NGC3077.
6.2 The Nature of the Cavities in NGC5236 and NGC4214
NGC5236, the brightest and most massive galaxy in the sample, is also the only one that does not show evidence for extended H structures associated with non–photoionized gas (Figure 3, panel e). The non–photoionized gas is mainly concentrated in two localized regions surrounded by star-forming areas, except for a sourthen concentration which corresponds to the insertion of the stellar bar into the outer circumnuclear ring (section 5.2). More generally, Calzetti et al. (1999) found, based on ground–based images, that there is little or no evidence for diffuse ionized gas extended beyond the regions occupied by the ionizing stars. Their conclusion is supported by our data. The central starburst in NGC5236 is somewhat more compact than the starbursts in NGC5253 and NGC3077, as inferred from both the H and UV half–light radii (Table 4), and is only 15% more powerful than the starburst in NGC5253 (see the star formation rates in Table 4). If comparable starbursts produce extended gas structures of comparable sizes, we may expect such structures to be located at a distance 200–250 pc from the nucleus of NGC5236 (Table 5). Our PC observations are sensitive enough and sample enough region, 750 pc, to detect extended gas structures in NGC5236, if present (Table 1). However, like Calzetti et al. (1999), we do not detect ionized gas extended beyond the region occupied by the starburst stellar population. Those authors concluded that the absence of an extended ionized gas component is evidence of the gas confinement exerted by the deep potential well in the center of NGC5236. Calzetti et al. (1999) did not detect any non–photoionized gas in the center of the galaxy, probably due to the lower angular resolution of the ground–based images. The fact that we do detect localized non–photoionized gas in NGC5236, while still failing to detect a gas component extended beyond the starburst stellar population, is further support that the starburst in this galaxy is a local event and has little influence on the large–scale galaxy’s ISM.
The H luminosity associated with the non–photoionized gas in the two cavities in NGC5236 is 5.41038 erg s-1 for region A and 1.41038 erg s-1 for region B, accounting for 58% of the total non–photoionized H emission in the center of the galaxy. These fairly large energy requirements imply contributions from multiple supernova explosions. Indeed, they correspond to the input mechanical luminosity of stellar clusters with masses 5.5105 M⊙ and 1.5105 M⊙ for region A and region B, respectively, for a Salpeter IMF in the 1– 100 M⊙ range (Leitherer et al., 1999). For expansion velocities between 50 km s-1 and 100 km s-1, the dynamical age of the cavities comes to 3–7105 yr and 1–2.5105 yr, respectively (Martin, 1998). The dynamical ages of the cavities are thus small relative to stellar evolution times. If those cavities are actually due to mechanical input from a single cluster each, such clusters would be a few times more massive than the current population of young stellar clusters in the center of NGC5236 (Harris et al., 2001), but still within the mass range of young stellar clusters in starburst galaxies (e.g., Chandar et al., 2003). Alternatively, a few clusters in each region could be responsible for the powering of the cavities; the structure of the starburst in this galaxy already provides morphological evidence for young stellar clusters to amass in groups of 2–4 in localized regions of projected size 30–40 pc (Harris et al., 2001). These sizes fit confortably within the area occupied by each of the two cavities.
The well–known central H cavity in NGC4214 (Hunter, 1982; Leitherer et al., 1996) is edged to the south by the brightest H knot in the galaxy. However, the brightest UV cluster, NGC4214-1, does not coincide with the bright H knot, but is located to the NE of it, within the cavity (Leitherer et al., 1996). The diameter of the cavity is 7′′ diameter, or 100 pc; this is about 50% larger than the size of the non–photoionization region detected in our images (diameter70 pc, Table 5). The discrepancy is likely to be physical: the edges of the cavity may be dominated by the photoionization that is induced, possibly, by NGC4214-1. This stellar cluster, at 4–5 Myr of age (Leitherer et al., 1996), is old enough to have experienced the first supernova explosions (that start around 3.5 Myr, Leitherer et al. (1999)), and thus to be the cause of the detected non–photoionized gas within the cavity. The cavity’s dynamical age is 0.4 Myr, adopting the velocity v=70 km s-1 measured in Maiz-Apellániz et al. (1999); the stellar cluster was at most 0.5 Myr younger when the bubble started to form, old enough to have experienced 200–700 supernova explosions. The amount of non–photoionized H associated with the cavity is 3.01037 erg s-1, implying a mechanical luminosity of 1.21039 erg s-1. If the stellar cluster was only 3.5–4.0 Myr old when the cavity started to expand, its required mass to drive the estimated amount of mechanical luminosity is 3.8104 M⊙, for a Salpeter IMF in the 1– 100 M⊙ range. This is about a factor 4–5 lower than the masses estimated by Maiz-Apellániz et al. (1999) and inferred from the 2200 Å luminosity of Leitherer et al. (1996), after rescaling for the different adopted distances for NGC4214. However, our mass estimate is a minimum requirement for producing the observed non–photoionized H luminosity, and cannot account for the fraction of the mechanical energy lost to the rupturing the bubble (Maiz-Apellániz et al., 1999).
6.3 The Shells in the Dwarf Galaxies
Ionized gas taking the form of extended shells with more or less filamentary structure is a common feature of dwarf galaxies (Hunter & Gallagher, 1992, 1997). Such shells are generally around 10 Myr old or younger, with very few cases laying in the range 10–20 Myr (Martin, 1998).
In the case of NGC3077 and NGC4214, the convex edges of the shells are well traced by non–photoionization in our images (Figures 1–2, panel e). For NGC5253, our results are less clear (Figure 4, panel e), but they provide a picture similar to that of the other two galaxies, once combined with the results of Calzetti et al. (1999). Indeed, the inner size of the non–photoionized shell we measure in NGC5253 coincides with the scale at which Martin & Kennicutt (1995) find disturbed velocity structure in the galaxy. In all cases, the shells could be outward starburst–driven shocks (see discussion in section 6.1, and Martin (1998)), if the starbursts have been lasting for more than 30–50 Myr. Interestingly, in all three cases the inner edge of the shell is located at a radius of 0.2 kpc from the center of the starburst.
Another common feature among the three dwarfs is the fact that the high-surface-brightness regions of the H filaments are generally photoionized, in agreement with previous findings (Hunter, 1994; Hunter & Gallagher, 1997), while non–photoionized gas is preferentially located at the inner or outer edges of the filaments. This is especially evident in NGC3077 (Figure 1, panel e). The data thus suggest that the optical emission from shocks, which is relatively faint, dominates when the gas material is moving into low density surroundings, but becomes a small fraction of the total emission when the shock encounters regions of higher gas density, as here the gas emitting from the photodissociation/photoionization edge is likely to dominate. If this is true in general, the only shock emission detected is the one located in low density regions, and is therefore a lower limit to the total shock emission.
Both in NGC3077 and NGC5253, the inner size of the shells of non–photoionization exceeds by 40% the near–UV half-light radius of the stellar population as measured directly from our reddening–corrected data (Tables 4–5). Residual dust obscuration in the UV images will have the effect of yielding measured near–UV half–light radii that are larger that the actual ones, if the dust is centrally concentrated. To quantify this effect, we use the estimates on the UV dust attenuation given in section 6.1. If, for both galaxies, we locate the ‘missing’ UV flux within the measured half–light radii, these would be reduced to 84 pc for NGC3077 and to 110 pc for NGC5253. Thus, under these assumptions, the UV half–light radii become comparable to or smaller than the H half–light radii, suggesting either that the ionizing population dominates in the near–UV or that the non–ionizing UV population is no more extended than the ionizing one. Whatever the explanation, the starbursts are centrally concentrated and are driving non–photoionization fronts located at a minimum distance of roughly twice the extent of the starburst itself, and a maximum (detected) distance of 15 times and 10 times the half–light radius of the starburst, for NGC5253 and NGC3077, respectively (Calzetti et al., 1997; Walter et al., 2002).
In NGC4214, both the H and the U–band half–light radii are larger than the shell’s inner size, which is at variance with what observed in the other two dwarfs. Although contamination of the U–band half–light radius by the underlying galaxy population cannot be excluded, the H half–light radius is not affected by the same problem, excluding measurement biases as the culprit for the larger values. Indeed, the central starburst in this galaxy is intrinsically far more extended than in the other two dwarfs, by about a factor of 2, as it comprises two distinct and large HII complexes. Conversely, the sizes of the shells are very similar to each other in all three dwarfs. An additional difference between NGC4214 and the other two dwarfs is in the ‘strenght’ of the central star formation, in the sense that NGC4214 is a less intense starburst per unit area than the other two (Table 4, column 7). The star formation rate per unit area is 0.74 M⊙ kpc-2 in NGC4214, a factor of about 5 and 17 lower than NGC3077 (3.7 M⊙ kpc-2) and NGC5253 (12.5 M⊙ kpc-2), respectively. For comparison, the SFR per unit area in NGC5236 is 22.4 M⊙ kpc-2. The main source of ‘dilution’ for the NGC4214 starburst is not the overall SFR, which is similar to the other galaxies (Table 4, column 4), but rather its more extended nature.
In NGC4214, our detected non–photoionization shell surrounds only one of the two HII complexes, the northern one (Figure 2, panel e). This is similar to what found by Martin (1998), although with a smaller size than our detected inner edge. If the center of NGC4214 had contained only one HII complex, the northern one, the starburst/shell geometries in all three dwarfs would have been almost indistinguishable.
This fact, together with the roughly constant value of LHα,nph/LHα, seems to suggest that external factors, such as being an isolated or interacting galaxy, have little or no influence on the gas ionization characteristics on the scales we are considering.
6.4 Relating Non–photoionization to the Stellar Populations in the Starbursts
In NGC5236, the two cavities, A and B, of non–photoionized gas may be evolved regions within the starburst. Region B, in particular, is surrounded by young (10 Myr, Figure 12) clusters, as identified and age–dated by Harris et al. (2001). As suggested by these authors, the starburst ringlet in NGC5236, where region B is located, may be experiencing an inside-out propagation, with the the youngest stellar clusters, younger than 4–5 Myr, located further out in the periphery of the central starburst than the 5-7 Myr old clusters. The propagation hypothesis is further strengthened by the consideration that region B is more centrally located within the starburst ringlet than the young clusters, and likely marks an earlier site of star formation. The presence of non–photoionized gas in a localized region removed from the main starburst and its young star cluster component (region C, Figure 12) may be related to the dynamical conditions of that region, rather than to the starburst itself. This is supported by the fact that Region C appears to be in proximity the point of insertion of the main stellar bar onto the outer circumnuclear ring.
Studies of the young stellar population component in NGC5253 and NGC3077 suggest that star formation has been an on-going process for at least 100–300 Myr in the centers of these galaxies (Calzetti et al., 1997; Tremonti et al., 2001; Harris et al., 2003), thus fullfilling the requirement of long star formation durations to provide the mechanical energy necessary to support the observed non–photoionized gas luminosities.
In NGC5253, the UV–bright, diffuse population shows an age spread up to 100–200 Myr (Calzetti et al., 1997), although the UV–detected stellar clusters tend to be younger than 20 Myr (Tremonti et al., 2001; Harris et al., 2003). Stars and clusters younger than 10 Myr are concentrated in an area of 120 pc diameter around the H peak in NGC5253. The shell surrounding the starburst has a dynamical age between 4 Myr (the closest edge to the starburst) and 25 Myr (farthest edge), implying that the starburst has been injecting mechanical energy into the surrounding ISM for at least that long.
In the starburst of NGC3077, the UV–bright stellar clusters span the age range 1–300 Myr, with clusters younger than 10 Myr preferentially located in an area of 150 pc diameter north of and adjacent to the CO complexes (Harris et al., 2003). NGC3077 appears to display similar age–concentration characteristics as NGC5253, with the full UV–bright population occupying a region of 470 pc in size. However, neither here nor in the case of NGC5253, can we discriminate whether the two galaxies are experiencing outside–in star formation, or the older populations have had time to disperse on larger scales than the younger ones. The CO complexes in NGC3077 are presumably the reservoir where the most recent and the future star formation is/will be taking place (Walter et al., 2002). As already remarked in the previous section, the shells of non–photoionization surrounding the starburst in NGC3077 have dynamical ages in the range 2–10 Myr (Martin, 1998), and therefore fit confortably within the age span of the starburst as inferred from the stellar clusters.
The relation between the young stellar populations and the non–photoionization regions is more difficult to infer for NGC4214, for which the only detailed studies pertain to the most recent star formation episode (younger than 5 Myr, Leitherer et al. (1996); Maiz-Apellániz et al. (1998)). The shell detected in our images (Figure 2, panel e) has dynamical age 3 Myr, and other shells reach ages of 10 Myr (Martin, 1998). The multiwavelength study of Huchra et al. (1983) indicates that the on-going star formation event started less than 100 Myr ago, but possibly more than 20 Myr ago. As already mentioned in the previous section, the shell of non–photoionized gas we detect is surrounding only the northern HII complex, while we find no evidence for a similar structure around the southern complex. This supports independent inferences that the southern HII complex is younger than the northern one: Kobulnicky & Skillman (1996) find that the oxygen aboundance in southern complex is about 0.1 dex higher than in the northen one; Maiz-Apellániz et al. (1998) establish from measurements of H equivelent widths that the southern complex is about 0.5 Myr younger than the northern one, and may have not yet experienced supernova explosions; Hartwell et al. (2003) find, from recent X–ray observations, evidence for an extended hot gas component only in coincindence of the northern HII complex, with the sourthen HII complex missing such component.
Overall, we find evidence that a significant fraction, at least 70% to 100% (cf. Table 5, column 3, and Table 6, column 4), of the mechanical energy from starbursts is deposited into the ISM, presumably in the form of relatively large–scale motions, over scales of 200–1,000 pc. This provides a quantification of the feedback mechanism from stellar winds and supernova explosions into the galaxy’s ISM. Such feedback effects have the potential to influence future star formation in the center of the galaxies, via self–regulation and triggering/propagation (Köppen, Theis, & Hensler, 1995; Wada & Norman, 1999, 2001; Chappel & Scalo, 2001). As importantly, the triggering/propagation of star formation as a result of feedback (Wada & Norman, 2001; Chappel & Scalo, 2001) may explain the long star–forming timescales in the centers of NGC5253 and NGC3077. Such timescale are observed to be in the range 100-300 Myr, much longer than the expected duration of a single starburst event (a few tens of Myr, roughly the lifetime of massive stars). The direct triggering of the starbursts, the interaction with the nearby galaxy(ies), happened a few hundred Myr in the past and is not obviously active at present times. Such long timescales for star formation can be accounted for if the mechanical energy we observe being deposited by massive star winds and supernova explosions is effective at triggering subsequent generations of stars in the inhomogeneous ISM of the galaxies (Wada & Norman, 2001).
7 Summary
High–angular resolution imaging from HST has allowed us to investigate the ionization nature of the gas on small– to intermediate–scales (10–1000 pc) of four nearby starburst galaxies. Our main results can be summarized as follows:
-
•
Non–photoionization processes are present in all four of the investigated galaxies. Although presence of non–photoionized gas was already known for the three dwarfs, our images have excluded presence of small–scale non–photoionized gas in two of them, NGC3077 and NGC5253, and have revealed for the first time the presence of localized non–photoionized gas in NGC5236.
-
•
In all cases, the projected, non–photoionized H represents 3%–4% of the total H detected in the images, but covers up to 25% of the H emission by area in our data. Both numbers, the fraction of non–photoionized/photoionized gas by flux and the areal coverage fraction, should be regarded to some extent as a lower limits. For instance, the fraction by flux increases by a factor of a few in the metal–rich galaxies of our sample, if a less conservative approach to separating photoionized from non–photoionized gas is adopted. For the areal coverage fraction, significantly larger numbers could be found by larger field observations. Neverthless, diagnostics of distant galaxies employing nebular emission lines (e.g., to estimate the star formation rates) are unlikely to be significantly affected by the presence of non–photoionization processes, even in the case of starbursts, as such processes have a small impact on the integrated flux.
-
•
The current starburst can energetically sustain the observed level of non–photoionized H, bringing support to the suggestion that shocks and their precursors from massive star winds and supernova explosions are the likely ionizing mechanism.
-
•
In the case of the dwarf galaxies, comparison with models show that the energy balance argument works only if the current level of star formation has been subtained for at least 30 Myr. Studies of stellar populations confirm this to be the case in all three galaxies. The basic implication is that there is strong feedback of the starburst into the ISM, as the former is observed depositing between 70% and 100% of its mechanical energy into the latter over scales of a few hundred pc.
-
•
No such requirement is needed for the giant spiral, where an ongoing starburst triggered 10 Myr ago can still provide enough energy input to account for the observed level of non–photoionization.
-
•
In all four cases, regions of non–photoionzation and CO regions do not coincide spatially. This is further support to the idea that molecular regions host the youngest or future star formation, which has not experienced supernova explosions yet.
-
•
In the three dwarfs non–photoionization is located mainly in large–scale shells, while in NGC5236 it is located in small–scale cavities surrounded by recent star formation. The cavities may mark sites of earlier star formation within the current starburst. No large–scale (200-300 pc) non–photoionization has been identified in the large spiral. Thus, star formation remains a local event, confined by the deep potential well of this massive galaxy.
-
•
The shell/starburst geometries, the shell morphologies, and the non–photoionized/photoionized gas flux ratios are similar among the three dwarf galaxies, suggesting that external factors, such as being isolated or interacting galaxies, have negligible influence on the gas ionization conditions on the few100 pc scale considered.
-
•
In the images of NGC4214 a candidate supernova remnant, removed from the main sites of recent star formation, has been located. This candidate SNR is distinct from the SNR identified by MacKenty et al. (2000).
References
- Allen et al. (1999) Allen, M. G., Dopita, M. A., Tsvetanov, Z. I., & Sutherland, R. S. 1999, ApJ, 511, 686
- Baggett & Gonzaga (1998) Baggett, S., & Gonzaga, S. 1998, STScI Instrument Science Report WFPC2-98-03 (www.stsci.edu/instruments/wfpc2/wfpc2_bib.html)
- Baggett et al. (2002) Baggett, S., et al. 2002, in HST WFPC2 Data Handbook, v. 4.0, ed. B. Mobasher (Baltimore: STScI)
- Baldwin, Phillips & Terlevich (1981) Baldwin, J., Phillips, M., & Terlevich, R. 1981, PASP, 93, 5
- Becker et al. (1995) Becker, R., Henkel, C., Bomans, D.J., & Wilson, T.L. 1995, A&A, 295, 302
- Bi, Arp & Zimmermann (1994) Bi, H.G., Arp, H., & Zimmermann, H.U. 1994, A&A, 282, 386
- Binette, Dopita & Tuohy (1985) Binette, L., Dopita, M.A., & Tuohy, I.R. 1985, ApJ, 297, 476
- Biretta et al. (2002) Biretta, J., Lubin, L., et al. 2002, WFPC2 Instrument Handbook, v. 7.0 (Baltimore:STScI)
- Blair & Fesen (1994) Blair, W.P., & Fesen, R.A. 1994, ApJ, 424, L103
- Blair, Kirshner & Chevalier (1981) Blair, W.P., Kirshner, R.P., & Chevalier, R.A. 1981, ApJ, 247, 879
- Brouillet et al. (1991) Brouillet, N., Baudry, A., Combes, F., Kaufman, M., & Bash, F. 1991, A&A, 242, 35
- Calzetti (2001) Calzetti, D. 2001, PASP, 113, 1449
- Calzetti et al. (1995) Calzetti, D., Bohlin, R.C., Kinney, A.L., Storchi-Bergmann, T., & Heckman, T.M. 1995, ApJ, 443, 136
- Calzetti et al. (1999) Calzetti, D., Conselice, C.J., Gallagher, J.S., & Kinney, A.L. 1999, AJ, 118, 797
- Calzetti, Kinney & Storchi–Bergmann (1994) Calzetti, D., Kinney, A.L., & Storchi–Bergmann, T. 1994, ApJ, 429, 582
- Calzetti et al. (1997) Calzetti, D., Meurer, G.R., Bohlin, R.C., Garnett, D.R., Kinney, A.L., Leitherer, C., & Storchi-Bergmann, T. 1997, AJ, 114, 1834
- Cecil, Bland-Hawthorn & Veilleux (2002) Cecil, G., Bland-Hawthorn, J., & Veilleux, S. 2002, ApJ, 576, 745
- Chandar et al. (2003) Chandar, R., Leitherer, C., Tremonti, C., & Calzetti, D. 2003, ApJ, 586, 939
- Chappel & Scalo (2001) Chappel, D., & Scalo, J. 2001, MNRAS, 325, 1
- Chu & Kennicutt (1988) Chu, Y.–H., & Kennicutt, R.C., Jr. 1988, AJ, 95, 1111
- Cottrell (1976) Cottrell, G.A. 1976, MNRAS, 174, 455
- Crowther et al. (1999) Crowther, P.A., Beck, S.C., Willis, A.J., Conti, P.S., Morris, P.W., & Sutherland, R.S. 1999, MNRAS, 304, 654
- Dekel & Silk (1986) Dekel, A., & Silk, J. 1986, ApJ, 303, 39
- de Vaucouleurs et al. (1991) de Vaucouleurs, G., de Vaucouleurs, A., Corwin, H.G., Buta, R.J., Paturel, G., & Fouqué, P. 1991, Third Reference Catalogue of Bright Galaxies (New York: Springer-Verlag)
- De Young & Heckman (1994) De Young, D.S., & Heckman, T.M. 1994, ApJ, 431, 598
- Dolphin (2000) Dolphin, A.E. 2000, PASP, 112, 1397
- Dopita (1978) Dopita, M.A. 1978, ApJS, 37, 117
- Dopita (1997) Dopita, M.A. 1997, ApJ, 485, L41
- Dufour et al. (1980) Dufour, R.J., Talbot, R.J. Jr., Jensen, E.B., & Shields, G.A. 1980, ApJ, 236, 119
- Ehle et al. (1998) Ehle, M., Pietsch, W., Beck, R., & Klein, U. 1998, A&A, 329, 39
- Elmegreen (1992) Elmegreen, B. G. 1992, in Star Formation in Stellar Systems, eds. G. Tenorio-Tagle, M. Prieto, F. Sánchez (Cambridge: Cambridge University Press), 383
- Elmegreen, Chromey & Warren (1998) Elmegreen, D.M., Chromey, F.R., & Warren, A.R. 1998, AJ, 116, 2834
- Elmegreen & Lada (1977) Elmegreen, B.G., & Lada, C.J. 1977, ApJ, 214, 725
- Ferguson et al. (1996a) Ferguson, A.M.N., Wyse, R.F.G., Gallagher, J.S., & Hunter, D.A. 1996a, AJ, 111, 2265
- Ferguson, Wyse & Gallagher (1996b) Ferguson, A.M.N., Wyse, R.F.G., & Gallagher, J.S. 1996b, AJ, 112, 2567
- Gallais et al. (1991) Gallais, P., Rouan, D., Lacombe, F., Tiphene, D., & Vauglin, I. 1991, A&A, 243, 309
- Gorjian, Turner & Beck (2001) Gorjian, V., Turner, J.L., & Beck, S.C. 2001, ApJ, 554, L29
- Haffner, Reynolds & Tufte (1999) Haffner, L.M., Reynolds, R.J., & Tufte, S.L. 1999, ApJ, 523, 223
- Harris et al. (2001) Harris, J., Calzetti, D., Gallagher, J.S. III, Smith, D.A., & Conselice, C.J. 2001, AJ, 122, 3046
- Harris et al. (2003) Harris, J., Calzetti, D., Smith, D.A., Gallagher, J.S. III, & Conselice, C.J. 2003, ApJ, submitted
- Hartwell et al. (2003) Hartwell, J.M., Stevens, I.R., Strickland, D.K., Heckman, T.M., & Summers, L.K. 2003, MNRAS, in press (astroph/0311174)
- Heckman, Armus, & Miley (1990) Heckman, T.M., Armus, L., & Miley, G.K. 1990, ApJS, 74, 833
- Helou et al. (1988) Helou, G., Khan, I.R., Malek, L., & Boehmer, L. 1988, ApJS, 68, 151
- Huchra et al. (1983) Huchra, J.P., Geller, M.J., Gallagher, J., Hunter, D., Hartmann, L., Fabbiano, G., & Aaronson, M. 1983, ApJ, 274, 125
- Hunter (1982) Hunter, D.A. 1982, ApJ, 260, 81
- Hunter (1994) Hunter, D.A. 1994, AJ, 107, 565
- Hunter & Gallagher (1990) Hunter, D.A., & Gallagher, J.S. 1990, ApJ, 362, 480
- Hunter & Gallagher (1992) Hunter, D.A., & Gallagher, J.S. 1992, ApJ, 391, L9
- Hunter & Gallagher (1997) Hunter, D.A., & Gallagher, J.S. 1997, ApJ, 475, 65
- Israel & Baas (2001) Isreal, F.P., & Baas, F. 2001, A&A, 371, 433
- Kennicutt (1998) Kennicutt Jr., R.C. 1998, ARA&A, 36, 189
- Kewley & Dopita (2002) Kewley, L.J., & Dopita, M.A. 2002, ApJS, 142, 35
- Kewley et al. (2001) Kewley, L.J., Dopita, M.A., Sutherland, R.S., Heisler, C.A., & Trevena, J. 2001, ApJ, 556, 121
- Kinney et al. (1993) Kinney, A.L., Bohlin, R.C., Calzetti, D., Panagia, N., & Wyse, R.F.G. 1993, ApJS, 86, 5
- Kobulnicky & Skillman (1996) Kobulnicky, H.A., & Skillman, E.D. 1996, ApJ, 471, 211
- Köppen, Theis, & Hensler (1995) Köppen, J., Theis, Ch., & Hensler, G. 1995, A&A, 296, 99
- Leitherer et al. (1996) Leitherer, C., Vacca, W.D., Conti, P.S., Filippenko, A.V., Robert, C., & Sargent, W.L.W. 1996, ApJ, 465, 717
- Leitherer et al. (1999) Leitherer, C., Schaerer, D., Goldader, J.D., González Delgado, R.M., Robert, C., Kune, D.F., de Mello, D.F., Devost, D., & Heckman, T.M. 1999, ApJS, 123, 3
- MacKenty et al. (2000) MacKenty, J.W., Maiz-Apellániz, J., Pickens, C.E., Norman, C.A., & Walborn, N.R. 2000, AJ, 120, 3007
- Mac Low & Ferrara (1999) Mac Low, M.-M., & Ferrara, A. 1999, ApJ, 513, 142
- Maiz-Apellániz, Cieza, & Mackenty (2002) Maiz-Apellániz, J., Cieza, L., & MacKenty, J.W. 2002, AJ, 123, 1307
- Maiz-Apellániz et al. (1998) Maiz-Apellániz, J., Mas-Hesse, J.M., Munõz-Tuñon, C., Vilchez, J.M., & Castañeda, H.O. 1998, A&A, 329, 409
- Maiz-Apellániz et al. (1999) Maiz-Apellániz, J., Munõz-Tuñon, C., Tenorio-Tagle, G., & Mas-Hesse, J.M. 1999, A&A, 343, 64
- Marconi, Matteucci & Tosi (1994) Marconi, G., Matteucci, F., & Tosi, M. 1994, MNRAS, 270, 35
- Marlowe et al. (1995) Marlowe, A.T., Heckman, T.M., Wyse, R.F.G. & Schommer, R. 1995, ApJ, 438, 563
- Martin (1997) Martin, C.L. 1997, ApJ, 491, 561
- Martin (1998) Martin, C.L. 1998, ApJ, 506, 222
- Martin & Kennicutt (1995) Martin, C. L., & Kennicutt, R. C. 1995, ApJ, 447, 171
- Mathewson & Clarke (1972) Mathewson, D.S. & Clarke, J.N. 1972, ApJ, 178, L105
- McCall, Rybski, & Shields (1985) McCall, M. L., Rybski, P. M., & Shields, G. A. 1985, ApJS, 57, 1
- McCray & Kafatos (1987) McCray, R., & Kafatos, M. 1987, ApJ, 317, 190
- McQuade, Calzetti & Kinney (1995) McQuade, K., Calzetti, D., & Kinney, A.L. 1995, ApJS, 97, 331
- Meier, Turner & Beck (2002) Meier, D.S., Turner, J.L., & Beck, S.C. 2002, AJ, 124, 877
- Meurer et al. (1997) Meurer, G.R., Heckman, T.M., Lehnert, M.D., Leitherer, C., & Lowenthal, J. 1997, AJ, 114, 54
- Meurer et al. (1995) Meurer, G.R., Heckman, T.M., Leitherer, C., Kiney, A.L., Robert, C. & Garnett, D.R. 1995, AJ, 110, 2665
- Moy, Rocca-Volmerange & Fioc (2001) Moy, E., Rocca-Volmerange, B., & Fioc, M. 2001, A&A, 365, 347
- Oey et al. (2003) Oey, M.S., Parker, J.S., Mikles, V.J., & Zhang, X. 2003, AJ, in press (astroph/0307230)
- Osterbrock (1989) Osterbrock, D.E., 1989, Astrophysics of Gaseous Nebulae and Active Galactic Nuclei (Mill Valley (CA): University Science Books)
- Otte & Dettmar (1999) Otte, B., & Dettmar, R.-J. 1999, A&A, 343, 705
- Otte, Gallagher & Reynolds (2002) Otte, B., Gallagher, J.S. III, Reynolds, R.J. 2002, ApJ, 572, 823
- Petitpas & Wilson (1998) Petitpas, G.R., & Wilson, C.D. 1998, ApJ, 503, 219
- Phillips & Cuesta (1998) Phillips, J. P., & Cuesta, L. 1998, A&AS, 133, 381
- Price & Gullixson (1989) Price, J.S., & Gullixson, C.A. 1989, ApJ, 337, 658
- Puxley, Doyon & Ward (1997) Puxley, P.J., Doyon, R., & Ward, M.J. 1997, ApJ, 476, 120
- Rand (1998) Rand, R.J. 1998, ApJ, 501, 137
- Regan & Teuben (2003) Regan, M.W., & Teuben, P. 2003, ApJ, 582, 723
- Riess (2000) Riess, A. 2000, STScI Instrument Science Report WFPC2-00-04 (www.stsci.edu/instruments/wfpc2/wfpc2_bib.html)
- Rogstad, Lockart & Wright (1974) Rogstad, D. H., Lockhart, I. A., & Wright, M. C. H. 1974, ApJ, 193, 309
- Rouan et al. (1996) Rouan, D., Tiphene, D., Lacombe, F., Boulade, O., Clavel, J., Gallais, P., Metcalfe, L., Pollock, A., & Siebenmorgen, R. 1996, A&A, 315, L141
- Sakai & Madore (2001) Sakai, S., & madore, B.F. 2001, ApJ, 555, 280
- Sargent & Filippenko (1991) Sangent, W.L.W., & Filippenko, A.V. 1991, AJ, 102, 107
- Schlegel, Finkbeiner & Davis (1998) Schlegel, D.J., Finkbeiner, D.P., & Davis, M. 1998, ApJ, 500, 525
- Shull & McKee (1979) Shull, J.M., & McKee, C.F. 1979, ApJ, 227, 131
- Slavin, Shull, & Begelman (1993) Slavin, J. D., Shull, J. M., & Begelman, M. C. 1993, ApJ, 407, 83
- Sofue & Wakamatsu (1994) Sofue, Y., & Wakamatsu, K.-I. 1994, AJ, 107, 1018
- Soria & Wu (2002) Soria, R. & Wu, K. 2002, A&A, 384, 99
- Storchi-Bergmann, Calzetti & Kinney (1994) Storchi-Bergmann, T., Calzetti, D., & Kinney, A.L. 1994, ApJ, 429, 572
- Storchi-Bergmann, Kinney & Challis (1995) Storchi-Bergmann, T., Kinney, A.L., & Challis, P. 1995, ApJS, 98, 103
- Strickland & Stevens (1999) Strickland, D.K., & Stevens, I.R. 1999, MNRAS, 306, 43
- Sutherland & Dopita (1993) Sutherland, R.S. & Dopita, M.A. 1993, ApJS, 88, 253
- Telesco et al. (1993) Telesco, C. M., Dressel,. L. L., & Wolstencroft, R. D. 1993, ApJ, 414, 120
- Thim et al. (2003) Thim, F., Tamman, G.A., Saha, A., Dolphin, A., Sandage, A., Tolstoy, E., & Labhardt, L. 2003, ApJ, in press (astroph/0303101)
- Thomasson & Donner (1993) Thomasson, M., & Donner, K.D. 1993, A&A, 272, 153
- Tremonti et al. (2001) Tremonti, C.A., Calzetti, D., Leitherer, C., & Heckman, T.M. 2001, ApJ, 555, 322
- Turner et al. (2003) Turner, J.L., Beck, S.C., Crosthwaite, L.P., Larkin, J.E., McLean, I.S., & Meier, D.S. 2003, Nature, 423, 621
- Turner, Beck & Ho (2000) Turner, J. L., Beck, S. C., & Ho, P.T.P. 2000, ApJ, 532, L109
- Turner, Beck & Hurt (1997) Turner, J. L., Beck, S. C., & Hurt, R. L. 1997, ApJ, 474, L11
- Turner & Ho (1994) Turner, J. L., & Ho, P.T.P. 1994, ApJ, 421, 122
- Turner, Ho & Beck (1998) Turner, J. L., Ho, P.T.P. & Beck, S. C. 1998, AJ, 116, 1212
- van den Bergh (1980) van den Bergh, S. 1980, PASP, 92, 122
- van der Hulst (1979) van der Hulst, J.M. 1979, A&A, 75, 97
- Veilleux & Osterbrock (1987) Veilleux, S., & Osterbrock, D.E. 1987, ApJS, 63, 295
- Wada & Norman (1999) Wada, K., & Norman, C.A. 1999, ApJ, 516, L13
- Wada & Norman (2001) Wada, K., & Norman, C.A. 2001, ApJ, 547, 172
- Walter & Heithausen (1999) Walter, F. & heithausen, A. 1999, ApJ, 519, L69
- Walter et al. (2002) Walter, F., Weiss, A., Martin, C., & Scoville, N. 2002, AJ, 123, 225
- Wang, Heckman & Lehnert (1998) Wang, J., Heckman, T.M., & Lehnert, M.D. 1998, ApJ, 509, 93
- Whitmore, Heyer & Casertano (1999) Whitmore, B., Heyer, I., & Casertano, S. 1999, PASP, 111, 1559
- Yun, Ho & Lo (1994) Yun, M.S., Ho, P.T.P., & Lo, K.Y. 1994, Nature, 372, 530
- Zaritsky, Kennicutt & Huchra (1994) Zaritsky, D., Kennicutt, R.C., Jr., & Huchra, J.P. 1994, ApJ, 420, 87


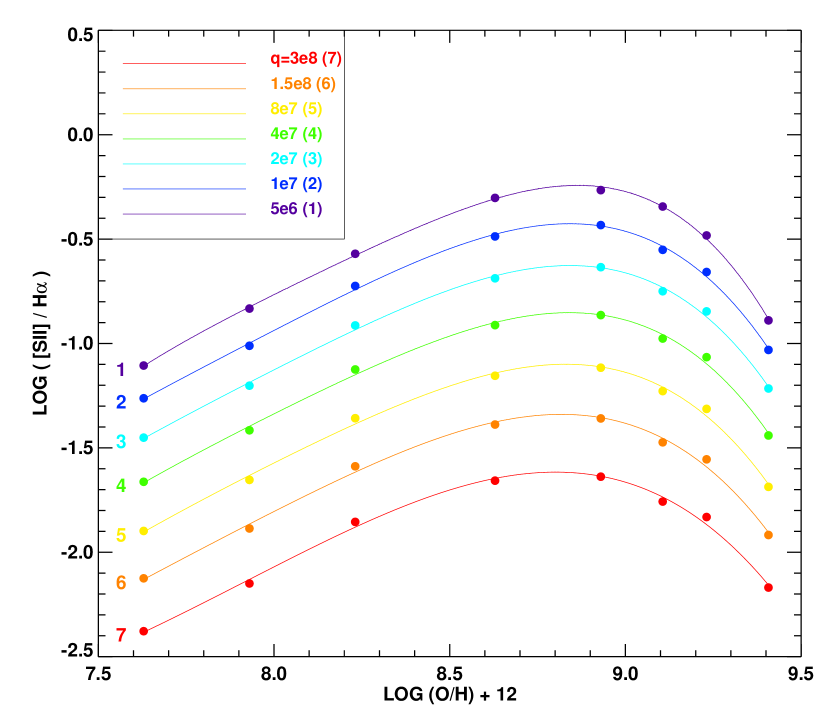
| Galaxy | Morph.aaMorphological types from the RC3 (de Vaucouleurs et al., 1991). | vH | DbbAdopted distances, from Sakai & Madore (2001) (NGC3077), Maiz-Apellániz, Cieza, & Mackenty (2002) (NGC4214), and Thim et al. (2003) (NGC5236 and NGC5253). | dccPhysical size of the galaxy, along the major axis; the major axis is the B=25 mag isophotal diameter from RC3. | SddPhysical size subtended by the relevant WFPC2 chip(s): WF3 for NGC3077 and NGC5253, PC for NGC5236, and the entire WFPC2 FOV for NGC4214. | seePhysical size subtended by three WFPC2 pixels, using the angular scale of the relevant chip for each galaxy: WF for NGC3077, NGC4214, and NGC5253, and PC for NGC5236. | MBffAbsolute B magnitude calculated from B. | E(BV)GggGalactic extinction from Schlegel, Finkbeiner & Davis (1998), as reported in NED. | E(BV)IhhMean internal extinction of the central starburst region, as derived by Calzetti, Kinney & Storchi–Bergmann (1994) and Storchi-Bergmann, Calzetti & Kinney (1994) for the inner 15′′ of NGC3077, NGC5253, and NGC5236, and by Maiz-Apellániz et al. (1998) for the inner 50′′ of NGC4214. | Log(LIR/LB)iiThe infrared-to-blue ratio. LIR is derived from the IRAS fluxes at 60 and 100 using the formula of Helou et al. (1988). LB is the B-band luminosity defined as f(); the flux density f() is from B corrected for Galactic extinction (see column 8 of this Table). | (O/H)jjOxygen abundances, 12log(O/H), from Martin (1997) (NGC4214 and NGC5253), and Zaritsky, Kennicutt & Huchra (1994) (NGC5236). For NGC3077 we used the strong emission lines from the spectrum of McQuade, Calzetti & Kinney (1995) together with the models of Kewley & Dopita (2002) to derive an oxygen abundance of 8.90.1. |
|---|---|---|---|---|---|---|---|---|---|---|---|
| Name | Type | (km/s) | (Mpc) | (kpc) | (kpc) | (pc) | (mag) | (mag) | (mag) | ||
| NGC 3077 | I0 pec | 14 | 3.850.3 | 6.1 | 1.4 | 5.6 | 17.5 | 0.07 | 0.56 | 0.486 | 8.9 |
| NGC 4214 | IAB(s)m | 291 | 2.940.18 | 7.3 | 2.0 | 4.3 | 17.2 | 0.02 | 0.15 | 0.466 | 8.22 |
| NGC 5236 | SAB(s)c | 516 | 4.50.8 | 16.9 | 0.75 | 3.0 | 20.3 | 0.06 | 0.28 | 0.148 | 9.17 |
| NGC 5253 | Im pec | 404 | 4.00.3 | 5.8 | 1.5 | 5.8 | 17.5 | 0.06 | 0.01 | 0.238 | 8.23 |
Note. — Quantities for which a reference is not given are from the NASA Extragalactic Database (NED).
NGC3077 is a member of the M81 cluster, in close interaction with M81 itself and M82. NGC4214 is an isolated dwarf. NGC5236 and NGC5253 are likely an interacting pair.
| Filter | Band | NGC3077aaExposure times are given for individual exposures in each filter/galaxy combination. Observations in each band consist of 2–4 individual exposures. Short exposures in some sets (e.g., 100 s exposures in F555W and F814W of NGC4214) were obtained with the purpose of correcting longer exposures for the effects of saturation, and were not combined with the deeper images. | NGC4214aaExposure times are given for individual exposures in each filter/galaxy combination. Observations in each band consist of 2–4 individual exposures. Short exposures in some sets (e.g., 100 s exposures in F555W and F814W of NGC4214) were obtained with the purpose of correcting longer exposures for the effects of saturation, and were not combined with the deeper images. | NGC5236aaExposure times are given for individual exposures in each filter/galaxy combination. Observations in each band consist of 2–4 individual exposures. Short exposures in some sets (e.g., 100 s exposures in F555W and F814W of NGC4214) were obtained with the purpose of correcting longer exposures for the effects of saturation, and were not combined with the deeper images. | NGC5253aaExposure times are given for individual exposures in each filter/galaxy combination. Observations in each band consist of 2–4 individual exposures. Short exposures in some sets (e.g., 100 s exposures in F555W and F814W of NGC4214) were obtained with the purpose of correcting longer exposures for the effects of saturation, and were not combined with the deeper images. | ||||
|---|---|---|---|---|---|---|---|---|---|
| Prog ID | Exp. time (s) | Prog ID | Exp. time (s) | Prog ID | Exp. time (s) | Prog ID | Exp. time (s) | ||
| F255W | UV | 6124 | 3x700,6x800 | ||||||
| F300W | UV | 9144 | 3x800 | 8234 | 3x700 | ||||
| F336W | UV | 6569 | 260,2x900 | ||||||
| F487N | H | 9144 | 3x700,1300 | 9144 | 2x600,1000 | 8234 | 1000,1100,1200 | 6524 | 1200,3x1300 |
| F502N | [OIII] | ” | 350,600,800 | 6569 | 700,800 | ” | 2x1200 | 9144 | 200,260,600,800 |
| F547M | V | ” | 2x600 | ” | 180,350,400 | 6524 | 2x200,2x600 | ||
| F555W | V | 6569 | 100,2x600 | ||||||
| F656N | H[NII] | 9144 | 300,2x800 | ” | 2x800 | 8234 | 2x600 | 6524 | 2x500,1100,1500 |
| F673N | [SII] | ” | 2x700,1400 | 9144 | 2x600,1100 | ” | 2x1200 | 9144 | 2x600,1200 |
| F814W | I | ” | 300,400 | 6569 | 100,2x600 | ” | 160,200,350 | 6524 | 2x180,2x400 |
| Band | NGC3077 | NGC4214 | NGC5236 | NGC5253 | ||||
|---|---|---|---|---|---|---|---|---|
| TcorraaFilter transmission curve correction, in percent, to the emission line flux. The transmission curves for the filters were obtained from the package STSDAS/SYNPHOT. The sense of the correction is to increase the line flux. For H, the correction in percent due to [NII] contamination is indicated in the second line, and this correction decreases the line flux. | 1 LimitbbEmission line 1 detection limit, in units of erg s-1 cm-2 bin-1, where a bin=3x3 pix2, after subtraction of the stellar continuum. | TcorraaFilter transmission curve correction, in percent, to the emission line flux. The transmission curves for the filters were obtained from the package STSDAS/SYNPHOT. The sense of the correction is to increase the line flux. For H, the correction in percent due to [NII] contamination is indicated in the second line, and this correction decreases the line flux. | 1 LimitbbEmission line 1 detection limit, in units of erg s-1 cm-2 bin-1, where a bin=3x3 pix2, after subtraction of the stellar continuum. | TcorraaFilter transmission curve correction, in percent, to the emission line flux. The transmission curves for the filters were obtained from the package STSDAS/SYNPHOT. The sense of the correction is to increase the line flux. For H, the correction in percent due to [NII] contamination is indicated in the second line, and this correction decreases the line flux. | 1 LimitbbEmission line 1 detection limit, in units of erg s-1 cm-2 bin-1, where a bin=3x3 pix2, after subtraction of the stellar continuum. | TcorraaFilter transmission curve correction, in percent, to the emission line flux. The transmission curves for the filters were obtained from the package STSDAS/SYNPHOT. The sense of the correction is to increase the line flux. For H, the correction in percent due to [NII] contamination is indicated in the second line, and this correction decreases the line flux. | 1 LimitbbEmission line 1 detection limit, in units of erg s-1 cm-2 bin-1, where a bin=3x3 pix2, after subtraction of the stellar continuum. | |
| H | 0.2% | 1.34E17 | 1% | 1.62E17 | 1.8% | 1.40E17 | 1.3% | 1.03E17 |
| 1% | 1.95E17 | 0.2% | 1.62E17 | 10% | 1.35E17 | 1.8% | 2.21E17 | |
| H | 1% | 9.14E18 | 7.4% | 7.60E18 | 22.5% | 9.39E18 | 9.3% | 6.75E18 |
| ([NII]-corr.) | 3.7% | 2.4% | 16% | 1.4% | ||||
| 2% | 6.86E18 | 0.5% | 5.91E18 | 1% | 7.11E18 | 0.6% | 7.29E18 | |
| Galaxy | FHαaaH flux in the WFPC2 chip(s) for each galaxy, corrected pixel-by-pixel for underlying stellar absorption and Galactic and internal dust attenuation. | LHαbbH luminosity, derived from the fluxes in the previous column. | SFR | QddNumber of ionizing photons, assuming constant star formation (Leitherer et al., 1999). | RSeeStromgën radii RS=(3Q/4n)(1/3). The left-hand-side value is calculated for a gas density n=100 cm-3 and a filling factor =0.05; the right-hand-side value for n=40 cm-3 and =0.1 (Martin, 1997). In both cases, =2.610-13 cm3 s-1 (Osterbrock, 1989). | ffH surface brightness, calculated from the total H flux divided by the area of the half–light radius. | RΣggH half–light radius. | RNUVhhNear–UV half–light radius. The near–UV information comes at different wavelengths for different galaxies (Table 2). Some additional caveats: insufficient dust corrections (expected to be important in NGC3077, NGC5236, and NGC5253), which tend to be larger towards the centers of the galaxies, and contributions from a population underlying the starburst (expected to affect NGC4214, which is measured in a U filter, rather than a near–UV filter) may artificially cause the UV radii to be larger than the actual starburst’s size. |
|---|---|---|---|---|---|---|---|---|
| Name | (erg s-1 cm-2) | (erg s-1) | (M⊙ yr-1) | (ph s-1) | (pc) | (erg s-1 cm-2 arcsec-2) | (pc) | (pc) |
| NGC3077 | 5.41E12 | 9.6E39 | 0.076 | 7.1E51 | 61, 111 | 2.95E-14 | 101 | 129 |
| NGC4214 | 1.05E11 | 1.1E40 | 0.089 | 8.0E51 | 79, 115 | 5.72E-15 | 245 | 282 |
| NGC5236 | 1.60E11 | 3.9E40 | 0.308 | 2.9E52 | 121, 177 | 1.76E-13 | 83 | 96 |
| NGC5253 | 1.75E11 | 3.4E40 | 0.270 | 2.5E52 | 116, 168 | 9.55E-14 | 104 | 157 |
| Galaxy | FHα,nphaaFlux in H of the gas not ionized by radiative processes, as derived from the 3 line ratio images. For NGC5236, the second number (in parenthesis) is calculated from H images that have been corrected for the [NII] contribution using the assumption [NII]H, rather than the default[NII][SII] (see discussion in section 5.1). | LHα,nphbbLuminosity in H of the non–photoionized gas. For the numbers in parenthesis, see note (a). | LHα,nph/LHαccFraction of the total H luminosity associated with non–photoionization processes. For the numbers in parenthesis, see note (a). | Anph/A | RshelleeCharacteristic radius of the non–photoionized regions with shell and/or filamentary morphology surrounding the central starburst. The listed figures refer to the inner edge of the ‘shells’, as the size of the outer edge is dictated by the sensitivity limit of our images. In the case of NGC4214, the ‘shell’ of diffuse non–photoionized gas appears to trace the edges of Region A of Martin (1998). | RcavityffCharacteristic radius of the non–photoionized regions with morphology of ‘cavities’ or enclosed regions. In the case of NGC4214, the first number refers to region As; the second number is the size of the candidate supernova remnant in the PC chip. In the case of NGC5236, the first number refers region A and the second to region B. For the numbers in parenthesis, see note (a). |
|---|---|---|---|---|---|---|
| Name | (erg s-1 cm-2) | (erg s-1) | (pc) | (pc) | ||
| NGC3077 | 2.33E13 | 4.1E38 | 0.043 | 0.24 | 179 | … |
| NGC4214 | 4.31E13 | 4.5E38 | 0.041 | 0.21 | 215 | 35, 43 |
| NGC5236 | 4.82(1.92)E13 | 1.2(0.5)E39 | 0.030(0.012) | 0.16(0.07) | … | 56, 21 (45, 13) |
| NGC5253 | 5.60E13 | 1.1E39 | 0.032 | 0.18 | 221 | … |
| Galaxy | LHαaaH luminosity within the relevant WFPC2 chip(s), reported from column 3 of Table 4. | LmechbbMechanical luminosity as derived from the LHα due to photoionization (previous column) and the models of Leitherer et al. (1999). The range in values of Lmech corresponds to the age range 107–108 yr of the stellar populations, adopting a Salpeter IMF to 100 M⊙; for each galaxy, the available models with the closest metallicity value are considered. For continuous star formation models the ratio of mechanical luminosity to number of ionizing photons, Lmech/N (and thus Lmech/LHα), levels off and become constant after3107 yr. | LHα,mech/LHαccThe predicted fraction of H luminosity due to non–photoionization processes. LHα,mech is derived from the photoionized H flux, adopting a 2.5% fraction of the mechanical energy radiated in the H line (Binette, Dopita & Tuohy, 1985). These numbers should be compared with the measurements of column 4 in Table 5. | FNUVddNear–UV flux in the relevant WFPC2 chip(s) for each galaxy, corrected for Galactic foreground extinction and pixel–by–pixel internal dust attenuation (for the latter, using the formula of Calzetti (2001)). None of the FNUV values has been corrected for total absorption, i.e., the fraction of the near–UV fluxes completely absorbed by dust. The near–UV passband is different for different galaxies (see Table 2): F255W has pivot wavelength 2600 Å, F300W has pivot wavelength 2990 Å, and F336W has pivot wavelength 3340 Å (Biretta et al., 2002). | LNUVeeNear–UV luminosity, derived from the fluxes in the previous column. | LmechffMechanical luminosity, derived from the near–UV luminosity and the same stellar population model from Starburst99 (Leitherer et al., 1999) used for the H luminosity above. | LHα,mech/LHαggThe predicted fraction of H luminosity due to non–photoionization processes. LHα,mech is derived from the number in the previous column. As before, we adopt a 2.5% fraction of the mechanical energy radiated in the H line (Binette, Dopita & Tuohy, 1985). These numbers should be compared with the predictions of column 4 in this Table and the measurements of column 4 in Table 5. |
|---|---|---|---|---|---|---|---|
| Name | (erg s-1) | (erg s-1) | (erg s-1 cm-2 Å-1) | (erg s-1 Å-1) | (erg s-1) | ||
| NGC3077 | 9.6E39 | (0.85–2.3)E40 | 0.022–0.060 | 8.7E14 | 1.5E38 | (1.4–2.3)E40 | 0.038–0.058 |
| NGC4214 | 1.1E40 | (0.51–1.67)E40 | 0.012–0.038 | 1.4E13 | 1.5E38 | (1.1–2.2)E40 | 0.025–0.051 |
| NGC5236 | 3.9E40 | (6.1–11.7)E40 | 0.038–0.074 | 2.9E13 | 7.1E38 | (9.9–13.6)E40 | 0.061–0.087 |
| NGC5253 | 3.4E40 | (1.6–5.1)E40 | 0.012–0.038 | 2.5E13 | 4.9E38 | (2.2–4.5)E40 | 0.016–0.032 |