11email: caccia, paola, braito, rdc, tommaso, anna@brera.mi.astro.it 22institutetext: Dipartimento di Astronomia, Università di Padova, Vicolo dell’Osservatorio 2, I-35122, Padova, Italy 33institutetext: Instituto de Fisica de Cantabria (CSIC-UC), Avenida de los Castros, 39005 Santander, Spain
33email: barcons, carreraf@ifca.unican.es 44institutetext: Astrophysikalisches Institut Potsdam (AIP), An der Sternwarte 16, 14482 Potsdam, Germany
44email: ile@xray.mpe.mpg.de 55institutetext: Mullard Space Science Laboratory, University College London, Holmbury St. Mary, Dorking, Surrey, RH5 6NT
55email: mjp@mssl.ucl.ac.uk 66institutetext: X-ray Astronomy Group, Department of Physics and Astronomy, Leicester University, Leicester LE1 7RH, UK
66email: rds@star.le.ac.uk 77institutetext: Centre d’Etude Spatiale des Rayonnements, 9 avenue du Colonel Roche, 31028 Toulouse Cedex 04, France
77email: webb@cesr.fr
The XMM-Newton HBS28 sample: studying the obscuration in hard X-ray selected AGNs ††thanks: Based on observations collected at the European Southern Observatory, La Silla, Chile and on observations obtained with XMM-Newton, an ESA science mission with instruments and contributions directly funded by ESA Member States and the USA (NASA)
This paper presents the analysis of a statistically complete sample of 28 serendipitous X-ray sources selected in 82 pointed XMM-Newton fields down to a count-rate of 0.002 counts s-1 (4.5-7.5 keV energy band). This is the first sample selected in this energy range to have complete spectroscopic identifications and redshift determinations for all the objects. Apart from one Galactic source (an interacting binary), all the objects are AGNs. Their optical and X-ray properties (derived from the spectral analysis of the XMM- EPIC data) are compared together. The good correlation between the optical spectral type and the X-ray absorption properties supports the AGN unified model. Only one object that does not fit the relation between optical and X-ray absorption is found, namely a Seyfert 1.9 with no evidence of obscuration in the X-ray band (N1.31020 cm-2). In total, 7 sources out of 27 are heavily obscured in the X-ray (N1022 cm-2), corresponding to a surface density of 0.7 deg-2 at the flux limit the sample (4-710-14 erg s-1 cm-2 in the 4.5-7.5 keV energy band). Among these obscured objects, two sources show a large (intrinsic) luminosity (L1044 erg s-1) and are thus classified as type 2 QSO. Finally, we have compared the fraction of X-ray absorbed AGNs (26%) with that predicted by the current XRB synthesis models at the flux limit of the survey. We find that the models significantly (90% confidence level) over predict the fraction of absorbed AGNs thus confirming also in this hard energy band (4.5-7.5 keV) similar results recently obtained in the 2-10 keV band.
Key Words.:
galaxies: active - X-rays: galaxies - X-rays: diffuse background1 Introduction
Over 80% of the cosmic X-ray background (XRB) has been recently resolved in the 2-10 keV energy range by deep Chandra and XMM-Newton observations (Mushotzky et al. 2000; Hasinger et al. 2001; Brandt et al. 2001; Rosati et al. 2002; Moretti et al. 2003). Its spectrum can be successfully reproduced by a combination of obscured and unobscured AGNs (Setti & Woltjer 1989; Madau, Ghisellini & Fabian 1994; Comastri et al. 1995; Comastri et al. 2001; Gilli, Salvati & Hasinger 2001; Ueda et al. 2003). The obscured AGNs, in particular, play a key role in the XRB synthesis models since they are expected to make up a significant fraction of the population in hard X-ray energies (see Fabian 2003 and references therein). On the contrary, only a small fraction of absorbed AGNs is found in soft X-ray surveys even at the faintest fluxes (e.g. 15% in the ROSAT Ultra Deep Survey, Lehmann et al. 2001).
Many important issues related to this population are still to be understood, like the number of type 2 QSO, the relationship between optical absorption and X–ray obscuration (e.g. Maccacaro, Perola & Elvis 1982; Panessa & Bassani 2002; Risaliti et al. 1999; Maiolino et al., 2001), the evolutionary properties of type 2 AGNs (Gilli, Salvati & Hasinger 2001; Franceschini et al. 2002) and the nature of the “Optically dull X–ray loud galaxies”, firstly discovered from the analysis of Einstein and ROSAT data (e.g. Elvis et al. 1981; Maccacaro et al. 1987; Griffiths et al. 1995; Tananbaum et al. 1997) and more recently found in large number by Chandra and XMM-Newton surveys (Fiore et al., 2000; Barger et al. 2002; Comastri et al. 2002; Severgnini et al. 2003).
Many of these issues can be studied by using hard X-ray surveys with complete spectroscopic information, both in the optical and in the X-rays, to allow a direct comparison between the two bands (e.g. Akiyama et al. 2003; Ueda et al. 2003). In particular, AGN samples selected in the hardest energy band currently reachable with imaging instruments, i.e. the 5-10 keV or 5-8 keV energy band, provide the best starting point for this kind of analysis since they are less affected by obscuration.
However, the sources found in medium-deep surveys are usually so faint in the optical that the completion of the identification process is hard, if not impossible, to achieve. For instance, about 25% of the sources discovered in the Chandra Deep Fields have optical counterparts fainter than R=25 (Giacconi et al. 2002) making the direct redshift estimate very difficult even with the largest optical telescopes currently available. Furthermore, an accurate X-ray spectral analysis is usually not feasible for the faintest sources detected in deep surveys. Bright X-ray surveys, for which a complete spectroscopic identification in the optical is a feasible task and for which the X-ray spectra can be easily collected, thus complement medium and deep surveys.
With this goal in mind, the XMM-Newton Survey Science Centre (SSC)111 The XMM-Newton SSC is an international collaboration appointed by ESA to help the SOC in developing the SAS, to pipe-line process all XMM data and to exploit the XMM-Newton serendipitous detections. See http://xmmssc-www.star.le.ac.uk/ for a description of the SSC activities. is building up a large ( sources) sample of bright (flux limit 10-13 erg cm-2 s-1) serendipitous XMM-Newton sources at high Galactic latitude (), following well defined criteria so as to allow both a detailed study of sources of high individual interest as well as statistical population studies (see Della Ceca et al. 2002; Della Ceca 2002).
The scope of this paper is to present a first complete and representative sub-sample of 28 objects, selected in the 4.5-7.5 keV energy range. Even if small, this sample has the important advantage that a classification based on dedicated optical spectroscopy is available for all the sources. In contrast, recent samples selected in a similar very hard energy band (5-10 keV) using BeppoSAX (Fiore et al. 1999; La Franca et al. 2002) ASCA (Nandra et al. 2003), XMM-Newton (Baldi et al. 2002; Fiore et al. 2003; Mainieri et al. 2002) or Chandra data (e.g. Rosati et al. 2002) are usually characterized by a partial identification level.
In Section 2 the sample is presented while in Section 3 and in Section 4 the optical and the X-ray spectra respectively are discussed. In Section 5 the X-ray and optical properties are compared together while in Section 6 the relative fraction of absorbed versus un-absorbed AGNs is compared to the predictions based on the X-ray background synthesis models. Finally, in Section 7 an estimate of the density of type 2 QSO at the flux limit of the survey is given while in Section 8 we briefly discuss the problem of the X-ray bright Optically Normal Galaxies. Summary and conclusions are presented in Section 9. Throughout this paper H0=65 km s-1 Mpc-1, =0.7 and =0.3 are assumed.
2 The XMM-Newton Bright Serendipitous Source Sample
The XMM-Newton Bright Serendipitous Source (XMM-Newton BSS) sample is an ongoing project aimed at the selection of a statistically complete sample of X-ray sources serendipitously discovered in pointed XMM-Newton observations (see Della Ceca et al. 2002, Della Ceca 2002 for details). The XMM-Newton BSS consists of 2 complementary samples based on the XMM-Newton EPIC-MOS2 data and selected in the 0.5-4.5 keV and in the 4.5-7.5 keV energy range respectively. The reasons for using the MOS2 detector for the definition of the sample have been described in details by Della Ceca et al. (2002). The XMM-Newton BSS will be released to the public community (Della Ceca et al. in prep.) and, when combined with medium and deep X-ray surveys, will allow us to investigate on a wide range of luminosities and redshifts the properties of the sources responsible for the XRB at energies below 10 keV.
2.1 A pilot study: the HBS28 Sample
As a pilot study we have selected a representative sub-sample (the HBS28 sample) in the 4.5–7.5 keV energy range. In particular we have used the XMM-Newton MOS2 fields available to the XMM-Newton SSC until December 2002 and selected according to the criteria described in Della Ceca et al. (2002) and Della Ceca (2002) i.e.:
-
1.
20o
-
2.
Galactic column density (NH) below 1021 cm-2;
-
3.
Exclusion of fields centered on bright and/or extended X-ray targets;
-
4.
Exclusion of fields which suffer from very high background flares;
Moreover, to define the pilot sample reported here we have used only the fields with 5h or 18h. This last constraint, coupled with the 20o criterion, selects an area of sky mostly in the Southern hemisphere.
For the source detection and characterization we have followed the same pipeline processing used for the First XMM-Newton Serendipitous Source Catalogue, which is described in details in http://xmmssc-www.star.le.ac.uk/. The sources are then selected with the following constraints:
-
1.
Count rate (4.5-7.5 keV) 0.002 counts s-1;
-
2.
maximum likelihood 12 in the 4.5-7.5 keV band (corresponding to a probability for a random Poissonian fluctuation to have caused the observed source counts of 610-6);
-
3.
Exclusion of the sources too close to the gaps between the CCDs (see Della Ceca et al., in prep. for more details).
-
4.
Exclusion of the target of the observation and of the sources too close to the edge of the field of view. To this end, we have defined an inner () and an outer () radius which define the portion of each field used to select the sources.
In total, the HBS28 sample contains 28 sources selected in 82 XMM-Newton/ EPIC-MOS2 fields. The complete list of the 82 XMM-Newton fields is reported in Table 1. The count-rate limit of 0.002 counts s-1 corresponds to a nominal flux limit of about 710-14 erg s-1 cm-2 in the 4.5-7.5 keV energy band for a power-law spectrum with a photon index =2. We note, however, that in some object the 4.5-7.5 keV flux computed on the basis of the X-ray spectral analysis (see Section 4) are lower (up to a factor 2) than this formal limit. Therefore, the actual flux limit of the sample is between 4 and 710-14 erg s-1 cm-2.
The total area covered by the HBS28 sample is 9.756 Deg2. The list of 28 sources selected in the sample is presented in Table 2.
| obsid | position (J2000) | t | ri | ro | obsid | position (J2000) | t | rI | ro |
|---|---|---|---|---|---|---|---|---|---|
| (sec) | (′) | (′) | (sec) | (′) | (′) | ||||
| 0125310101 | 00 00 30.4 25 06 43.4 | 19163.6 | 1 | 13 | 0067340101 | 18 55 37.1 46 30 57.6 | 10653.3 | 0 | 11 |
| 0101040101 | 00 06 19.7 +20 12 22.8 | 34046.5 | 8 | 13 | 0081341001 | 19 31 21.7 72 39 13.3 | 15288.1 | 1 | 13 |
| 0127110201 | 00 10 31.2 +10 58 40.7 | 7558.3 | 2 | 13 | 0081340501 | 20 13 30.0 41 47 25.7 | 19196.8 | 0 | 13 |
| 0111000101 | 00 18 33.0 +16 26 08.0 | 31363.7 | 3 | 13 | 0111180201 | 20 40 10.0 00 52 14.7 | 16495.8 | 8 | 13 |
| 0001930101 | 00 26 06.8 +10 41 12.5 | 18033.7 | 1 | 13 | 0111510101 | 20 41 50.9 32 26 19.8 | 15046.1 | 8 | 13 |
| 0050140201 | 00 26 35.9 +17 09 37.8 | 50383.0 | 3 | 13 | 0130720201 | 20 44 09.0 10 43 11.2 | 5312.0 | 8 | 13 |
| 0065770101 | 00 32 47.0 +39 34 33.3 | 7360.3 | 1 | 13 | 0111420101 | 20 45 09.4 31 20 36.6 | 43323.5 | 8 | 13 |
| 0125320701 | 00 50 03.0 52 07 36.7 | 16525.7 | 1 | 13 | 0112600501 | 20 46 20.0 02 48 48.4 | 10550.3 | 8 | 13 |
| 0110890401 | 00 57 20.0 22 23 04.1 | 29743.3 | 8 | 13 | 0083210101 | 20 54 18.8 15 55 38.2 | 10435.5 | 2 | 13 |
| 0112650401 | 01 04 24.0 06 24 10.6 | 23697.1 | 0 | 13 | 0112190601 | 20 56 21.6 04 37 59.4 | 16639.4 | 2 | 13 |
| 0103861601 | 01 05 16.4 58 26 10.4 | 7127.5 | 8 | 13 | 0081340401 | 20 58 27.1 42 38 56.9 | 15002.3 | 1 | 13 |
| 0101040201 | 01 23 46.0 58 48 25.8 | 28995.6 | 8 | 13 | 0041150101 | 21 04 11.1 11 21 40.0 | 38736.2 | 1 | 13 |
| 0109860101 | 01 25 33.4 +01 45 38.2 | 38535.6 | 4 | 13 | 0038540301 | 21 04 40.2 12 20 05.6 | 14698.6 | 2 | 13 |
| 0112600601 | 01 27 32.1 +19 10 32.3 | 3994.4 | 8 | 13 | 0088020201 | 21 27 38.1 44 48 38.5 | 16094.7 | 1 | 13 |
| 0084230301 | 01 31 53.7 13 36 56.4 | 20447.4 | 8 | 13 | 0103060101 | 21 29 12.2 15 38 34.7 | 22042.9 | 3 | 13 |
| 0032140401 | 01 40 12.1 67 48 40.3 | 7611.1 | 0 | 13 | 0109463501 | 21 37 56.5 43 42 19.8 | 7577.7 | 2 | 13 |
| 0093641001 | 01 43 01.7 +13 38 24.4 | 9329.0 | 4 | 13 | 0061940201 | 21 38 07.9 42 36 06.6 | 4868.2 | 1 | 13 |
| 0101640201 | 01 59 50.2 +00 23 46.8 | 7543.7 | 8 | 13 | 0008830101 | 21 40 15.5 23 39 32.1 | 13986.7 | 2 | 13 |
| 0084140101 | 02 08 38.2 +35 23 00.2 | 38003.5 | 2 | 13 | 0103060401 | 21 51 55.9 30 27 43.5 | 24072.9 | 3 | 13 |
| 0112371701 | 02 17 12.4 04 39 04.2 | 20002.1 | 0 | 11 | 0124930201 | 21 58 52.9 30 13 28.8 | 36246.3 | 8 | 13 |
| 0112371001 | 02 18 00.3 04 59 47.8 | 50802.9 | 0 | 11 | 0130920101 | 22 03 09.3 +18 52 27.9 | 16491.3 | 1 | 13 |
| 0112371501 | 02 18 48.3 04 39 02.9 | 6684.6 | 0 | 11 | 0012440301 | 22 05 10.1 01 55 11.2 | 30937.5 | 2 | 13 |
| 0112370301 | 02 19 36.3 04 59 47.7 | 50386.7 | 0 | 11 | 0106660101 | 22 15 31.9 17 44 02.6 | 56911.8 | 1 | 13 |
| 0098810101 | 02 36 12.3 52 19 55.6 | 23451.5 | 2 | 13 | 0009650201 | 22 17 55.4 08 20 58.0 | 21027.5 | 8 | 13 |
| 0075940301 | 02 36 57.9 +24 38 53.7 | 47428.9 | 8 | 13 | 0049340201 | 22 20 45.1 24 40 58.1 | 26842.3 | 6 | 13 |
| 0067190101 | 02 38 19.4 52 11 34.1 | 25628.7 | 3 | 10 | 0018741701 | 22 34 32.9 37 43 48.1 | 7080.3 | 4 | 13 |
| 0111200101 | 02 42 41.1 00 00 53.7 | 35486.8 | 8 | 13 | 0111790101 | 22 35 45.9 26 03 00.4 | 41304.4 | 4 | 13 |
| 0111490401 | 02 48 43.8 +31 06 59.2 | 31030.1 | 8 | 13 | 0103860201 | 22 36 55.9 22 13 10.1 | 8489.9 | 8 | 13 |
| 0056020301 | 02 56 32.8 +00 06 01.7 | 17251.4 | 2 | 13 | 0006810101 | 22 42 39.5 +29 43 35.6 | 7009.4 | 8 | 13 |
| 0041170101 | 03 02 38.5 +00 07 31.9 | 47278.1 | 0 | 13 | 0109070401 | 22 48 41.5 51 09 57.9 | 14722.6 | 8 | 13 |
| 0042340501 | 03 07 03.8 28 40 24.1 | 13285.7 | 4 | 13 | 0112240101 | 22 49 48.3 64 23 11.2 | 30608.4 | 8 | 13 |
| 0122520201 | 03 11 59.3 76 51 53.0 | 28296.4 | 2 | 13 | 0081340901 | 22 51 49.4 17 52 17.0 | 22398.6 | 1 | 13 |
| 0110970101 | 03 13 09.6 55 03 48.4 | 10240.0 | 0 | 13 | 0112910301 | 22 53 58.8 17 33 55.8 | 5301.3 | 8 | 13 |
| 0105660101 | 03 17 56.0 44 14 15.1 | 23151.9 | 6 | 13 | 0112170301 | 23 03 15.8 +08 52 25.9 | 23349.6 | 4 | 13 |
| 0108060501 | 03 32 29.1 27 48 27.1 | 46835.8 | 0 | 13 | 0109130701 | 23 04 43.6 08 41 14.5 | 10615.6 | 8 | 13 |
| 0099010101 | 03 35 27.6 25 44 54.5 | 18777.9 | 8 | 13 | 0033541001 | 23 04 45.0 +03 11 35.6 | 12461.5 | 2 | 13 |
| 0055140101 | 03 39 35.0 35 25 58.1 | 47637.0 | 1 | 11 | 0123900101 | 23 13 58.9 42 43 28.3 | 37401.3 | 6 | 13 |
| 0111970301 | 04 09 07.2 71 17 43.9 | 18741.3 | 8 | 13 | 0109463601 | 23 15 18.7 59 10 31.7 | 5403.6 | 8 | 13 |
| 0112600401 | 04 25 44.2 57 13 34.4 | 7627.3 | 8 | 13 | 0112880301 | 23 31 49.9 +19 56 28.5 | 14318.0 | 3 | 13 |
| 0103861701 | 04 35 17.1 78 01 54.3 | 8010.9 | 8 | 13 | 0093550401 | 23 33 40.0 15 17 12.2 | 22258.0 | 1 | 13 |
| 0112880401 | 04 59 35.4 +01 47 16.0 | 18915.3 | 2 | 13 | 0100241001 | 23 49 40.6 +36 25 30.6 | 8739.0 | 3 | 13 |
column 1: observation ID; column 2: sky position of the center of the field; column 3: MOS2 exposure time (after having removed the time intervals characterized by a high background); column 4: inner radius (see text for details); column 5: outer radius (see text for details).
| name | Observation ID | Gal. NH | CR4.5-7.5keV | EPIC cameras | Notes |
|---|---|---|---|---|---|
| (1020) | (10-3) | ||||
| [cm-2] | [s-1] | ||||
| XBSJ002618.5$+$105019 | 0001930101 | 5.07 | 2.3 | MOS2,MOS1,pn | |
| XBSJ013240.1$-$133307 | 0084230301 | 1.64 | 3.2 | MOS2,MOS1,pn | |
| XBSJ013944.0$-$674909 | 0032140401 | 2.49 | 2.0 | MOS2,MOS1,pn | |
| XBSJ014100.6$-$675328 | 0032140401 | 2.49 | 70.9 | MOS2,MOS1 | a |
| XBSJ015957.5$+$003309 | 0101640201 | 2.59 | 3.8 | MOS2,MOS1,pn | |
| XBSJ021640.7$-$044404 | 0112371701 | 2.42 | 2.1 | MOS2,MOS1,pn | |
| XBSJ021808.3$-$045845 | 0112371001∗ | 2.52 | 2.7 | MOS2,MOS1,pn | |
| XBSJ021817.4$-$045113 | 0112371001∗ | 2.52 | 3.3 | MOS2,MOS1,pn | |
| XBSJ021822.2$-$050615 | 0112371001∗ | 2.52 | 4.5 | MOS2,MOS1,pn | |
| XBSJ023713.5$-$522734 | 0098810101 | 3.28 | 3.2 | MOS2,MOS1,pn | |
| XBSJ030206.8$-$000121 | 0041170101 | 7.16 | 3.1 | MOS2,MOS1,pn | |
| XBSJ030614.1$-$284019 | 0042340501 | 1.36 | 4.6 | MOS2,MOS1 | e |
| XBSJ031015.5$-$765131 | 0122520201 | 8.21 | 4.4 | MOS2,MOS1,pn | |
| XBSJ031146.1$-$550702 | 0110970101 | 2.55 | 5.9 | MOS2,MOS1,pn | |
| XBSJ031859.2$-$441627 | 0105660101 | 2.60 | 2.2 | MOS2,pn | c |
| XBSJ033845.7$-$352253 | 0055140101 | 1.31 | 2.4 | MOS2,MOS1,pn | |
| XBSJ040658.8$-$712457 | 0111970301 | 7.57 | 3.4 | MOS2,MOS1,pn | b |
| XBSJ040758.9$-$712833 | 0111970301 | 7.57 | 5.0 | MOS2,pn | c |
| XBSJ041108.1$-$711341 | 0111970301 | 7.57 | 2.2 | MOS2,MOS1 | a,b |
| XBSJ185613.7$-$462239 | 0067340101 | 5.29 | 8.2 | MOS2,MOS1,pn | |
| XBSJ193248.8$-$723355 | 0081341001 | 5.95 | 4.5 | MOS2,MOS1,pn | |
| XBSJ204043.4$-$004548 | 0111180201 | 6.72 | 3.2 | MOS2,MOS1,pn | |
| XBSJ205635.7$-$044717 | 0112190601 | 4.96 | 2.1 | MOS2,MOS1 | e |
| XBSJ205829.9$-$423634 | 0081340401 | 3.89 | 3.9 | MOS2,MOS1,pn | |
| XBSJ213002.3$-$153414 | 0103060101 | 4.99 | 2.3 | MOS2,MOS1 | d |
| XBSJ213824.0$-$423019 | 0061940201 | 2.68 | 2.5 | MOS2,MOS1 | e |
| XBSJ214041.4$-$234720 | 0008830101 | 3.55 | 3.3 | MOS2,MOS1,pn | |
| XBSJ220601.5$-$015346 | 0012440301 | 6.13 | 2.3 | MOS2,MOS1 | d |
column 1: source name;
column 2: identification number of the corresponding XMM observation;
column 3: Galactic column density;
column 4: source count-rate in the 4.5-7.5 keV energy band;
column 5: EPIC cameras used for the spectral analysis (see notes);
column 6: notes.
a = source on a gap in the pn
b = MOS1 and MOS2 not summed
c = source on a gap in MOS1
d = source outside the pn field of view
e = problems with the pn data
∗ for the spectral analysis we have summed these data with the 0112370101 sequence
3 Optical identification and classification
3.1 The optical counterparts
The optical counterpart for each source in the sample has been searched in the Digitized Sky Survey (DSS) and a magnitude has been collected from the APM (Automatic Plate Measuring machine) catalogue222http://www.ast.cam.ac.uk/apmcat/. Thanks to the good positional accuracy333 see the “EPIC status of calibration and data analysis” report, at xmm.vilspa.esa.es/ (3-4) and the brightness of the XMM sources, there is no ambiguity in the detection of the optical counterpart. When another source is present just outside the X-ray error circle we have spectroscopically observed also this second object. In all these cases (4 in total) the object within the error circle has turned out to be a more reliable counterpart (an AGN) than the object outside the circle (always a star) thus confirming the good accuracy of the X-ray position. All the optical counterparts are within 4 from the X-ray position.
For 26 sources out of 28, an APM counterpart with a red magnitude brighter than 20.1 was found. For the remaining 2 sources, an optical counterpart is visible in the acquisition image taken at the ESO 3.6m telescope during the spectroscopic run (see below for the details) and a magnitude (R) is computed. Hence, for the totality of the sample an optical counterpart has been found. The magnitude distribution of the 28 sources is presented in Figure 1.
It is worth noting that, given the small X-ray-to-optical positional offset and the brightness of the optical counterparts, the expected number of spurious optical identifications is completely negligible in the HBS28 sample. Even considering the stars, that represent the most probable chance coincidence, the expected number of spurious matches in the HBS28 sample is below unity. Indeed, as explained below, no “normal” stars are found in the HBS28 sample. The only Galactic object found is an accreting binary star whose X-ray emission properties are well known.


3.2 The optical spectrosocopy
A search through the literature has produced 5 spectroscopic identifications (3 QSOs, 1 Narrow Line Radio Galaxy and 1 accreting binary star). Three more identifications have been taken from the AXIS project (Barcons et al. 2002a,b); one of these 3 objects has been re-observed at the SUBARU telescope (Severgnini et al. 2003). The remaining sources have been observed and spectroscopically identified during dedicated observing runs. Most of the sources were observed at the ESO 3.6m in May and October 2002 using the EFOSC2 coupled with CCD40 and grism n.13 (October) or grism n.6 (May). The slit width ranges from 1.2″up to 1.5″, depending on the seeing conditions, and was usually oriented according to the parallactic angle to avoid differential flux losses, except when it was oriented so as to include two objects. Four additional objects were observed at the TNG telescope in November 2001 and September 2002, using DOLORES and grism LR-B. For the data reduction we have used the standard IRAF longslit package. The spectra have been wavelength calibrated using an Helium-Argon reference spectrum. A relative flux calibration has been obtained by observing the standard stars G191-B2B, BD25+4655 (TNG) and LTT 7987 (ESO). The weather conditions (not always photometric) and the observing set-up usually do not guarantee a correct absolute flux calibration. For this reason, the spectra reported here are given in arbitrary units.
3.3 The classification criteria
All the 28 sources selected in the HBS28 sample are emission line objects, including one accreting binary star (BL Hyi) which is the only Galactic source in the sample. We will not discuss this object any further as the main scientific target of the HBS28 is the extragalactic population. In Appendix (A.1) we briefly outline the main properties of this source.
A redshift has been secured for all the 27 extragalactic objects in the sample. The redshift distribution is shown in Figure 2.
To classify the emission line objects we have adopted the criteria presented for instance in Véron-Cetty & Véron (2001) which are based on the line widths and the [OIII]5007Å/H flux ratio. In particular, we have divided the extragalactic sources into two groups, i.e. type 1 and type 2 objects:

-
•
Type 1 objects, including:
17 sources showing broad (FWHM2000 kms-1) permitted lines. These are Broad Emission Line AGNs (BEL AGN). This class includes Seyfert 1, Broad Emission Line Radio galaxies (BLRG) and type1 QSO. The optical spectra of the 10 BEL AGNs identified by our own spectroscopic observations are shown in Figure 3.
2 sources which show permitted lines with 1000 km s-1 FWHM2000 km s-1 and a [OIII]5007/H ratio below 3. These sources are classified as Narrow Line Seyfert 1 (NLSy1) candidates. The presence of a relatively strong FeII4570Å hump further supports the classification of these sources as NLSy1. The optical spectra of the 2 NLSy1 are plotted in Figure 4. Given the low-resolution (20Å) and the relatively low S/N ratio of these spectra, a more detailed analysis of the line ratios (e.g. the FeII4570Å/H used for a more quantitative separation between NLSy1 and Sy1 e.g. by Véron-Cetty, Véron & Gonçalves 2001) is not possible.

Figure 4: The spectra of the 2 NLSy1 candidates discovered in the sample: XBSJ023713.5–522734 (top) and XBSJ205829.9–423634 (bottom). The two small boxes inside the two figures show the expanded region around the Fe II4600Å hump. -
•
Type 2 objects, including:
5 sources which show only narrow lines (FWHM1000 km s-1) and [OIII]5007/H3. These objects are classified as Narrow Emission Line AGNs. This class includes Seyfert 2 galaxies, Narrow Line Radio galaxies and type 2 QSO. The optical spectrum of the Seyfert 2 identified by us is shown in Figure 5 (top panel);
1 object (XBSJ193248.8–723355) whose spectrum presents only narrow lines but the [OIII]5007/H ratio is about 2 thus suggesting a non-AGN origin. Also the [OII]3727Å/[OIII]5007 ratio is quite high (3) in agreement with what is usually observed in starburst or HII-region galaxies (e.g. Veilleux & Osterbrock 1987). This source is thus classified as an Emission Line Galaxy (ELG); its spectrum is shown in Figure 5 (bottom panel). As described in the next Section, the X-ray data clearly reveal the presence of an obscured AGN in this object;
2 sources in which all the observed emission lines are narrow (FWHM1000 km s-1) except for a broad H component. These sources are also characterized by a high [OIII]5007/H ratio (3) and are classified as Seyfert 1.9 (Sy1.9). The optical spectra of the two Sy1.9 are reported in Figure 6. In one of the sources (XBSJ031146.1–550702) the broad H component is clearly evident while in XBSJ040658.8–712457 its presence is less obvious and it would require a proper de-blending to be clearly quantified.

In Table 3 the optical properties of the 28 sources in the HBS28 sample are presented while the breakdown of the optical classification is summarized in Table 4.
In conclusion, the percentage of type 1 and type 2 objects is 70% and 30% respectively of the extragalactic sources. The redshift distributions for type 1 and type 2 objects taken separately are only marginally different (K-S probability of 6% of being drawn from the same parent population).

| name | X-ray position | optical position | id | type | z | mag | id ref |
|---|---|---|---|---|---|---|---|
| (J2000) | (J2000) | ||||||
| XBSJ002618.5+105019 | 00 26 18.50 +10 50 19.3 | 00 26 18.70 +10 50 19.5 | BEL AGN | 1 | 0.473 | 17.5 | TNG11/01 |
| XBSJ013240.1–133307 | 01 32 40.11 –13 33 07.8 | 01 32 40.27 –13 33 07.2 | NEL AGN | 2 | 0.562 | 20.0 | ESO10/02 |
| XBSJ013944.0–674909 | 01 39 44.02 –67 49 09.4 | 01 39 43.77 –67 49 08.4 | BEL AGN | 1 | 0.104 | 16.7 | ESO10/02 |
| XBSJ014100.6–675328 | 01 41 00.66 –67 53 28.9 | 01 41 00.23 –67 53 27.6 | E.L.star | – | – | 16.4 | (a) |
| XBSJ015957.5+003309 | 01 59 57.52 +00 33 09.7 | 01 59 57.60 +00 33 10.5 | BEL AGN | 1 | 0.310 | 18.3 | TNG11/01 |
| XBSJ021640.7–044404 | 02 16 40.74 –04 44 04.9 | 02 16 40.66 –04 44 04.7 | BEL AGN | 1 | 0.873 | 16.5 | TNG11/01 |
| XBSJ021808.3–045845 | 02 18 08.34 –04 58 45.7 | 02 18 08.20 –04 58 45.7 | BEL AGN | 1 | 0.712 | 17.7 | AXIS |
| XBSJ021817.4–045113 | 02 18 17.40 –04 51 13.3 | 02 18 17.43 –04 51 13.0 | BEL AGN | 1 | 1.070 | 19.5 | AXIS |
| XBSJ021822.2–050615 | 02 18 22.28 –05 06 15.7 | 02 18 22.15 –05 06 14.5 | NEL AGN | 2 | 0.044 | 14.8 | (b) |
| XBSJ023713.5–522734 | 02 37 13.54 –52 27 34.4 | 02 37 13.66 –52 27 34.7 | NLSy1 | 1 | 0.193 | 17.1 | ESO10/02 |
| XBSJ030206.8–000121 | 03 02 06.86 –00 01 21.2 | 03 02 06.76 –00 01 21.7 | BEL AGN | 1 | 0.641 | 18.8 | (c) |
| XBSJ030614.1–284019 | 03 06 14.19 –28 40 19.9 | 03 06 14.21 –28 40 19.3 | BEL AGN | 1 | 0.278 | 18.5 | ESO10/02 |
| XBSJ031015.5–765131 | 03 10 15.56 –76 51 31.5 | 03 10 15.88 –76 51 33.8 | BEL AGN | 1 | 1.187 | 17.6 | (d) |
| XBSJ031146.1–550702 | 03 11 46.12 –55 07 02.5 | 03 11 46.18 –55 06 59.9 | Sy1.9 | 2 | 0.162 | 17.3 | ESO10/02 |
| XBSJ031859.2–441627 | 03 18 59.29 –44 16 27.6 | 03 18 59.41 –44 16 26.7 | BEL AGN | 1 | 0.140 | 15.9 | (b), ESO10/02 |
| XBSJ033845.7–352253 | 03 38 45.77 –35 22 53.4 | 03 38 46.02 –35 22 52.7 | NEL AGN | 2 | 0.113 | 17.0 | (e) |
| XBSJ040658.8–712457 | 04 06 58.87 –71 24 57.7 | 04 06 58.88 –71 24 59.8 | Sy1.9 | 2 | 0.181 | 18.7 | ESO10/02 |
| XBSJ040758.9–712833 | 04 07 58.97 –71 28 33.5 | 04 07 58.58 –71 28 32.2 | NEL AGN | 2 | 0.134 | 17.0 | ESO10/02 |
| XBSJ041108.1–711341 | 04 11 08.10 –71 13 41.1 | 04 11 08.78 –71 13 42.8 | BEL AGN | 1 | 0.923? | 20.3∗ | ESO10/02 |
| XBSJ185613.7–462239 | 18 56 13.75 –46 22 39.2 | 18 56 13.78 –46 22 37.1 | BEL AGN | 1 | 0.768 | 19.0 | ESO05/02 |
| XBSJ193248.8–723355 | 19 32 48.80 –72 33 55.2 | 19 32 48.77 –72 33 53.3 | ELG | 2 | 0.287 | 18.8 | ESO05/02 |
| XBSJ204043.4–004548 | 20 40 43.46 –00 45 48.2 | 20 40 43.46 –00 45 51.9 | NEL AGN | 2 | 0.615 | 21.2∗ | ESO10/02 |
| XBSJ205635.7–044717 | 20 56 35.75 –04 47 17.9 | 20 56 35.67 –04 47 17.2 | BEL AGN | 1 | 0.217 | 17.3 | TNG09/02 |
| XBSJ205829.9–423634 | 20 58 29.97 –42 36 35.0 | 20 58 29.89 –42 36 34.2 | NLSy1 | 1 | 0.232 | 18.3 | ESO10/02 |
| XBSJ213002.3–153414 | 21 30 02.32 –15 34 14.1 | 21 30 02.30 –15 34 13.2 | BEL AGN | 1 | 0.562 | 17.3 | ESO10/02 |
| XBSJ213824.0–423019 | 21 38 24.03 –42 30 19.2 | 21 38 24.03 –42 30 17.5 | BEL AGN | 1 | 0.257 | 16.6 | (f) |
| XBSJ214041.4–234720 | 21 40 41.45 –23 47 20.1 | 21 40 41.53 –23 47 19.3 | BEL AGN | 1 | 0.490 | 18.4 | ESO10/02 |
| XBSJ220601.5–015346 | 22 06 01.50 –01 53 46.9 | 22 06 01.45 –01 53 46.1 | BEL AGN | 1 | 0.211 | 20.1 | ESO10/02 |
column 1: name;
column 2: X-ray position;
column 3: Optical position;
column 4: spectroscopic classification (BEL AGN=Broad Emission Line AGN; NEL AGN=Narrow Emission Line AGN; NLSy1=Narrow Line Seyfert 1; Sy1.9=Seyfert 1.9; ELG=Emission Line Galaxy);
column 5: optical spectral type;
column 6: redshift;
column 7: APM red magnitude; the asterisk indicates that the magnitude (R) has been derived from our own observations;
column 8: reference for the identification i.e. the observing run, if the source has been identified by us, or a reference, if the source has been identified from the literature. The notes are:
(a) V* BL Hyi. See Appendix A.1;
(b) identification from Severgnini et al. (2003)
(c) identification from La Franca, Cristiani & Barbieri (1992)
(d) identification from Fiore et al. (2000)
(e) identification from Carter & Malin (1983)
(f) identification from Hewett, Foltz & Chaffee (1995)
AXIS: identification from the AXIS project (Barcons et al. 2002a,b)
| class | Spectral type | Number | % extragalactic |
| Type 1 | |||
| Broad Emission Line AGN | 17 | 63% | |
| NLSy1 | 2 | 7% | |
| 19 | 70% | ||
| Type 2 | |||
| Narrow Emission Line AGN | 5 | 19% | |
| ELG | 1 | 4% | |
| Seyfert 1.9 | 2 | 7% | |
| 8 | 30% | ||
| Accreting binary | 1 | ||
| Total | 28 |
4 X-ray data
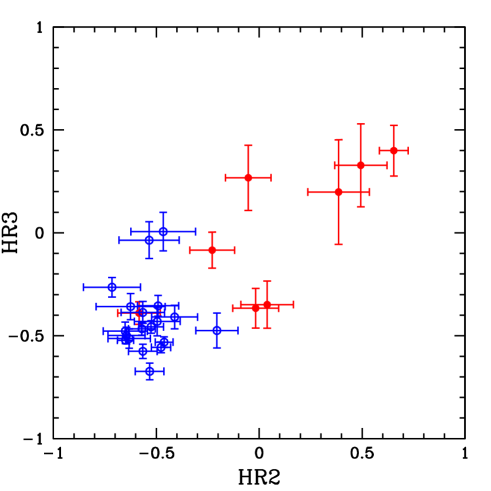
On the basis of the MOS2 data, used for the sample definition, we have firstly studied the hardness ratios of the sources in the sample. This is useful as reference for other (deeper) samples for which the available number of counts per source is not enough to perform a detailed spectral analysis. The hardness ratios have been computed using the data in the 0.5-2.0 keV, 2.0-4.5 keV and 4.5-7.5 keV energy intervals adopting the following standard definitions:
HR2 =
HR3 =
where C represents the MOS2 corrected count-rates (see http://xmmssc-www.star.le.ac.uk/ for details) in the energy intervals indicated in parenthesis (in keV). The hardness ratios used are weakly dependent on the Galactic NH (which is below 1021 cm-2 in the fields used for the sample selection). In Figure 7 the HR3 is plotted against HR2. The figure clearly shows that the optical classification and the hardness-ratio (HR2 in particular) are coupled: nearly all (7/8) the type 2 objects show HR2 –0.3 while all but one type 1 sources have HR2 values below this value. The two exceptions are: XBSJ031146.1550702, a Sy1.9 with HR2=–0.58 and XBSJ031859.2441627, a type 1 AGN with HR2=–0.21. As discussed below, the X-ray analysis has confirmed the absence of a significant absorption in the first source and the presence of a mild absorption in the second one.
Qualitatively, the correlation between the hardness-ratio and the optical spectral type is expected in the context of the unified models. A more quantitative assessment of this correlation is done in the following Section on the basis of a detailed spectral analysis.
4.1 X-ray spectral analysis
Thanks to the relatively bright flux limit which characterizes the sample, most of the sources have enough counts to perform a reliable X-ray spectral analysis. Except for 2 sources, the total counts in the MOS2 range from 100 to 3900. The availability of the MOS1 and, in most cases, of the pn increases the counts by a factor 2 (if only the MOS1 is available) or 4 (if both MOS1 and pn are available) the actual number of counts available for the spectral analysis. For 7 sources the pn was either not available or the object was outside the field of view or under a bad column. In another case the source falls under a gap in the MOS1 camera. In Table 2 the EPIC detectors used for the X-ray analysis of each source are summarized. Before the extraction of the spectra, we have removed the time intervals characterized by a high background.
All the spectra have been extracted using a circular region with a radius of 20-30, depending on the source off axis distance. The background is extracted in a nearby source-free circular region of a radius a factor 2 larger than the one used to extract the source counts. When the same blocking filters are used in the two MOS cameras the data are combined after the extraction.
The MOS and pn data have been re-binned in order to have at least 15-25 counts per channel depending on the brightness of the source. XSPEC 11.2 was then used to fit simultaneously the MOS and pn data, leaving the relative normalization free to vary. During the fitting procedure only the data in the 0.3-10 keV and 0.4-10 keV energy ranges are considered for the MOS and the pn respectively. Errors are given at the 90% confidence level for one interesting parameter (=2.71).
Initially, we attempted to fit a simple absorbed power-law model to all the 27 spectra taking into account both the Galactic hydrogen column density along the line of sight (from Dickey & Lockman 1990) and a possible intrinsic absorption at the source redshift.
For 20 sources the resulting fit is good enough (i.e. no systematic trends are observed in the residuals) and kept as the best-fit model while for the remaining 7 sources a simple absorbed power-law model does not give an acceptable fit.
In most (13) of the 20 objects that are well fitted by a simple absorbed power-law model, no intrinsic absorption is found while for 7 sources the best-fit intrinsic NH is larger than the local Galactic column density. Among these latter sources, 4 present an Hydrogen column density larger than 1022 cm-2 and the related best fit photon index is flatter (1.5) than the flattest found for the unabsorbed AGNs (see below). This is probably due to the poor statistics available for spectral analysis which do not allow us to adequately constrain at the same time both the spectral index and the absorption. In order to better constrain the correct value of NH we have fixed for these 4 sources the to 1.9 (which corresponds to the average value found for the type 1 AGNs, see below) and derived the corresponding column density NH. This procedure is justified in the context of the unified scheme according to which the absorbed AGNs should have the same intrinsic power-law and a larger absorption with respect to the type 1 AGNs. Since the values of found for the type 1 AGNs have an intrinsic dispersion, we have checked the variation of NH when extreme values of (within the observed distribution) are assumed. We have found that the variation of NH is usually within the reported errors.
Finally, for the 7 sources for which the simple absorbed power-law model does not offer a good representation of the data, an improved fit is obtained with a more complex model, like a “leaky absorbed power-law” model444this model consists of two power-laws, one absorbed and one unabsorbed, having the same photon index or by adding a thermal component. In one case (XBSJ040758.9–712833) the value of in the “leaky absorbed power-law” has been fixed to 1.9 to better constrain the absorption.
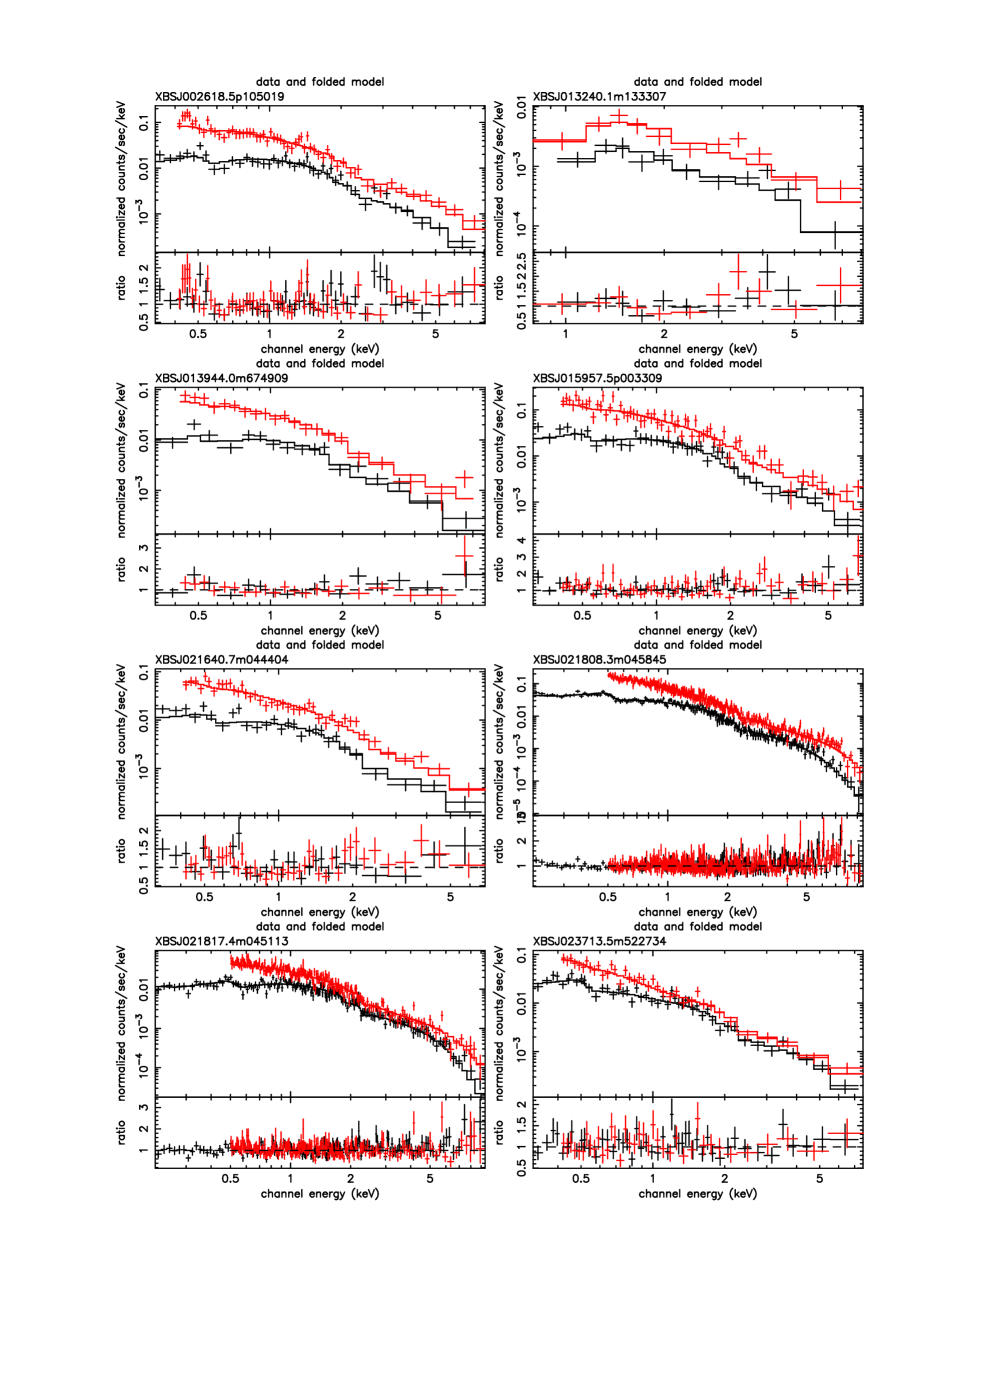
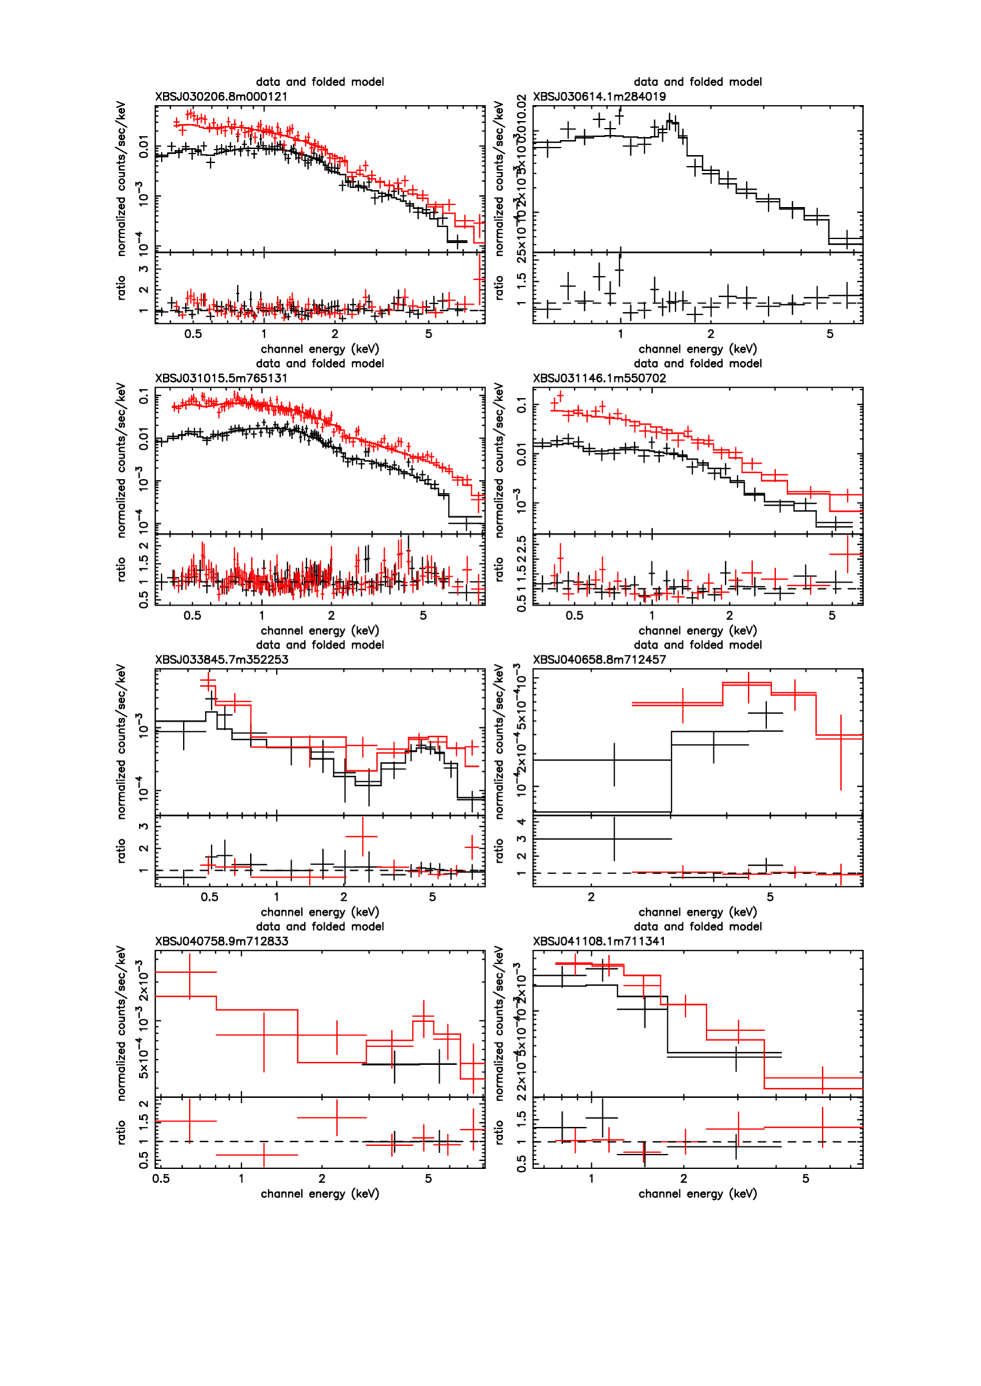
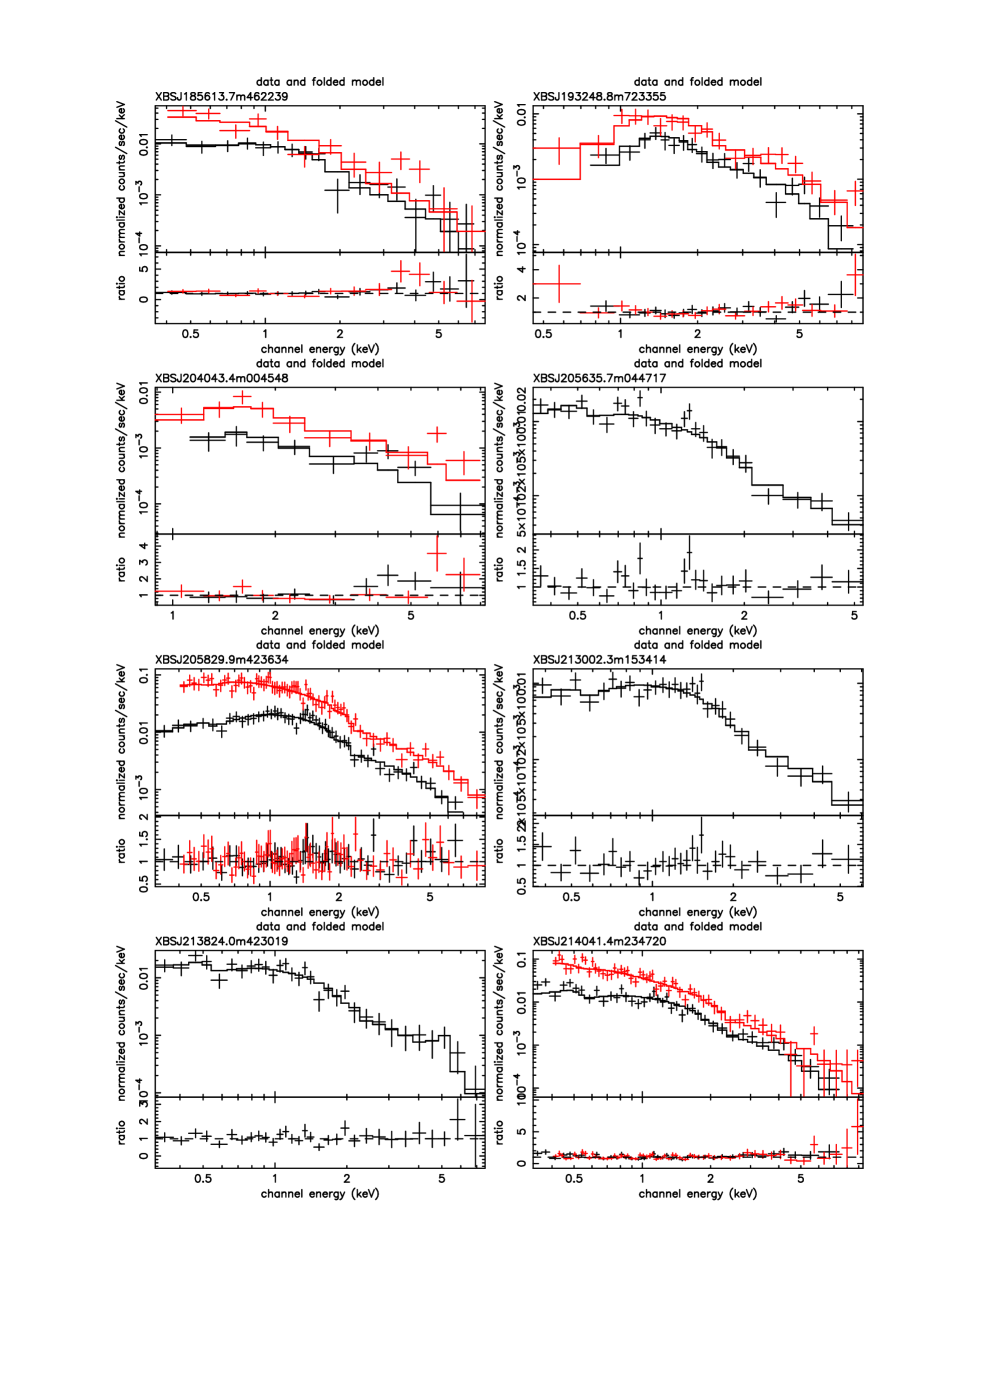
The results of the X-ray spectral analysis for the extragalactic sources are summarized in Table 5. The X-ray spectra of the extragalactic sources are reported in Appendix 14.
The distribution of the photon indices of the type 1 objects is shown in Figure 8. The mean value is =1.97 with a standard deviation of 0.16 consistent with the mean value found in other similar samples (e.g. Mainieri et al. 2002). The distribution of the photon indices of the type 2 objects is not presented since, for most of these sources, the value of has been fixed to the value 1.9 to better constrain the absorption.

We discuss below in greater detail the results for the single classes of extragalactic objects.
4.2 Type 1 AGN
Broad Emission Line AGNs. For 12 out of 17 Broad Line AGNs the simple absorbed power-law model gives an acceptable fit (reduced below 1.2) and a column density consistent with the Galactic value. In one object (XBSJ031859.2–441627) an intrinsic column density (NH=3.91021 cm-2 with =1.72) significantly larger than the Galactic value results from the fitting procedure. This is one of two sources mentioned at the beginning of Section 4 for which a departure from the HR2/optical classification segregation has been noted. The optical spectrum of this source is dominated by the host galaxy while the AGN activity is suggested only by the presence of a weak (EW16 Å), possibly broad H emission line. In Severgnini et al. (2003) we show that the observed optical spectrum of this object can be modeled by using the NH computed from the X-ray data and assuming a standard Galactic value for the EB-V/NH ratio.
In three other objects (XBSJ021808.3-045845, XBSJ205635.7-044717, XBSJ220601.5-015346) the simple absorbed power-law model leaves significant residuals. A better fit is obtained by adding a soft component (a Black-body spectrum with a temperature of 0.1-0.2 keV).
In summary, all the objects with broad (FWHM2000 km s-1) emission lines in the optical spectra are unabsorbed or only weakly absorbed in the X-ray band (N41021 cm2). In 18% of cases, a soft excess is also detected.
Narrow Line Seyfert 1. The 2 NLSy1 candidates found in the sample show only a moderate intrinsic absorption (NH=9.51020 cm-2, XBSJ205829.9-423634) or no absorption at all (XBSJ023713.5-522734). In the case of XBSJ023713.5-522734, a better fit is obtained by adding a soft-component modeled with a black-body spectrum with kT=0.1 keV. The spectral indices in the two sources are quite similar (=1.90 for XBSJ023713.5-522734 and =1.91 for XBSJ205829.9-423634) and slightly lower but still consistent with those found with ASCA by Vaughan et al. (1999) for a sample of 22 NLSy1 (=2.1 with a standard deviation of 0.3 in the 2-10 keV band).
In summary, the 2 NLSy1 candidates are not significantly absorbed in the X-ray (N1021 cm-2) and, in one case, a soft-excess is also present. With the available data there is no evidence that NLSy1 have steeper values when compared to Sy1.
4.3 Type2 AGN
Narrow Line AGNs and ELG. The X-ray spectra of all the Narrow Line AGNs and the ELG show strong evidence of intrinsic absorption (N1022 cm-2).
In two cases, a more complex model, including a “scattered” component (“leaky absorbed power-law” model) is needed to obtain a better fit to the data. The scattered component is found to be 5% –10% of the flux of the primary component in agreement with what has been observed in other well studied Type 2 AGNs (e.g. Turner et al. 1997a,b).
Finally, in one case (XBSJ033845.7-352253) the leaky absorbed power-law model does not give an acceptable fit leaving significant residuals at low energies. The inclusion of a thermal component with kT=0.16 keV is required to achieve a better fit (see Appendix A.3 for a more detailed discussion of this source).
In summary, the 6 objects with an optical spectrum showing only narrow emission lines (FWHM1000 km s-1) are significantly absorbed at X-ray energies (N1022 cm2).
Notably, two objects (XBSJ013240.1-133307 and XBSJ204043.4-004548) have an unabsorbed X-ray luminosity (L2-10keV=2.61044 erg s-1 and L2-10keV=3.21044 erg s-1 respectively) in the typical range of the type 2 QSO. The optical spectra of these two sources are shown in Figure 9.

Seyfert 1.9. The 2 “intermediate” Seyfert galaxies show very different spectra: XBSJ040658.8-712457 is absorbed (=2.51023 cm-2) while XBSJ031146.1-550702 is well fitted by a simple un-absorbed power-law model with 1.31020 cm-2. The very low X-ray absorption observed in this latter source is in contrast with what is usually found in Sy1.9 for which typical values of are between 1022 and 1024 cm-2 (e.g. Risaliti, Maiolino & Salvati 1999; Maiolino et al. 2001). The source XBSJ031146.1-550702 seems to be a case where the measured X-ray absorption is much lower than the one inferred by the optical spectrum, which shows no broad lines except for a broad wing in the H profile and an [OIII]5007Å/H ratio typical of a Sy2. Other cases like this have been presented in the literature (see next section). A more detailed discussion of this object is reported in Appendix A.2.

| name | id | Model | NH | kT | red /dof | f2-10keV | Log L2-10keV | |
|---|---|---|---|---|---|---|---|---|
| (1022) | (10-13) | |||||||
| XBSJ002618.5105019 | BEL AGN | PL | 2.02 | 0.011 | … | 1.15 / 97 | 2.8 | 44.44 |
| XBSJ013240.1133307 | NEL AGN | PL | 1.9 (frozen) | 2.54 | … | 1.11 / 19 | 1.7 | 44.41 |
| XBSJ013944.0674909 | BEL AGN | PL | 1.94 | 0.018 | … | 0.91 / 34 | 1.2 | 42.56 |
| XBSJ015957.5003309 | BEL AGN | PL | 2.14 | 0.010 | … | 1.19 / 99 | 2.9 | 44.03 |
| XBSJ021640.7044404 | BEL AGN | PL | 2.24 | 0.020 | … | 1.17 / 67 | 1.1 | 44.74 |
| XBSJ021808.3045845 | BEL AGN | PL + BB | 2.01 | 0.007 | 0.16 | 1.07 / 527 | 2.3 | 44.79 |
| XBSJ021817.4045113 | BEL AGN | PL | 1.84 | 0.04 | … | 1.07 / 346 | 2.7 | 45.22 |
| XBSJ021822.2050615a | NEL AGN | Leaky | 1.66 | 20.54 | … | 1.41 / 63 | 3.0 | 42.76 |
| XBSJ023713.5522734 | NLSy1 | PL + BB | 1.90 | 0.18 | 0.11 | 0.86 / 80 | 2.7 | 43.52 |
| XBSJ030206.8000121 | BEL AGN | PL | 1.90 | 0.015 | … | 1.14 / 125 | 2.2 | 44.63 |
| XBSJ030614.1284019b | BEL AGN | PL | 1.56 | 0.048 | … | 1.15 / 16 | 2.9 | 43.87 |
| XBSJ031015.5765131 | BEL AGN | PL | 1.92 | 0.022 | … | 0.90 / 189 | 3.4 | 45.47 |
| XBSJ031146.1550702 | Sy1.9 | PL | 2.08 | 0.013 | … | 0.93 / 44 | 2.8 | 43.37 |
| XBSJ031859.2441627a | BEL AGN | PL | 1.58 | 0.33 | … | 0.73 / 18 | 1.7 | 42.99 |
| XBSJ033845.7352253 | NEL AGN | Leaky + RS | 1.9 (frozen) | 28.5 | 0.16 | 0.83 / 29 | 1.7 | 43.21 |
| XBSJ040658.8712457 | Sy1.9 | PL | 1.9 (frozen) | 21.97 | … | 1.25 / 4 | 1.6 | 43.56 |
| XBSJ040758.9712833 | NEL AGN | Leaky | 1.9 (frozen) | 28.23 | … | 1.13 / 5 | 2.5 | 43.44 |
| XBSJ041108.1711341 | BEL AGN | PL | 1.95 | 0.61 | … | 0.99 / 6 | 0.8 | 44.59 |
| XBSJ185613.7462239 | BEL AGN | PL | 2.18 | 0.058 | … | 1.15 / 26 | 1.4 | 44.69 |
| XBSJ193248.8723355 | ELG | PL | 1.9 (frozen) | 1.14 | … | 1.06 / 35 | 1.9 | 43.76 |
| XBSJ204043.4004548 | NEL AGN | PL | 1.9 (frozen) | 3.00 | … | 1.35 / 16 | 1.7 | 44.50 |
| XBSJ205635.7044717 | BEL AGN | PL + BB | 1.91 | 0.56 | 0.15 | 1.18 / 21 | 1.7 | 43.42 |
| XBSJ205829.9423634 | NLSy1 | PL | 1.91 | 0.09 | … | 0.76 / 120 | 3.2 | 43.76 |
| XBSJ213002.3153414 | BEL AGN | PL | 2.10 | 0.08 | … | 0.82 / 26 | 1.8 | 44.45 |
| XBSJ213824.0423019c | BEL AGN | PL | 2.14 | 0.057 | … | 0.86 / 26 | 1.6 | 43.60 |
| XBSJ214041.4234720 | BEL AGN | PL | 2.19 | 0.012 | … | 1.06 / 93 | 1.7 | 44.28 |
| XBSJ220601.5015346 | BEL AGN | PL + BB | 1.56 | 0.670 | 0.06 | 0.72 / 15 | 1.7 | 43.36 |
column 1: source name;
column 2: optical identification;
column 3: best-fit model (PL = absorbed power-law; Leaky = leaky absorbed power-law; PL + BB = absorbed power-law plus Black-Body spectrum; Leaky + RS = leaky absorbed power-law plus a Raymond-Smith spectrum)
column 4: best-fit photon index of the power-law component;
column 5: best-fit intrinsic hydrogen column density [cm-2];
column 6: temperature of the thermal component (if present) [keV];
column 7: reduced Chi-squared and degrees of freedom of the best-fit;
column 8: observed 2-10 keV flux (corrected for the Galactic absorption) [erg s-1 cm-1];
column 9: Logarithm of the intrinsic luminosity in the 2-10 keV energy range [erg s-1];
a results from the X-ray analysis taken from Severgnini et al. (2003)
b in this object the presence of an emission line at 1.9 keV (source rest frame, consistent with the Si XIII at 1.86 keV) is required.
c in this object the presence of an emission line at 6.4 keV (source rest frame, consistent with the Fe I K) is required.
5 Optical versus X-ray absorption
The unified models (Antonucci 1993) predict a strict correlation between the optical and the X-ray absorption. Although the presence of this correlation is suggested by the large values of NH usually observed in Seyfert 2 galaxies (e.g. Awaki et al. 1991; Turner et al. 1997a; Risaliti et al. 1999; Guainazzi et al. 2001), many important exceptions are known since the first observations taken with the Einstein Observatory (e.g. Maccacaro, Perola & Elvis 1982). More recently, Panessa & Bassani (2002) have presented a significant number of type 2 AGNs whose X-ray spectra are indicative of a very low (or even absent) absorption (N1022 cm-2), thus confirming earlier results from Ptak et al. (1996), Pappa et al. (2001) and Bassani et al. (1999). Similarly, Barcons, Carrera & Ceballos (2003) have recently shown the case of a Sy1.9 with no X-ray absorption and more cases like this are emerging from recent XMM observations (Lehmann et al. in prep.). Quantifying the percentage of this type of source is a difficult task. However, Panessa & Bassani (2002) estimate this percentage in the range 10%-30%. This number is larger than that found by Risaliti et al. (1999) in a sample of Seyfert 2 (4%).
Another important exception to the optical/X-ray absorption correlation is the discovery of type 1 AGNs with large X-ray absorption (e.g. Fiore et al. 2001). Similarly, Maiolino et al. (2001) have pointed out that in a fraction of AGNs the ratio is significantly lower than that observed in our Galaxy.
The statistical completeness of the HBS28 sample together with its complete spectroscopic classification allows us to perform a statistical analysis of the relationship between X-ray and optical absorption at the flux limit of the survey (4-710-14 erg s-1 cm-2 in the 4.5-7.5 keV energy range). In Figure 10 the distribution of the intrinsic NH for the extragalactic objects is presented. The number of X-ray obscured AGNs (N1022 cm-2) is 7 corresponding to a surface density of 0.7 deg-2.
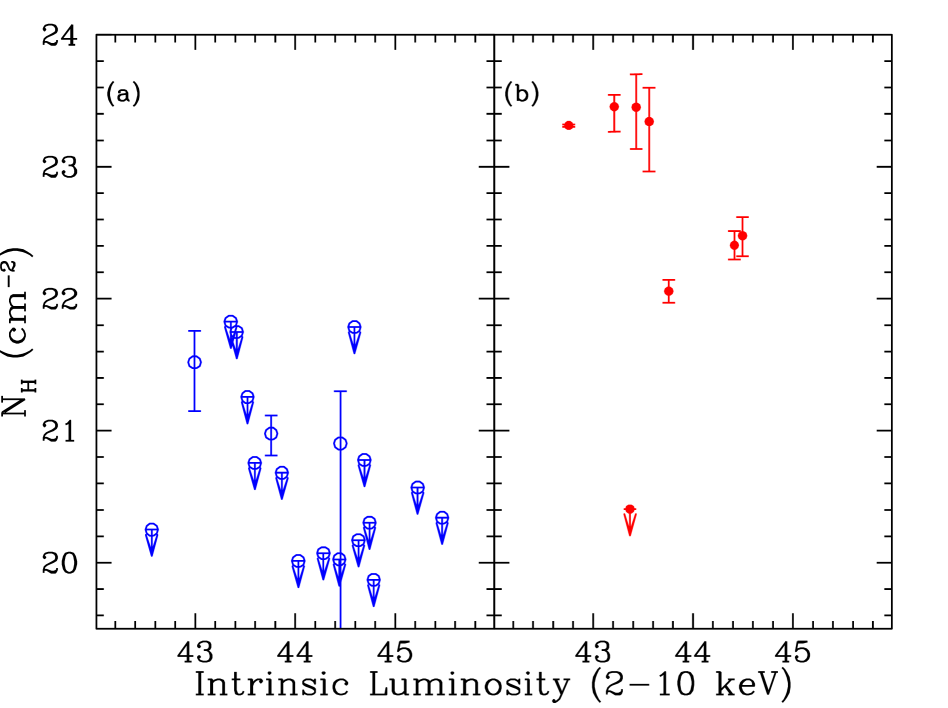
In Figure 11 the best-fit values of NH are plotted against the 2-10 keV intrinsic luminosity. In panel (a) of Figure 11 only the sources optically classified as type 1 objects are plotted while in panel (b) only the type 2 objects are presented. The plot confirms what has been already inferred from the analysis of the hardness ratios, i.e. that a correlation between the optical type and the X-ray absorption is clearly present: type 1 objects always have low values of NH (1022 cm-2, panel a) while the majority (88%) of type 2 objects have large values of NH (1022 cm-2) (panel b). This correlation holds also in the other sense: the great majority (95%) of sources with N1022 cm-2 are type 1 while all the objects with N1022 cm-2 are type 2 sources.
In the HBS28 sample one source out of eight type 2 sources has N1022 cm-2 (see previous Section). Hence, we can infer that the fraction of these sources is 12% with a standard deviation range of 2% - 41%. Given the large uncertainity, this result is consistent with both the estimate made by Panessa & Bassani (2002) and with that of Risaliti et al. (1999).
Moreover, we have found two type 1 AGNs in which the absorption exceeds the Galactic column density, but in only one of these the intrinsic absorption is relatively large (NH=3.31021 cm-2, XBSJ031859.2–441627). As already discussed, also in this object the observed NH and the optical spectrum are consistent with a standard Galactic / (Severgnini et al. 2003).
Interestingly, we have not found any type 1 object for which the value of NH is higher than 1022 cm-2 (see Figure 10). Based on the available numbers we can estimate an upper limit of 10% on the percentage of type 1 sources with N1022 cm-2.
6 Comparison with the XRB synthesis models
The relative percentage of absorbed versus un-absorbed AGNs found in the HBS28 sample can be directly compared to the theoretical predictions of the XRB synthesis models. We stress once again the great advantage of dealing with a completely identified sample for which a value for the redshift is available for all sources. This is fundamental for a correct determination of the intrinsic absorbing column density.
The 4.5-7.5 keV selection interval is useful for probing the real fraction of obscured objects even at relatively bright flux limits. The expected fraction of obscured AGNs (N1022 cm-2) in the HBS28 predicted by the XRB synthesis model discussed in Comastri et al. (2001) is equal to 0.62-0.65, considering the range of fluxes sampled by the HBS28 (between 0.4 to 2.510-13 erg s-1 cm-2). This fraction corresponds to 17-18 AGNs obscured in the X-rays expected in the HBS28 sample. This number is significantly (at the 99% confidence level) larger than the observed one (7), assuming the Poissonian statistics (Gerhels 1986).
A similar overprediction, although less significant (90%), of the population of absorbed AGNs is also found by comparing our results with the “modified unified model” recently presented by Ueda et al. (2003), which includes a dependence of the fraction of absorbed AGNs on the X-ray luminosity.
In the 2-10 keV energy band Piconcelli et al. (2002, 2003) have already pointed out that the observed fraction of the absorbed AGNs at a flux limit of 10-14 erg s-1 cm-2 is a factor 2 lower that predicted by the CXB synthesis models. We thus confirm this result and extend it to the hardest 4.5-7.5 keV energy band. Clearly, current XRB synthesis models have to be revised.
7 Type 2 QSO
As already mentioned, two type 2 QSO have been discovered in the HBS28 sample, namely XBSJ013240.1-133307 (z=0.562, intrinsic L2-10keV=2.61044 erg s-1) and XBSJ204043.4-004548 (z=0.615, intrinsic L2-10keV=3.21044 erg s-1). In Figure 12 the ratio between the observed flux (2-10 keV) and the optical flux555 Fopt=f6400Å where f6400Å is the monochromatic flux at 6400Å derived from the APM red magnitudes and is the band width of the R Cousins filter. are plotted versus the observed 2-10 keV flux. The two type 2 QSO are among the three objects with the largest X-ray-to-optical flux ratio (1.2 and 0.8) in the sample. The surface density of type 2 QSO at the flux limit of the HBS28 is 0.21 deg-2.

8 X-ray bright Optically Normal Galaxies (XBONG)
The existence of optically “passive” galaxies for which the X-ray observations reveal an intense AGN activity has been hotly discussed in the recent literature (e.g. Fiore et al. 2000; Barger et al. 2002, Comastri et al. 2002; Severgnini et al. 2003). Even if these X-ray bright Optically Normal Galaxies (XBONG) seem to emerge at faint X-ray fluxes (10-13 erg cm-2 s-1), some examples have been discovered also at relatively high X-ray fluxes (e.g. Piconcelli et al. 2002; Severgnini et al. 2003).
In the HBS28 sample two sources were at a first glance classified as XBONG candidates, based on the optical information available at the time of the sample selection. The source XBSJ021822.2–050615 was initially classified as an XBONG since no strong emission lines were present in the discovery spectrum. However, a more accurate re-observation of this source with the 8.2m Subaru telescope has revealed the presence of narrow emission lines that were outshone by the host-galaxy light in the previous spectrum (Severgnini et al. 2003). This source is thus classified as Type 2 AGN.
Similarly, the source XBSJ031859–441627 was initially classified as an “optically dull galaxy” on the basis of an optical spectrum covering the spectral range between 4900 and 5800Å. Further observations, covering a wider spectral range, have revealed of the presence of a weak and possibly broad H emission line (Severgnini et al. 2003). We consider this object to be a type 1 AGN.
Interestingly, the two objects have the lowest X-ray-to-optical flux ratio (and the brightest magnitude) among the objects in the HBS28 sample (see Figure 12). This peculiar X-ray-to-optical flux ratio found for this type of sources has been already noted, for instance, by Comastri et al. (2003).
In conclusion, two sources in the HBS28 sample are potentially similar to some XBONG that are emerging from different X-ray surveys although a closer look at their spectra, based on high resolution data and/or a better spectral coverage, reveal their real AGN nature. We stress that similar detailed observations, relatively easy to do for low-z sources (like those discovered in the HBS28 sample), are hard to carry out for higher z objects.
9 Summary and conclusions
We have presented a statistically complete sample of 28 X-ray sources selected in the 4.5-7.5 keV energy band at a flux limit of 4-710-14 erg s-1 cm-2. The sample is completely identified and a spectroscopic classification and redshift is available for each object. This is the first sample, selected in this energy band, to have such complete optical information. Apart from one Galactic accreting binary star, all the remaining 27 sources are AGNs. We have discussed the optical classification of these 27 objects based on the presence and the intensities of the broad/narrow emission lines. In particular, we have divided the sources into 19 type 1 objects, including Sy1, QSO and NLSy1, and 8 type 2 objects, including Sy2, Sy1.9, Narrow Line Radio Galaxies (NLRG) and ELG. We have then presented the X-ray spectral analysis based on the XMM-Newton EPIC data for the 27 AGNs. Thanks to the relatively bright flux limit of the sample, the available number of counts (from hundreds to thousands) is large enough to allow a reliable spectral analysis in nearly all cases.
The optical and the X-ray properties of the sources are thus analysed together. The main results can be summarized as follows:
-
•
A correlation between the optical spectral type and the X-ray absorption is found: all the type 1 objects show column densities, derived from the X-ray spectra, below 1022 cm-2. On the contrary, all but 1 (88%) of the type 2 objects are characterized by column densities above 1022 cm-2. This result strongly supports the unified models (e.g. Antonucci 1993);
-
•
Despite the mentioned good correlation, we have found one type 2 object (optically classified as Sy1.9) with no absorption (N1.31020 cm-2) in the X-ray band. In Appendix A.2 we have discussed the similarities of this object with those found by other authors (e.g. Panessa & Bassani 2002);
-
•
Two type 2 QSOs, with an intrinsic luminosity larger than 1044 erg s-1 (2-10 keV) and N1022 cm-2 have been discovered in the sample. These two objects represent 25%/30% of the optical/X-ray absorbed AGNs respectively. The corresponding surface density of type 2 QSO at the flux limit of the survey is 0.21 deg-2;
-
•
The fraction of absorbed AGNs (N1022 cm-2) in this sample (26%) is significantly lower (at 90% confidence level) than the fraction predicted by the current XRB synthesis models at this flux limit (Comastri et al. 2001; Ueda et al. 2003). The observed lack of absorbed AGNs, recently suggested also by other authors (e.g. Piconcelli et al. 2002, 2003), clearly indicates that the XRB synthesis models should be revised, at least with respect to the relative fraction of obscured/un-obscured objects.
Acknowledgements.
We thank Andrea Comastri for providing us with the predictions of the XRB synthesis model adapted to the 4.5-7.5 keV energy band. This work has received partial financial support from ASI (I/R/062/02, I/R/037/01) and from the Italian Ministry of University and Scientific and Technological Research (MURST) through grant Cofin. XB and FJC acknowledge financial support from the Spanish Ministry of Science and Technology, under project AYA2000-1690. The TNG telescope is operated on the island of La Palma by the Centro Galileo Galilei of the INAF in the Spanish Observatorio del Roque de Los Muchachos of the Instituto de Astrofísica de Canarias. We would like to thank the staff members of the ESO and TNG Telescopes for their support during the observations. This research has made use of the NASA/IPAC Extragalactic Database (NED) which is operated by the Jet Propulsion Laboratory, California Institute of Technology, under contract with the National Aeronautics and Space Administration. We finally thank the APM team for maintaining this facility.References
- (1) Akiyama, M., Ueda, Y., Ohta, K., Takahashi, T., Yamada, T. 2003, ApJ, in press (astro-ph/0307164)
- (2) Awaki, H., Koyama, K., Inoue, H., Halpern, J.P., 1991, PASJ, 43, 195
- (3) Baldi, A., Molendi, S., Comastri, A., et al. 2002, ApJ, 564, 190
- (4) Barcons, X., Carrera, F.J., Ceballos, M.T. 2003, MNRAS, 339, 757
- (5) Barcons, X., Carrera, F.J., Watson, M. G., et al. 2002a, A&A, 382, 522
- (6) Barcons, X., Carrera, F.J., Ceballos, M.T., et al. 2002b, Proc. of the ”X-ray surveys, in the light of the new observatories” workshop, Astronomische Nachrichten, in press
- (7) Barger, A. J., Cowie, L. L., Brandt, W. N., Capak, P., Garmire, G. P., Hornschemeier, A. E., Steffen, A. T., & Wehner, E. H. 2002, AJ, 124, 1839
- (8) Bassani, L., Dadina, M., Maiolino, R., Salvati, M., Risaliti, G., Della Ceca, R., Matt, G., & Zamorani, G. 1999, ApJS, 121, 473
- (9) Brandt, W.N., Alexander, D.M., Hornschemeier, A.E., et al. 2001, ApJ, 122, 2810
- (10) Carter, D. & Malin, D. F. 1983, MNRAS, 203, 49
- (11) Comastri, A., Setti, G., Zamorani, G., Hasinger, G. 1995, A&A, 296, 1
- (12) Comastri, A. Fiore, F., Vignali, C., Matt, G., Perola, G. C., La Franca, F. 2001, MNRAS, 327, 781
- (13) Comastri, A., Mignoli, M., Ciliegi, P., et al. 2002, ApJ, 571, 771
- (14) Comastri, A., Brusa, M., Mignoli, M. & the HELLAS2XMM team, 2003, AN, 324, 28
- (15) Condon, J.J et al. 1998, AJ, 115, 1693
- (16) Della Ceca, R., Pellegrini, S., Bassani, L., Beckmann, V., Cappi, M., Palumbo, G.G.C., Trinchieri, G., Wolter, A. 2001, A&A, 375, 781
- (17) Della Ceca, R., Maccacaro, T., Caccianiga, A., et al. 2002, Proc. of Symposium “New Visions of the X-ray Universe in the XMM-Newton and Chandra Era”, ESA SP-488, Ed. F. Jansen (astro-ph/0202150)
- (18) Della Ceca, R., 2002, on the behalf of the XMM-Newton Survey Science Center (SSC) Consortium, Proc. of “AGN05: Inflows, outflows and reprocessing around black-holes”, Como (Italy) (astro-ph/0211081)
- (19) Dickey, J. M. & Lockman, F. J. 1990, ARA&A, 28, 215
- (20) Elvis, M., Schreier, E.J., Tonry, J., Davis, M., Huchra, J.P., 1981, ApJ, 246, 20
- (21) Fabian, A.C., 2003, Proc. of “Coevolution of Black Holes and Galaxies”, Carnegie Observatories Astrophysics Series, Vol. 1, ed. L. C. Ho, in press (astro-ph/0304122)
- (22) Fiore, F., Brusa, M., Cocchia, F., et al. 2003, in press (astro-ph/0306556)
- (23) Fiore, F., La Franca, F., Giommi, P., Elvis, M., Matt, G., Comastri, A., Molendi, S., Gioia, I 1999, MNRAS, 306, 55
- (24) Fiore, F., La Franca, F., Vignali, C., et al. 2000, New Astronomy, 5, 143
- (25) Fiore, F., Giommi, P., Vignali, C., Comastri, A., Matt, G., Perola, G. C., La Franca, F., Molendi, S., Tamburelli, F., Antonelli, L. A 2001, MNRAS, 327, 771
- (26) Franceschini, A., Braito, V., Fadda, D. 2002, MNRAS, 335, 51
- (27) Georgantopoulos, I. 2000, MNRAS, 315, 77
- (28) Giacconi, R., Zirm, A., Wang, J., et al. 2002, ApJS, 139, 369
- (29) Giommi, P., Perri, M., Fiore, F. 2000, A&A, 362, 799
- (30) Gilli, R., Salvati, M., Hasinger, G. 2001, A&A, 366, 407
- (31) Griffiths, R. E., Georgantopoulos, I., Boyle, B.J., Stewart, G. C., Shanks, T., Della Ceca, R., 1995, MNRAS, 275, 77
- (32) Guainazzi, M., Fiore, F., Matt, G., Perola, G.C., 2001, MNRAS, 327, 323
- (33) Hasinger, G., Altieri, B., Arnaud, M., et al. 2001, A&A, 365, L45
- (34) Hewett, P.C., Foltz, C.B., Chaffee, F.H. 1995, AJ, 109, 1498
- (35) La Franca, F. Fiore, F., Vignali, C., et al. 2002, ApJ, 570, 100
- (36) La Franca, F., Cristiani, S. & Barbieri, C. 1992, AJ, 103, 1062
- (37) Lehmann, I., Hasinger, G., Schmidt, M. et al. 2001, A&A, 371, 833
- (38) Maccacaro, T., Gioia, I.M., Schild, R., Maccagni, D., Stocke, J.T., 1987, in proc. “Observational Evidence of Activity in Galaxies”, IAU Symp., 121, 469
- (39) Maccacaro, T., Perola, G.C., Elvis, M., 1982, ApJ, 257, 47
- (40) Madau, P., Ghisellini, G., Fabian, A.C. 1994, MNRAS, 270, 17
- (41) Matt, G., Barcaroli, R., Belloni, T. et al. 1998, A&A, 334, 857
- (42) Mainieri, V., Bergeron, J., Hasinger, et al. 2002, A&A, 393, 425
- (43) Maiolino, R., Marconi, A., Salvati, M., Risaliti, G., Severgnini, P., Oliva, E., La Franca, F., & Vanzi, L. 2001, A&A, 365, 28
- (44) Moretti, A., Campana, S., Lazzati, D., Tagliaferri, G. 2003, ApJ, 588, 696
- (45) Mushotzky, R.F., Cowie, L.L., Barger, A.J., Arnaud, K.A. 2000, Nature, 404, 459
- (46) Nandra, K., Georgantopoulos, I., Ptak, A., Turner, T.J. 2003, ApJ, 582, 615
- (47) Piconcelli, E., Cappi, M., Bassani, L., Di Cocco, G., Dadina, M. 2003, A&A, in press (astro-ph/0309606)
- (48) Piconcelli, E., Cappi, M., Bassani, L., Fiore, F., Di Cocco, G., Stephen, J.B. 2002, A&A, 394, 835
- (49) Panessa, F. & Bassani, L. 2002, A&A, 394, 435
- (50) Pappa, A., Stewart, G.C., Georgantopoulos, I., Griffiths, R. E., Boyle, B. J., Shanks, T. 2001, MNRAS, 327, 499
- (51) Ptak, A., Yaqoob, T., Serlemitsos, P.J., Kunieda, H., Terashima, Y. 1996, ApJ, 459, 542
- (52) Risaliti, G., Maiolino, R. & Salvati, M. 1999, ApJ, 522, 157
- (53) Rosati, P., Tozzi, P., Giacconi, R., et al. 2002, ApJ, 566, 667
- (54) Sambruna, R., Eracleous, M. & Mushotzky, R.F. 1999, ApJ, 526, 60
- (55) Setti, G & Woltjer, L. 1989, A&A, 224, 21
- (56) Severgnini, P., Caccianiga, A., Braito, et al. 2003, A&A, 406, 483
- (57) Stocke, J. T., Morris, L. M., Gioia, I. M., Maccacaro, T., Schild, R., Wolter, A., Fleming, T.A., & Henry, J. P. 1991, ApJS, 76, 813
- (58) Tananbaum, H., Tucker, W., Prestwich, A., Remillard, R., 1997, ApJ, 476, 83
- (59) Turner, T. J., George, I. M., Nandra, K., Mushotzky, R. F. 1997a, ApJS, 113, 23
- (60) Turner, T. J., George, I. M., Nandra, K., Mushotzky, R. F. 1997b, ApJ, 488, 164
- (61) Ueda, Y., Akiyama, M., Ohta, K., Miyaji, T. 2003, ApJ, in press (astro-ph/0308140)
- (62) Vaughan, S., Reeves, J., Warwick, R., Edelson, R. 1999, MNRAS, 309, 113
- (63) Veilleux, S. & Osterbrock, D.E. 1987, ApJS, 63, 295
- (64) Véron-Cetty, M.-P. & Véron, P. 2001, A&A, 374, 92
- (65) Véron-Cetty, M.-P., Véron, P. & Gonçalves, A.C. 2001, A&A, 372, 730
- (66) Wolff, M.T., Wood, K.S., Imamura, J.N., Middleditch, J., Steiman-Cameron, T.Y. 1999, ApJ, 526, 435
Appendix A Notes on individual objects
A.1 XBSJ014100.6–675328: The polar BL Hyi
XBSJ014100.6–675328 (BL Hyi) is a known AM Herculis object (a polar), i.e. a binary system composed of a magnetic white dwarf and a low-mass star. These sources are characterized by soft and hard X-ray variable emission, modulated on the rotational period of the white dwarf. The hard X-ray properties of BL Hyi have been discussed by Wolff et al. (1999) on the basis of RXTE data and by Matt et al. (1998) by using ASCA and BeppoSAX observations.
The X-ray spectrum of XBSJ014100.6–675328 is well fitted by a unabsorbed power-law model with =1.53 plus a thermal component (kT=55 eV) and an emission line at E=6.70.2 keV. The 2-10 keV flux is 6.110-12 erg s-1 cm-2.
A.2 XBSJ031146.1-550702
XBSJ031146.1-550702 has been classified as Sy1.9 and its X-ray emission does not show significant absorption, as described in the text. Other examples of Sy2 objects with low X-ray absorption have been recently presented by Panessa & Bassani (2002) and Barcons, Carrera & Ceballos (2003). Panessa & Bassani (2002) have suggested that a large-scale dusty environment (e.g. dust lanes or an HII region), instead of an obscuring torus close to the nucleus, can hide the BLR without producing a significant X-ray absorption (N1022 cm-2 or slightly lower than this value). However, the upper limit on the NH value estimated for XBSJ031146.1-550702 is 1.31020 cm-2 which is almost two orders of magnitude below the value expected in the scenario proposed by Panessa & Bassani (2002). Another possibility considered by Panessa & Bassani (2002) is that the BLR is not efficiently activated due to an extremely sub-Eddington accretion rate. This scenario, however, is expected to work for low-luminosity AGNs (LLAGN, L1042 erg s-1) which represent a large fraction of the Sy2 studied by Panessa & Bassani (2002). On the contrary, the source XBSJ031146.1-550702 has an X-ray luminosity of 2.21043 erg s-1, thus significantly higher than the luminosity expected in LLAGNs. Two objects similar to XBSJ031146.1-550702 in terms of X-ray luminosity (1042-1043 erg s-1) and low NH value (1020- 1021 cm-2) are NGC~7679 (Della Ceca et al. 2001) and IRAS00317-2142 (Georgantopoulos 2000). These two sources are dominated by the starburst emission in the optical and by an unabsorbed AGN in the X-ray. Selective obscuration due to a dusty ionized absorber has been invoked to explain the observed X-ray and optical properties of these sources. A more detailed analysis of XBSJ031146.1-550702 is required to assess whether a similar interpretation could also be applied to this source.
Another possibility is that XBSJ031146.1-550702 is a Compton-thick source (N1024 cm-2). In this case, the observed X-ray spectrum represent only the fraction of the total emission reflected towards the observer. If this hypothesis is correct, a strong neutral iron K line is expected at 6.4 keV (source rest frame), corresponding to 5.5 keV in the observer rest frame, i.e. very close to the extreme end of the observed spectrum. In this spectral region an upper limit on the emission line is very poorly determined (EW2 keV) and cannot be used to rule out the Compton thick nature of the source.
In principle, the thickness parameter FX/F[OIII], where FX is the 2-10 keV observed flux (corrected for the Galactic absorption) and F[OIII] is the reddening corrected flux of the [OIII]5007Å line, could be used to assess the Compton thickness of the source. According to Bassani et al. (1999), in fact, a Compton-thick source should present low values of the FX/F[OIII] ratios (below 1) while Compton-thin sources should have FX/F[OIII] significantly above 1. As previously stated, the optical spectra collected by us do not have an absolute flux calibration so the measurement of the FX/F[OIII] flux ratio is not simple. However, considering the good weather conditions of the night during the observation of XBSJ031146.1-550702 and taking into account the flux lost due to the slit width we have obtained a rough absolute calibration for this spectrum. The result is in good agreement with the APM photometric point (red magnitude). We have thus estimated the line flux and the FX/F[OIII] flux ratio666 The value F[OIII] should be corrected for the reddening based on the Balmer decrement as explained in Bassani et al. (1999). In XBSJ031146.1-550702, however, the estimate of the Balmer decrement is difficult due to the presence of the broad H component and the relatively poor S/N ratio of the available spectrum. We attempted a de-blending of the two components in the H profile and we have obtained H/H2–3 which indicates that the reddening should not be very important. For this reason we have not applied any reddening correction. . The computed ratio is between 8 and 30, hence suggesting a Compton-thin nature for this object. Clearly, better data are required to put this estimate on a firmer ground.
A.3 XBSJ033845.7-352253
The X-ray spectrum of this NLRG is not fitted by a simple absorbed power-law or a leaky absorbed power-law models. A reasonable fit is obtained by allowing the two spectral indices free to vary. The best fit gives a very steep slope ( = 2.71) at low energies plus a flatter slope ( = 1.69) at higher energies. Alternatively, a leaky absorbed (NH=2.81023 cm-2) power-law with frozen to 1.9 plus a thermal (Raymond-Smith) model with kT=0.16 keV gives an acceptable fit. The simple absorbed power-law plus a thermal component, instead, is unable to fit both the high and the low energy parts of the spectrum.
XBSJ033845.7-352253 is a known Narrow Line Radio galaxy (NLRG, Carter & Malin 1983) resolved in the NRAO VLA Sky Survey (NVSS, Condon et al. 1998) into two bright radio-lobes with a total radio flux of 2.1 Jy corresponding to a radio power of 7.81025 W Hz-1 at 1.4 GHz. In principle, the flat component ( = 1.69) of the 2 power-laws model could be ascribed to the non-thermal emission from the jet. However, this component is usually not observed in lobe-dominated radio-loud AGNs, like XBSJ033845.7-352253, where relativistic beaming is not important while it is probably at the origin of the flat X-ray spectrum observed in core-dominated AGNs (e.g. Sambruna, Eracleous & Mushotzky 1999).
We consider the second model, which includes a thermal emission, as more appropriate. In fact, the presence of a thermal emission is a quite frequent feature in NLRGs. For instance, 50% of the NLRGs observed with ASCA (Sambruna, Eracleous & Mushotzky 1999) show a thermal component; the 0.1-2.4 keV unabsorbed luminosity of the thermal emission found in XBSJ033845.7-352253 is 21041 erg s-1, in the range of luminosity obtained by Sambruna, Eracleous & Mushotzky (1999) (L1040-43 ergs s-1).
Therefore, we have adopted the thermal plus leaky absorbed power-law model for XBSJ033845.7-352253.
A.4 XBSJ041108.1–71134
This is one of the optically faintest sources in the sample (R=20.25). The noisy spectrum collected in 2400 seconds with EFOSC2 shows only one weak broad emission line which we have tentatively identified as the MgII2798Å line. With this assumption, the redshift is 0.923. The equivalent width of the line is 10-15Å (source rest-frame) which is close to the border-line of the BL Lac objects classification (EW5Å, e.g. Stocke et al. 1991). The spectrum is reported in Figure 13. A firmer classification and z estimate requires a better signal-to-noise spectrum.

Appendix B X-ray spectra
In this appendix we present the spectra of the extragalactic sources (all AGNs) present in the HBS28 sample.