J1432+158: the most distant giant quasar
Abstract
We present low-frequency, GMRT (Giant Metrewave Radio Telescope) observations at 333 and 617 MHz of the most-distant giant quasar, J1432+158, which is at a redshift of 1.005. The radio source has a total angular extent of 168 arcsec, corresponding to a projected linear size of 1.35 Mpc. This makes it presently the largest single object observed beyond a redshift of one. The objectives of the GMRT observations were to investigate the possibility of detecting a bridge of emission at low frequencies, which may be suppressed due to inverse-Compton losses against the cosmic microwave background radiation. We detect a jet-like structure connecting the core to the western hotspot, while the eastern hotspot is found to be largely tail-less with no significant bridge emission. The estimated life-time for the radiating electrons in the tail of the western lobe appears smaller than the travel time of the radiating particles from the hotspot, suggesting either in-situ acceleration or dissipation of energy by the jet at this location. The pressure of the intergalactic medium at estimated from the minimum energy density calculations appears to be marginally lower than the value extrapolated from nearby giant radio galaxies.
keywords:
galaxies: active – galaxies: jets – galaxies: nuclei – quasars: general – radio continuum: galaxies1 Introduction
The giant radio sources (GRSs), defined to be those with a projected linear size greater than about a Mpc (Ho=71 km s-1 Mpc-1, =0.27, =0.73, Spergel et al. 2003), are the largest single objects in the Universe, extending well beyond the haloes of their parent galaxies. The GRSs are useful for studying the evolution of radio sources with age, and also probing the intergalactic medium (IGM) and its evolution with redshift. Statistical analysis of known giants show a dearth of GRSs of high luminosity, and no objects extending beyond about 2 Mpc, with the sole exception of 3C236 (e.g. Ishwara-Chandra & Saikia 1999, hereinafter referred to as IC99; Schoenmakers et al. 2000, 2001, and references therein). Although the distribution of radio sources in the luminosity-linear size or P-D diagram is broadly consistent with models for the evolution of radio sources (e.g. Kaiser & Alexander 1999; Blundell et al. 1999 and references therein), it is not clear whether the sharp drop in the number of objects beyond about 2 Mpc is also partly due to possible selection effects.
There is also a dearth of GRSs at cosmologically interesting redshifts of greater than 1. In the WENSS sample, the median redshift of the new GRSs is only 0.1404 compared with 0.099 for the already known GRSs in the sample. The marginally higher redshift is due to the WENSS survey selecting sources at lower flux densities (Schoenmakers et al. 2001). A number of GRSs selected from the 7C survey have redshifts in the range of 0.3 to 0.9 (Cotter, Rawlings & Saunders 1996). Two of the giants from the MRC 1-Jy sample, which were observed by IC99, namely 0437224 and 1025229 have redshifts of 0.84 and 0.309 respectively. For a new sample of large radio sources compiled from the NVSS and FIRST surveys (Machalski, Jamrozy & Zola 2001; Chyży et al. 2003), the redshifts range from 0.07 to 0.8 with a median value of 0.2. The highest redshift giant source known so far is 4C 39.24, which is associated with a galaxy at a redshift of 1.88 and has been studied in some detail by Law-Green et al. (1995).
In this paper, we present low-frequency, GMRT (Giant Metrewave Radio Telescope) observations at 333 and 617 MHz of the most-distant giant quasar, J1432+158, which is at a redshift of 1.005 (see Hintzen, Ulvestad & Owen 1983), so that 1′′ corresponds to 8.051 kpc, and discuss the nature of this source. One of the effects which makes it difficult to identify giants at large redshifts is the suppression of bridge emission by inverse-Compton losses against the cosmic microwave background radiation, which increases strongly with redshift. This could lead to ‘tail-less’ hotspots leading to their classification as independent radio sources (e.g. Baldwin 1982). The problem would be more acute if there are no detected cores and radio jets. The objectives of the GMRT observations were to investigate the possibility of detecting bridges of emission at low frequencies, and/or a radio jet, with the broader goal of developing strategies for identifying high-redshift giant sources.
2 Observations
The GMRT observations were made at 333 and 617 MHz on 2002 Aug 24 and 2003 Jul 11 respectively. The GMRT consists of thirty 45-m antennas in an approximate ‘Y’ shape similar to the Very Large Array but with each antenna in a fixed position. Twelve antennas are randomly placed within a central 1 km by 1 km square (the “Central Square”) and the remainder form the irregularly shaped Y (6 on each arm) over a total extent of about 25 km. Further details about the array can be found at the GMRT website at http://www.gmrt.ncra.tifr.res.in. The observations were made in the standard fashion, with each source observation interspersed with observations of the phase calibrator. The source was observed for about 8 hours at 333 MHz, although a significant amount of data had to be edited out due to ionospheric disturbances. The observations at 610 MHz were made in the ‘snapshot’ mode with only about one hour being spent on the source. The primary flux density calibrator was 3C286 whose flux density was estimated on the VLA scale. The phase calibrator at 333 MHz was 3C298 whose flux density was estimated to be 29.60.3 Jy, while at 610 MHz the phase calibrator was J1445+099 with a flux density of 2.390.02 Jy. The data analyses were done using the Astronomical Image Processing Software (AIPS) of the National Radio Astronomy Observatory.
3 Results
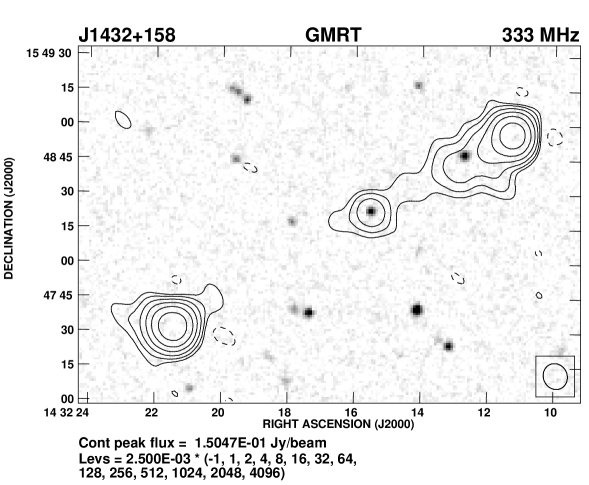
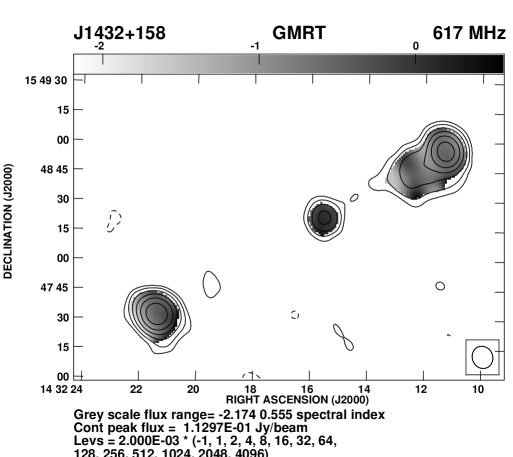
The GMRT images of J1432+158 at 333 and 617 MHz are presented in Fig. 1. The 333-MHz image with an angular resolution of 11.′′410.′′3 along a position angle of 24∘ is superimposed on the optical field, showing the radio core to be coincident with the optical quasar. The 617-MHz image is shown convolved to the same resolution as the 333-MHz image with the spectral index image, , (defined as S), between 333 and 617 MHz being shown in gray. Both the images show the three main components of the source, the western lobe, the weak nuclear component coincident with the position of the optical quasar, and the eastern lobe. The 333-MHz image shows evidence of a jet-like extension towards the north-western component, but no bridge of emission is seen between the eastern hot-spot and the radio core. While the western hotspot appears to have a tail of emission extending towards the core, no significant tail is seen in the eastern hotspot at either 333 or 617 MHz. These images are consistent with the NVSS and FIRST images which are shown in Fig. 2. The higher-resolution FIRST image shows the core to be extended, with a deconvolved angular size of 1.′′61.′′0 along a position angle of 117∘, consistent with the direction of the jet-like structure seen in the 333-MHz image.
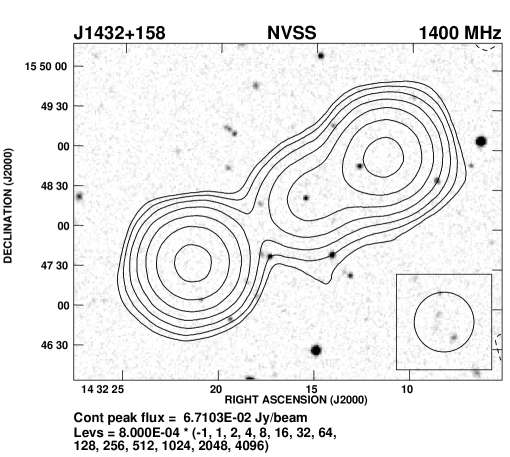
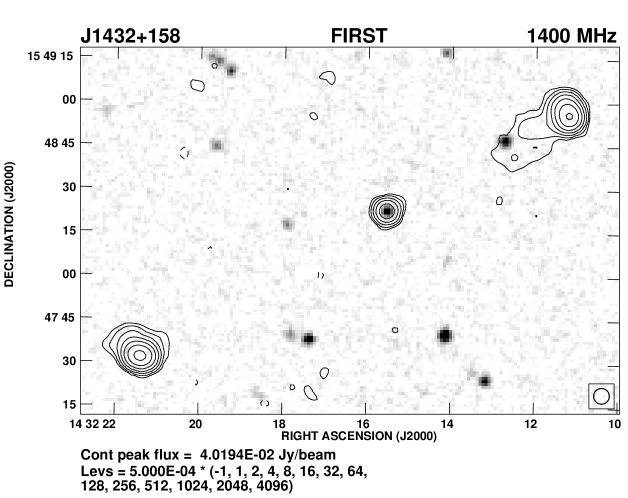
The observed parameters of J1432+158, from both the GMRT images as well as from the NVSS and FIRST images at 1400 MHz are listed in Table 1, which is arranged as follows. Column 1: Name of the telescope, column 2: frequency of observations in units of MHz, columns 3-5: the major and minor axes of the restoring beam in arcsec and its PA in degrees; column 6: the rms noise in units of mJy/beam; column 7: the integrated flux density of the source in mJy estimated by specifying an area around the source; columns 8, 11 and 14: component designation; columns 9 and 10, 12 and 13, and 15 and 16: the peak and total flux densities of each of the components in units of mJy/beam and mJy.
Table 1. The observational parameters and observed properties of J1432+158
| Telescope | Freq. | Beam size | rms | SI | Cp | Sp | St | Cp | Sp | St | Cp | Sp | St | ||
| MHz | ′′ | ′′ | ∘ | mJy | mJy | mJy | mJy | mJy | mJy | mJy | mJy | ||||
| /b | /b | /b | /b | ||||||||||||
| GMRT | 333 | 11.4 | 10.3 | 24 | 0.58 | 510 | W | 135 | 257 | C | 20 | 26 | E | 150 | 218 |
| GMRT | 617 | 11.4 | 10.3 | 24 | 0.58 | 340 | W | 97 | 167 | C | 20 | 22 | E | 113 | 146 |
| VLA-NVSS | 1400 | 45.0 | 45.0 | 0 | 0.28 | 167 | W | 67 | 75 | C | 19 | E | 64 | 71 | |
| VLA-FIRST | 1400 | 5.4 | 5.4 | 0 | 0.15 | 142 | W | 35 | 68 | C | 14 | 15 | E | 40 | 65 |
4 Discussion and remarks
The overall angular size of J1432+158 is 168 arcsec which corresponds to a projected linear size of 1.35 Mpc. This makes it the largest single object observed beyond a redshift of one. Since it is associated with a quasar, it is expected to be inclined at less than 45∘ to the line of sight, implying that its intrinsic size is at least 1.9 Mpc. Given its large size it may be relevant to enquire whether all the three components are physically related. Both the outer components have a steep radio spectrum, while the core has a flat spectrum, similar to standard double-lobed radio sources. The structure of the western lobe and the presence of a jet-like extension from the core towards this lobe, confirms that these two features are indeed related. If the eastern component is unrelated, these two features would form a weak-cored, one-sided source, which is indeed very rare (cf. Saikia et al. 1989). Also, no optical object is found associated with the eastern component in the DSS prints. The collinearity of the structure formed by the three main components, where the complement of the angle formed at the nucleus by the outer hot-spots is only 2∘, and the rough symmetry of the flux density and the location of the outer hotspots strongly suggest that all three components are related. The arm-length and flux density ratio of the lobes are 1.4 and 1.1 respectively, which is similar to that of other giant radio sources (see IC99). However, it is the jet-side which appears to be closer to the radio core, demonstrating the existence of asymmetries on Mpc scales either due to clusters of galaxies or filamentary structures likely to form in hierarchical structure-formation scenarios.

The overall spectral index of the source, and the flux density of the different components using our measurements and values estimated from the NVSS image are shown in Fig. 3. The integrated flux densities at 5 GHz from the NRAO Green Bank survey are also shown (Gregory & Condon 1991; Becker, White & Edwards 1991). The spectral index of the entire source is 0.840.03, while the western and eastern components have steep spectral indices of 0.860.08 and 0.790.06 respectively, and the core has a flat spectral index of 0.040.02. The spectral index image between 333 and 617 MHz (Fig. 1) shows that the component in the tail of the western lobe does not show evidence of any significant spectral steepening. Its spectral index of 0.6 between 333 and 617 MHz is similar to that of the hotspot, the low-frequency spectrum appearing marginally flatter than the higher-frequency value. The flux density of the core measured by Hintzen, Ulvestad & Owen (1983) at 1415 MHz with an angular resolution of 1.′′61.′′0 is 11 mJy compared with the FIRST value of 15 mJy with an angular resolution of 5.′′4 arcsec. The difference is possibly largely due to the different resolutions of these observations.
The minimum energy density for a synchrotron radio source component is given by (see e.g., Miley 1980),
| (1) | |||||
Here is the redshift, (Jy) is the flux density at frequency (GHz), is the spectral index with and (GHz) as the lower and upper cut off frequencies presumed for the radio spectrum, with , and (arcsec) represent the size of the source component along its major and minor radio axes, and is the pathlength through the component along the line of sight in kpc. We have assumed an equal energy distribution between the electrons and the heavy particles, taken the volume filling factor to be unity and also assumed that the magnetic field vector lies in the plane of the sky.
The values of the minimum energy density and magnetic field are J m-3 and 2.0 nT for the western hotspot and J m-3 and 1.7 nT for the eastern one. Here we have integrated the radio emission from 10 MHz to 100 GHz, and used the deconvolved sizes of the components. The values for the component in the the tail of the western lobe are J m-3 and 0.6 nT respectively. Assuming that the spectral break lies beyond 5 GHz, the radiative life-time of the electron is only about yr, with the inverse-Compton losses being a factor of about 5 higher than the synchrotron losses. The projected distance of this feature from the hotspot is 220 kpc, which would take 7106 yr for particles moving backwards with velocities 0.1c (e.g. Ishwara-Chandra et al. 2001). This suggests that there could be re-acceleration of particles in this component, or it could be part of the jet either forming a knot of emission or another hotspot. This is consistent with the lack of spectral steepening in this region.
The minimum energy of the bridges and lobes of GRSs may be used to estimate the pressure in the IGM, whose emissivity is otherwise not directly detectable, by assuming that the lobes are in pressure equilibrium with it (e.g. Subrahmanyan and Saripalli 1993, hereinafter referred to as SS93; Mack et al. 1998; IC99; Schoenmakers et al. 2000). The pressure of such a hot, diffuse, non-relativistic IGM should vary with redshift as . SS93 estimated Pa, based on Saripalli’s (1988) values for minimum energy in the lobes of 8 GRSs, which appeared systematically lower than other similar estimates in the literature. Saripalli (1988) and SS93 suggested that their values were lower as these represented in diffuse bridges as compared to the estimates made for the entire lobes in the literature. However, the expression for used by Saripalli (1988) is lower by a factor of 3.5, and when corrected for this, the median value is J m-3, in good agreement with other estimates in the literature. This corresponds to Pa. There could be a marginal trend for an increase in with redshift (SS93; IC99; Schoenmakers et al. 2000); however, possible caveats using the presently available samples have been highlighted by IC99 and Schoenmakers et al. (2000). Our estimate for the component in the tail of the western lobe in the quasar J1432+158 yields Pa, while the expected value for at =1.005 is Pa. Although this is higher than the measured value by 1.5, estimates of in the diffuse bridges and lobes of a sample of GRSs at cosmologically interesting redshifts of 1, are required to examine critically the assumption of pressure balance with the IGM and the variation of pressure with redshift.
Acknowledgments
The GMRT is a national facility operated by the National Centre for Radio Astrophysics of the Tata Institute of Fundamental Research. This research has made use of the NASA/IPAC extragalactic database (NED) which is operated by the Jet Propulsion Laboratory, Caltech, under contract with the National Aeronautics and Space Administration.
References
- [] Baldwin J.E., 1982, in Heeschen D.S., Wade C.M., eds, Proc. IAU Symp. 97, Extragalactic Radio Sources, Reidel, p 21
- [] Becker R.H., White R.L., Edwards A.L., 1991, ApJS, 75, 1
- [] Blundell, K.M., Rawlings, S., Willott, C.J., 1999, AJ, 117, 677
- [] Cotter G., Rawlings S., Saunders R., 1996, MNRAS, 281, 1081
- [] Chyży K. et al., 2003, Baltic Astron., in press (astro-ph/0310606)
- [] Gregory, P.C., Condon, J.J., 1991, ApJS, 75, 1011
- [] Hintzen P., Ulvestad J., Owen F., 1983, AJ, 88, 709
- [] Ishwara-Chandra C.H., Saikia D.J., 1999, MNRAS, 309, 100 (IC99)
- [] Ishwara-Chandra C.H., Saikia D.J., McCarthy P.J., van Breugel W.J.M., 2001, MNRAS, 323, 460
- [] Kaiser C.R., Alexander P. 1999, MNRAS, 302, 515
- [] Law-Green J.D.B., Eales S.A., Leahy J.P., Rawlings S., Lacy M., 1995, MNRAS, 277, 995
- [] Machalski J., Jamrozy M., Zola S., 2001, A&A, 371, 445
- [] Mack K.-H., Klein U., O’Dea C.P., Willis A.G., Saripalli L., 1998, A&A, 329, 431
- [] Miley G.K., 1980, ARA&A, 18, 165
- [] Saikia D.J., Junor, W., Muxlow, T.W.B., Tzioumis, A.K., 1989, Nature, 339, 286
- [] Saripalli L., 1988, Ph.D. Thesis, Indian Institute of Science, Bangalore
- [] Schoenmakers A.P., Mack K.-H., de Bruyn A.G., Röttgering H.J.A., Klein U., van der Laan H., 2000, A&AS, 146, 293
- [] Schoenmakers A.P., de Bruyn A.G., Röttgering H.J.A., van der Laan H., 2001, A&A, 374, 861
- [] Spergel D.N. et al., 2003, ApJS, 148, 175
- [] Subrahmanyan R., Saripalli, L., 1993, MNRAS, 260, 908 (SS93)