Is the soft excess in AGN real?
Abstract
We systematically analyse all publicly available XMM-Newton spectra of radio-quiet PG quasars. The soft X-ray excess in these objects is well modelled by an additional, cool, Compton scattering region. However, the remarkably constant temperature derived for this component over the whole sample requires a puzzling fine tuning of the parameters. Instead, we propose that the soft excess is an artifact of strong, relativistically smeared, partially ionized absorption. The strong jump in opacity at 0.7 keV from o vii, o viii and iron can lead to an apparent soft excess below this energy, which is trivially constant since it depends on atomic processes. This can have a dramatic effect on the derived spectrum, which has implications for fitting the relativistic smearing of the reflected iron line emission from the disc.
keywords:
accretion, accretion discs – atomic processes – X-rays: galaxies1 Introduction
The broad-band optical/UV/X-ray spectra of active galactic nuclei (AGN) consist of at least two distinct components. The big blue bump, observed in the optical/UV band, is commonly associated with emission from the optically thick accretion disc, while the approximately power-law X-ray tail seen to much higher energies requires that there is some energy dissipated outside the disc, in an optically thin plasma (e.g. Krolik 1999). Standard models of the accretion disc emission (Shakura & Sunyaev 1973) predict that the maximum temperature of the optically thick material is 20 eV for a M⊙ black hole accreting at the Eddington luminosity. This disc spectrum peaks in the EUV range, so the X-ray spectrum of AGN should be dominated instead by the power-law coronal emission.
This contrasts with the observed soft X-ray spectra of type I AGN (Seyfert 1’s and radio quiet quasars). The intrinsic 0.2–10 keV emission often shows a strong, broad soft excess below 2 keV. The origin of this component is not clear. Plainly, it is too hot to be standard disc emission from a supermassive black hole. One popular possibility is that there are two Comptonizing regions. The hot one has a temperature 100 keV and low optical depth, , and is responsible for the high-energy emission (e.g. Zdziarski et al. 1996). The cool region with higher optical depth smoothly extends the disc emission up to soft X-ray energies (e.g. Laor et al. 1997). Physically, this second component could arise e.g. in the transition region between a disc and optically thin inner flow (Magdziarz et al. 1998) or in a warm skin on the disc surface (Janiuk, Czerny & Madejski 2001). Using the disc as seed photons for a cool Compton scattering cloud can also explain the strong correlation between optical/UV and soft X-ray luminosity (e.g. Walter & Fink 1993; Marshall et al. 1997) and fits well with the inferred shape of the UV-to-soft X-ray continuum in quasars (Zheng et al. 1997).
However, changing the disc seed photons should have some impact on the Comptonization region. An electron cloud of constant optical depth and heating power, , has an equilibrium temperature which is lower for stronger seed photon illumination, (e.g. Page et al. 2003). The Comptonization model for the soft excess makes the clear prediction that the soft excess shape should correlate with .
We might also expect that the AGN spectra should be analogous to the Galactic black holes (GBH), modulo whatever changes are produced by changing the accretion disc temperature. At high luminosities, the Galactic binary systems have X-ray spectra consisting of the disc emission and a Comptonized tail of variable relative intensity. The range of soft-state spectra (from ultrasoft through high to very high states) seen in GBH requires changing by over 2 orders of magnitude (Done & Gierliński 2003). Hence we would expect that a sample of soft state (disc dominated) AGN should show a corresponding range in shape of the soft X-ray excess.
In this Letter we quantify the soft excess properties on a large sample of good quality AGN spectra from the XMM-Newton. We use these to test the Comptonization model for the origin of the soft X-ray excess.
2 Data reduction
We use the bright quasar sample (Boroson & Green 1992) as a starting point, as these objects (mainly radio quiet quasars) are selected by their strong blue/UV continuum flux, i.e. have a strong accretion disc component. These are all well studied, so have known (and fairly small) values, together with good bolometric luminosity and mass estimates (Boroson 2002; Woo & Urry 2002). This means their luminosity can be estimated as a fraction of Eddington luminosity, , with the majority spanning the range between . The observed disc dominance of the AGN spectra in this range is as expected from corresponding spectra from accreting GBH (e.g. Done & Gierliński 2003)
From this sample we selected all the publicly available (as in September 2003) X-ray spectra from XMM-Newton archive. After excluding the radio-loud (PG 0007+106, PG 1226+023 and PG 1425+267), heavily-absorbed (PG 1114+445 and PG 2214+139) and very faint (PG 1411+442) objects, we finally obtained a sample of 26 sources, with black hole masses, and bolometric luminosities in Eddington units, taken from Boroson (2002), as shown in Table 1.
| PG number | M | Obs. date | ||
|---|---|---|---|---|
| 0003+199 | 0.025 | 7.07 | 0.62 | 2000-12-25 |
| 0050+124 | 0.061 | 7.13 | 1.81 | 2002-06-22 |
| 0157+001 | 0.163 | 8.00 | 0.54 | 2000-07-29 |
| 0804+761 | 0.100 | 8.21 | 0.68 | 2000-11-04 |
| 0844+349 | 0.064 | 7.66 | 0.41 | 2000-11-04 |
| 0947+396 | 0.206 | 8.46 | 0.14 | 2001-11-03 |
| 0953+414 | 0.239 | 8.52 | 0.58 | 2001-11-22 |
| 1048+342 | 0.167 | 8.14 | 0.25 | 2002-05-13 |
| 1115+407 | 0.154 | 7.44 | 0.82 | 2002-05-17 |
| 1116+215 | 0.177 | 8.41 | 0.74 | 2001-12-02 |
| 1202+281 | 0.165 | 8.37 | 0.11 | 2002-05-30 |
| 1211+143 | 0.085 | 7.81 | 1.14 | 2001-06-15 |
| 1244+026 | 0.048 | 6.24 | 3.97 | 2001-06-17 |
| 1307+085 | 0.155 | 8.50 | 0.24 | 2002-06-13 |
| 1309+355 | 0.184 | 8.20 | 0.33 | 2002-06-10 |
| 1322+659 | 0.168 | 7.74 | 0.81 | 2002-05-11 |
| 1352+183 | 0.158 | 8.20 | 0.29 | 2002-07-20 |
| 1402+261 | 0.164 | 7.76 | 1.24 | 2002-01-27 |
| 1404+226 | 0.098 | 6.65 | 1.90 | 2001-06-18 |
| 1426+015 | 0.086 | 8.79 | 0.10 | 2000-07-28 |
| 1427+480 | 0.211 | 7.86 | 0.57 | 2002-05-31 |
| 1440+356 | 0.077 | 7.28 | 1.07 | 2001-12-23 |
| 1444+407 | 0.267 | 8.17 | 0.71 | 2002-08-11 |
| 1501+106 | 0.036 | 8.23 | 0.12 | 2001-01-14 |
| 1613+658 | 0.138 | 9.48 | 0.03 | 2001-08-29 |
| 1626+554 | 0.132 | 8.24 | 0.15 | 2002-05-05 |
We extracted the X-ray spectra from EPIC MOS1, MOS2 and PN using sas 5.4 software. During the PG 1501+106 observation MOS1 was in timing mode, so only MOS2 data were available. Only X-ray events corresponding to patterns 0–12 (MOS) and 0–4 (PN) were used. Source and background spectra were extracted from circular regions of 45 arcsec in radius around the object and in an offset position clear of other sources, respectively. For spectral analysis we used xspec software, fitting MOS and PN spectra simultaneously in the 0.3–10 keV energy band.
3 Spectral fitting and results
We fit each spectrum with a model consisting of two Comptonization continua. The hot component produces the power-law spectrum, while the cool one creates the soft excess. We use thcomp (Zdziarski, Johnson & Magdziarz 1996) to describe the shape of these spectra. This is based on an approximate solution of the Kompaneets (1956) equation, and is parameterized by the asymptotic photon spectral index and electron temperature. We assume that the seed photons for both Compton scattering regions come from a disc blackbody of temperature 10 eV, which is far outside the 0.3–10 keV energy band so has no effect on the observed spectral shape. We fix the temperature of the hot component at 100 keV, as its high-energy cutoff is not seen below 10 keV so the temperature cannot be constrained by the data. The cool component temperature is well constrained, but its spectral index (or equivalently, optical depth) is not, so we fix this at . This intrinsic spectrum is absorbed by column , which we allow to vary freely.
The soft excess is statistically significant in all the spectra. The smallest change in (for PG 0157+001) is 26 for two extra degrees of freedom compared to the fits without a cool component, giving an F-test significance level of . The statistical significance of the soft excess is not necessarily proportional to its strength as the signal-to-noise ratio varies from spectrum to spectrum.
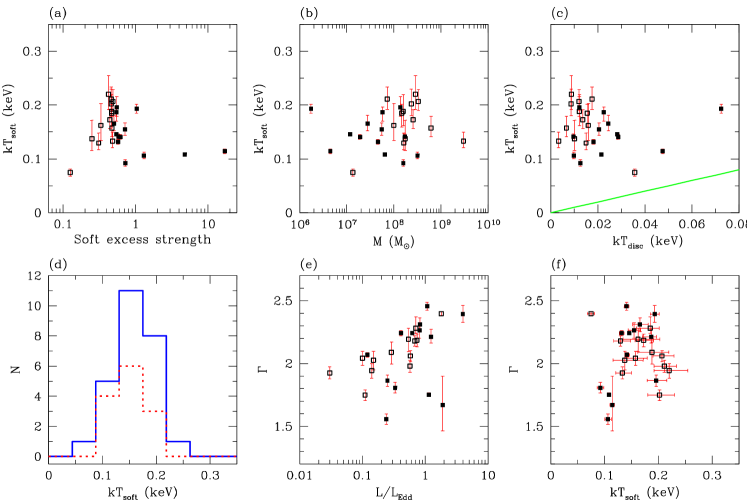
Fig. 1a shows the characteristics of the soft excess for each object, plotting temperature against strength of the soft excess, , measured by the ratio of unabsorbed 0.3–2 keV flux in the cool and hot components. The highest excesses of = 4.7 and 17 is in PG 1211+143 and PG 1404+226, respectively, though the spectrum of the latter one has poor signal-to-noise. Other sources have . We use the condition to crudely divide our sample into objects with strong and weak excess, denoted by filled and open symbols respectively in Fig. 1.
The most striking property of the soft excess is its constancy in temperature. It is distributed in a very narrow range of values between 0.1 and 0.2 keV (Fig. 1a), with tendency to concentrate close to 0.1 keV for sources with large . The mean temperature is keV and variance keV. Even more interesting is the independence of on the black hole mass (Fig. 1b). The maximum temperature of the standard Shakura-Sunyaev disc is , so we can estimate it from the values given in Table 1. Applying a spectral hardening factor of 1.8 (Shimura & Takahara 1995) we find that the expected disc temperature should be between 3 and 70 eV. This is a rough estimate only, as masses and luminosities are uncertain, as is the fraction of the total luminosity released in the disc. Nevertheless, two things are clear (see Fig. 1c). Firstly, the observed soft excess temperatures of 0.1 keV are too high to be direct disc emission. Secondly, the range of variation in (about a factor 2) is much smaller than the range in disc temperatures (about factor 20). Thirdly, there is no correlation between and .
The hot component, represented here by Comptonization of the disc photons, is simply a power law in the 0.3–10 keV band, since the seed photons are well below and the high-energy rollover is well above the observed energy band. Its photon spectral index, , varies between 1.5 and 2.5. There is a weak positive correlation between and luminosity (see Fig. 1e), though unlike the X-ray binaries, there are bright sources () with hard spectra (). In particular, PG 1211+143 has near Eddington luminosity. There is no obvious correlation between the soft excess temperature and (Fig. 1f).
The model generally gives a good fit to the spectra, with reduced for most of the data. However, in a few of the highest signal-to-noise spectra there are clear narrow residual features from absorption which are not modelled by our continuum fits. These are most noticeable for PG 1211+143, where . Detailed studies of its XMM-Newton spectrum has revealed the presence of complex ionized absorption (Pounds et al. 2003). Adding multiple absorbers, together with ionized reflection from the accretion disc, improves the fit () but only weakly affects the underlying continuum. In particular, the strength and temperature of the soft excess remain very similar.
4 The Nature of the soft excess
Comptonization of the accretion disc spectrum can successfully fit the shape of the soft X-ray excess below 2 keV in all these Seyfert 1/radio-quiet quasars. However, the temperature of this putative Comptonizing region remains remarkably constant at 0.1–0.2 keV over all 26 different objects, which have a large range in mass and luminosity, hence in the disc temperature and, most likely, ratio of the power released in hot plasma to that of the disc.
We use the eqpair Comptonization code (Coppi 1999) to quantify possible changes in the Comptonized spectrum. The key advantage of this code is that it does not assume the steady-state electron distribution, rather it calculates it by balancing heating (primarily the injected power in the hot electrons, ) and cooling (proportional to the power in seed photons, ). The spectral shape is mostly determined by the ratio , which is dependent on the intrinsic mechanisms and geometry of the source.
We expect the disc temperature to vary by factor 20 within our sample (see Fig. 1c). This translates into variation by factor 3 in the equilibrium electron temperature of the Comptonizing plasma with constant and optical depth. Thus, a large variation in the seed photon temperature can lead to only a moderate change in the electron temperature, and it seems feasible that the soft excess can be produced by a cool, optically thick, Comptonized component.
This however, requires constancy of and – to lesser extent – optical depth. Large variations in would lead to significant change in both index and temperature of the Comptonized spectrum, which is inconsistent with our measurements. Constancy of could be explained e.g. if the seed photons were dominated by reprocessed flux in a constant (disc-corona?) geometry. Nonetheless the hot Comptonized component is variable. The observed span in its spectral index (see Fig. 1e), between 1.5 and 2.5 requires a corresponding change in from 10 to 0.5. Thus the two Comptonizing regions have to be spatially separate and independent.
This constancy of soft spectral shape is even more puzzling when compared to GBH, which show a wide variety of spectral shapes for (e.g. Done & Gierliński 2003). If the accretion properties simply scale up with the black hole mass, we should see a similar variety in AGN, yet we don’t. The soft-state spectra of GBH can be modelled by Comptonization on two electron distributions: the cooler thermal and the hotter power law (e.g. Gierliński & Done 2003, Zdziarski et al. 2001). The thermal electrons create a soft ‘hump’ above the power law, but their derived moderate optical depth is much smaller than 50, required here. This gives rise to a much smoother and broader shape than the observed soft excess in e.g. PG 1211+143.
5 Alternative solutions
The universality of the soft excess shape has been noticed before (e.g. Walter & Fink 1993; Czerny et al. 2003). It seems to be much simpler to explain if it is set by some characteristic, physical energy of the system, such as given by atomic transitions. One obvious feature in the soft energy band is the the strong jump in opacity associated with lines and edges of ionized o vii, o viii and iron at 0.7 keV. This could have an impact either through absorption or through reflection.
The reflection probability depends on the balance between electron scattering and photoelectric absorption opacity, so the decrease in opacity below 0.7 keV causes a strong increase in the reflected fraction below this energy for an ionized disc. Czerny & Życki (1994) showed that such ionized reflection from a disc could fit the moderate resolution ROSAT data on the soft excess in some AGN, though they required a fairly high reflected fraction, with . Higher resolution data from XMM-Newton show no obvious spectral features at 0.7 keV, so if atomic features are responsible for the soft excess then they must be strongly smeared by high velocities and/or gravitational redshifts (Ross, Fabian & Ballantyne 2002). Inner disc, ionized reflected spectra can fit the strong soft excesses seen in the XMM-Newton spectrum of 1H 0707–495 and MCG-6-30-15 (Fabian et al. 2002; Ballantyne et al. 2003), although the models require a puzzling range of ionization states, and a geometry in which the direct emission from the hard X-ray source is hidden.
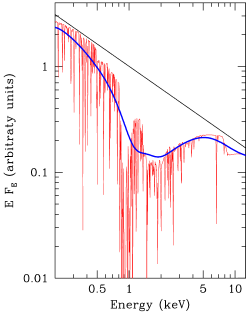
Here we propose instead that the soft excess arises from relativistically smeared absorption, where the characteristic atomic spectral features are again masked by high velocities. Physically, this absorption could arise from a differentially rotating, outflowing disc wind (Murray & Chiang 1997). The complex velocity structure of such a wind is beyond the scope of this Letter, but we roughly model it by a Gaussian velocity dispersion with width convolved with xstar (Bautista & Kallman 2001) model of the ionized absorption column. This smeared absorption produces a smooth ‘hole’ in the spectrum which results in an apparent soft excess at low energies, and hardens the spectrum at higher energies (see Fig. 2). The smearing is so large that all the features, including the iron line edge at 7 keV, are removed from the absorption spectrum, leaving a smooth continuum (solid thick curve in Fig. 2).
Using this complex absorption, we can fit the spectrum of PG 1211+143 with a single Comptonized continuum, without requiring an additional cool Comptonized component to model the soft excess. Including the additional narrow absorption components and reflection from the disc () gives a slightly worse fit than with the two-component model, with . However, the residuals are concentrated at keV, consistent with emission from o vii/o viii in the wind, or perhaps indicating the inadequacies of a Gaussian velocity profile. Apart from these details, the overall continuum shape is well matched by this model. We leave detailed analysis of this and other sources for future work.
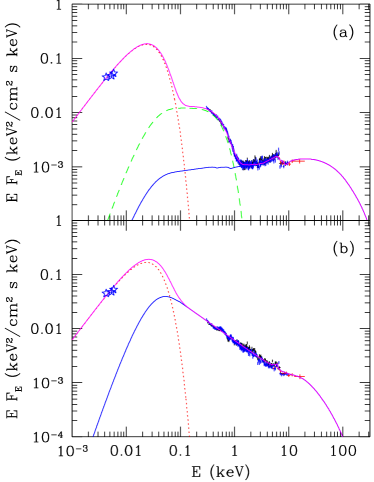
Fig. 3 shows a comparison of the deconvolved and unabsorbed spectra of PG 1211+143 for the two models of the soft excess. The model with a separate Comptonization component (Fig. 3a) has a strong soft excess, with a hard spectrum at high energies (). By contrast, for the smeared, ionized absorber, there is only a single continuum component, with much steeper spectral index (). This is much closer to what is seen in the high luminosity GBH systems, which generally have .
6 Conclusions
The soft X-ray excess in radio quiet quasars can be modelled by including a second, cool Comptonizing component. However, the observed range in its temperature is very small, despite large changes in black hole mass, luminosity and 2-10 keV X-ray spectral index across the sample. This requires some fine tuning of the parameters, and strongly contrasts with the analogous soft-state GBH, with large diversity of the X-ray spectral shape over a comparable range in .
Instead, we propose that the soft excess is an artifact of ionized absorption in a wind from the inner disc. The strong jump in opacity at 0.7 keV seen from o vii, o viii and iron in moderately ionized material can give an apparent soft excess whose energy is fixed by atomic physics, so trivially is constant across a wide range of objects. If this absorber is associated with an accretion disc wind then its complex velocity structure (differentially rotating and outflowing) gives rise to substantial broadening which masks the sharp atomic features, leaving a smooth continuum. In PG 1211+143 we show that such models can fit the data without requiring a separate soft excess. This can dramatically change the inferred intrinsic spectral slope, which has obvious implications for the robustness of the derived parameters for the broad iron line from the disc. The much softer intrinsic spectrum is now consistent with the soft continua seen from high-luminosity GBH. It also means that these two models for the origin of the soft excess can be unambiguously tested with high signal-to-noise, broad bandpass (0.1–50 keV) data, such as will be obtained by ASTRO-E2.
Acknowledgements
We thank Todd Boroson for the black hole data.
References
- [\citeauthoryearBallantyne, Vaughan, & Fabian2003] Ballantyne D. R., Vaughan S., Fabian A. C., 2003, MNRAS, 342, 239
- [\citeauthoryearBautista & Kallman2001] Bautista M. A., Kallman T. R., 2001, ApJS, 134, 139
- [\citeauthoryearBoroson2002] Boroson T. A., 2002, ApJ, 565, 78
- [\citeauthoryearBoroson & Green1992] Boroson T. A., Green R. F., 1992, ApJS, 80, 109
- [] Coppi P. S., 1999, in ASP Conf. Ser. 161, High Energy Processes in Accreting Black Holes, ed. J. Poutanen & R. Svensson (San Francisco: ASP), 375
- [\citeauthoryearCzerny & Zycki1994] Czerny B., Życki P. T., 1994, ApJ, 431, L5
- [] Czerny B., Nikołajuk M., Różańska A., Dumont A.-M., preprint, astro-ph/0309242
- [\citeauthoryearDone & Gierliński2003] Done C., Gierliński M., 2003, MNRAS, 342, 1041
- [\citeauthoryearFabian et al.2002] Fabian A. C., Ballantyne D. R., Merloni A., Vaughan S., Iwasawa K., Boller T., 2002, MNRAS, 331, L35
- [\citeauthoryearGierliński & Done2003] Gierliński M., Done C., 2003, MNRAS, 342, 1083
- [\citeauthoryearGierliński et al.1999] Gierliński M., Zdziarski A. A., Poutanen J., Coppi P. S., Ebisawa K., Johnson W. N., 1999, MNRAS, 309, 496
- [\citeauthoryearJaniuk, Czerny, & Madejski2001] Janiuk A., Czerny B., Madejski G. M., 2001, ApJ, 557, 408
- [] Kompaneets A. S., 1956, Soviet Phys., JETP 31, 876
- [] Krolik J. H., 1999, Active Galactic Nuclei: from the Central Black Hole to the Galactic Environment, Princeton University Press, Princeton
- [\citeauthoryearLaor et al.1997] Laor A., Fiore F., Elvis M., Wilkes B. J., McDowell J. C., 1997, ApJ, 477, 93
- [\citeauthoryearMagdziarz et al.1998] Magdziarz P., Blaes O. M., Zdziarski A. A., Johnson W. N., Smith D. A., 1998, MNRAS, 301, 179
- [\citeauthoryearMarshall et al.1997] Marshall H. L. et al., 1997, ApJ, 479, 222
- [\citeauthoryearMurray & Chiang1997] Murray N., Chiang J., 1997, ApJ, 474, 91
- [] Page K. L., Turner M. J. L., Done C., O’Brien P. T., Reeves J. N., Sembay S., Stuhlinger M., preprint, astro-ph/0312148
- [\citeauthoryearPounds et al.2003] Pounds K. A., Reeves J. N., King A. R., Page K. L., O’Brien P. T., Turner M. J. L., 2003, MNRAS, 345, 705
- [\citeauthoryearRoss, Fabian, & Ballantyne2002] Ross R. R., Fabian A. C., Ballantyne D. R., 2002, MNRAS, 336, 315
- [\citeauthoryearShakura & Sunyaev1973] Shakura N. I., Sunyaev R. A., 1973, A&A, 24, 337
- [\citeauthoryearShimura & Takahara1995] Shimura T., Takahara F., 1995, ApJ, 445, 780
- [\citeauthoryearWalter & Fink1993] Walter R., Fink H. H., 1993, A&A, 274, 105
- [\citeauthoryearWoo & Urry2002] Woo J., Urry C. M., 2002, ApJ, 579, 530
- [\citeauthoryearZdziarski, Johnson, & Magdziarz1996] Zdziarski A. A., Johnson W. N., Magdziarz P., 1996, MNRAS, 283, 193
- [\citeauthoryearZdziarski et al.1996] Zdziarski A. A., Gierliński M., Gondek D., Magdziarz P., 1996, A&AS, 120, 553
- [\citeauthoryearZdziarski et al.2001] Zdziarski A. A., Grove J. E., Poutanen J., Rao A. R., Vadawale S. V., 2001, ApJ, 554, L45
- [\citeauthoryearZheng et al.1997] Zheng W., Kriss G. A., Telfer R. C., Grimes J. P., Davidsen A. F., 1997, ApJ, 475, 469