7323
A. F. Martínez Fiorenzano
11email: fiorenza@ts.astro.it
Search for variation in UVES spectra:
Analysis of C IV and Si IV doublets towards QSO 1101-264
Abstract
Motivated by previous studies of QSO spectra that reported a variation of the fine structure constant , a search for C IV and Si IV doublets was conducted in the absorption spectrum toward QSO 1101-264, obtained by VLT-UVES during the Science Verification. Seven C IV and two Si IV systems were identified and accurate measurements of wavelengths over the redshift range were performed. After a careful selection of pairs of lines, the “Alkali Doublet” method with a derived analitical expression for the error analysis was applied to compute the variation. The result according in magnitud order with previous doublets measurements, corresponds to one Si IV system: / .
keywords:
quasars: individual: QSO 1101-264 – quasars: absorption lines – atomic processes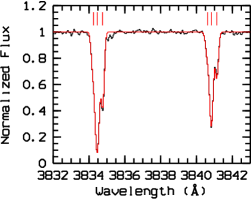
1 Introduction
Modern theories in physics (Super Symmetry Grand Unification Theory,
Superstring and others) predict the dependence of fundamental physical
constants on energy, a prediction supported by high energy experiments
(Okun, 1998), and have cosmological solutions where low-energy values
of these constants vary with the cosmological time
(Varshalovich et al., 2000).
Recent measurements of absorption lines in high resolution QSO
spectra suggest the variation of the fine structure constant
throughout cosmological time (e.g. Webb et al. (2002) and
refs. therein). The use of QSO spectra to search for an variability
takes advantage of the many absorption lines originated in
clouds lying at various redshifts along the line of sight to the QSO.
The measurements are performed by comparing wavelength separations
of transitions observed at various redshifts with their corresponding
laboratory values at . Two approaches exist for this study of
/: the “Alkali Doublet” (AD) method and the
“Many Multiplet” (MM) method.
The former, first applied by Bahcall et al. (1967), considers
alkaline-like ions to compare the wavelength separation of its doublets.
The latter, developed by Dzuba et al. (1999a, b, 2001),
uses wavelengths of various transitions from different multiplets
and ions. In the AD method it is common to use doublets
of ions like C IV and Si IV and the wavelength separation between
and , corresponding to the transitions
and
respectively, is proportional to .
From a MM method analysis based on 128 systems, Webb et al. (2002)
find /
over the redshift range , indicating a smaller value of
in the past.
From an AD method analsysis of 21 Si IV doublets
Murphy et al. (2002) obtain a weighted
mean /
at .
Bahcall et al. (2003)
find /
from an analysis of strong
nebular emission lines of [O III] (5007 Å and 4959 Å) in a QSO
sample over .
We have conducted a search for C IV and Si IV doublets in the absorption
spectrum toward QSO 1101-264, obtained by VLT-UVES during the Science
Verification. Seven C IV and two Si IV systems were identified and
accurate measurements of wavelengths over the redshift range
were performed. After a careful selection of pairs
of lines, we applied the AD method, with an original expression
for the error analysis, to compute the variation.
Here we present the results of this work.
2 Measurements and Analysis
QSO 1101-264 was observed for
the Science Verification of the UVES Spectrograph at VLT.
All the work done on the spectrum was performed under the MIDAS package.
Data reduction was carried out by the Science Verification Team and for
our purpose, the reduced spectrum was converted from air wavelengths
to vacuum wavelengths.
A total of nine systems among the C IV (1548Å, 1550Å) and
Si IV (1393Å, 1402Å) ions were identified. A code for line
fitting considering Voigt profiles and based on the reduced test
as parameter of goodness of the fit was used. The laboratory wavelengths
considered in the present analysis are: C IV (1548.204Å, 1550.781Å)
and Si IV (1393.76018Å, 1402.77291Å) measured by
Griesmann & Kling (2000), the best available up to date.
The sample contains a total of 47 doublets, not all suitable for the
desired measure of / due to complicated
profiles, some of them contaminated or blended. For that reason a
rigorous selection of lines was made, choosing the best resolved
profiles, outside the Lyman forest to avoid contaminations, discarding
asymmetric shapes and focusing on narrow absorptions because centroids are better
determined than in broader ones. We present only those selected in
Table 1.
The synthetic spectrum for every doublet was constructed by using the
minimum number of components, until a very good shape reproducing the
observed spectrum was reached.
The C IV system at in Figure 1 helps to illustrate
the fitting procedure. After several line fitting runs with different
starting guess values around the minima, a poor fit was obtained.
To improve it, new lines were added, paying attention to the
slightly asymmetric shape of the spectrum toward the left. It allows to
determine better the wavelengths of the strong minima but the others do
not represent a reliable absorption to be considered.
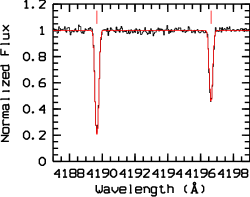
The C IV system at is a fortunate case because it is a simple
pair of strong lines (see Figure 2). It is a very good example
of the available high quality instruments displaying a spectrum with
and . The selection of appropriate centroid
wavelengths was based on this profile where the line fitting provided
wavelengths uncertainties of
= Å and
= Å. Because, somehow, a complex velocity
structure is present in all systems, the most symmetric shapes were selected
qualitatively and the corresponding
and values served as quantitative criterion to
ensure the best wavelengths to be included in the calculations.
Considering a possible small variation of ,
Varshalovich et al. (2000) use the approximate formula
| (1) |
where ; and represent the doublet separation for the absorption at redshift and at the laboratory, respectively; is a correction term given by Murphy et al. (2001), with and coefficients representing the relativistic correction to the energy for a particular transition, calculated for many elements by Dzuba et al. (1999b). The correction coefficients are: 1.1758 for C IV and 0.8914 for Si IV. An analitic expression for the error analysis can be obtained through an aproximation for the standard deviation as / = :
| (2) |
which, with the derivatives of eq. (1), yields the error propagation equation
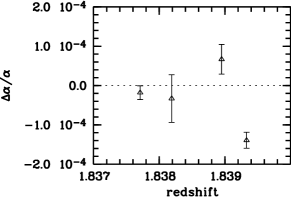
for the AD method. Results appear in Table 1, a plot for components
of Si IV is shown in Figure 3 and averaging the four values lead to:
/ , where the
error is the standard deviation around the mean.
3 Conclusions
For the first time, UVES data have been employed to compute
/ with the AD method.
The spectrum under study has a very good quality, comparable,
or better, than spectra used in previous work.
Despite the stringent selection criteria applied to find suitable
absorption profiles for measuring central wavelengths, an acceptable
number of doublets was obtained to carry out the desired calculations.
Even if the absorption profiles of C IV have very high quality, the
measurements errors obtained from this ion are bigger by one order of
magnitude than those obtained from Si IV. In addition, the
/ values provided by the C IV doublets
disagree in order of magnitude with those provided by Si IV, that
appear to be consistent with previous determinations
(Murphy et al., 2002). These differences between C IV and Si IV
data are probably due to the better determination of laboratory
wavelengths of Si IV in comparison to C IV wavelengths. Until better
laboratory data for C IV is available, we consider only the result
obtained from the components of the Si IV system at .
The resulting
/
does not support a change of at such redshift. However, despite
the result consistent with zero, our / values show
a negative sign, which is consistent with the findings of all previous
determinations of /
(Varshalovich et al., 2000; Webb et al., 2002; Murphy et al., 2002; Bahcall et al., 2003).
This remarkably consistent indication for a possible variation of
certainly deserves further investigation on a large number of systems,
aimed at reducing the final error bar.
The selection process of the best absorption lines, made to improve the
/ determination, reduces the quantity of doublet
systems available in a single QSO spectrum in a sensitive way. This is a
motivation to study many more QSO’s spectra to enhance the data sample,
concentrating the analysis on the Si IV transitions, which have well
determined laboratory data.
Acknowledgements.
AFMF thanks Valentina D’Odorico, Miriam Centurión and Paolo Molaro for help and advice, the librarians and the people of the Osservatorio Astronomico di Trieste. This work was supported by a scholarship from the Ministero degli Affari Esteri, with the support of the Ambasciata d’Italia in Colombia and Istituto italiano di Cultura in Bogotá, Colombia.References
- Bahcall et al. (1967) Bahcall J. N., Sargent W. L. W., Schmidt M., 1967, Apj 149, L11
- Bahcall et al. (2003) Bahcall J. N., Steinhardt C. L., Schlegel D., 2003, astro-ph/0301507
- Dzuba et al. (1999a) Dzuba V. A., Flambaum V. V., Webb J. K., 1999a Phys. Rev. Lett. 82, 888
- Dzuba et al. (1999b) Dzuba V. A., Flambaum V. V., Webb J. K., 1999b Phys. Rev. A 59, 230
- Dzuba et al. (2001) Dzuba V. A., Flambaum V. V., Webb J. K., 2001, Phys. Rev. A 63, 042509
- Griesmann & Kling (2000) Griesmann U., Kling R., 2000, Apj 536, L113
- Murphy et al. (2001) Murphy M. T. et al. 2001 MNRAS 327, 1237
- Murphy et al. (2002) Murphy M. T. et al. 2002. XXII Physics in Collision Conference (PIC02) Stanford CA, USA. astro-ph/0209488
- Okun (1998) Okun L. B., 1998, Physics-Uspeki 41, 553
- Varshalovich et al. (2000) Varshalovich D. A., Potekhin A. Y., Ivanchik A. V., 2000. Comments At. Mol. Phys. physics/0004068
- Webb et al. (2002) Webb J. K. et al., 2002, JENAM 2002 workshop, astro-ph/0210531