XMM-Newton and Chandra observations of three X-ray faint early-type galaxies
Abstract
We present XMM-Newton observations of three X-ray under-luminous elliptical galaxies, NGC 3585, NGC 4494 and NGC 5322. All three galaxies have relatively large optical luminosities (log =10.35-10.67 ) but have X-ray luminosities consistent with emission from discrete sources only. In conjunction with a Chandra observation of NGC 3585, we analyse the XMM-Newton data and show that the three galaxies are dominated by discrete source emission, but do possess some X-ray emitting gas. The gas is at relatively low temperatures, kT0.25-0.44 keV. All three galaxies show evidence of recent dynamical disturbance and formation through mergers, including kinematically distinct cores, young stellar ages, and embedded stellar disks. This leads us to conclude that the galaxies formed relatively recently and have yet to build up large X-ray halos. They are likely to be in a developmental phase where the X-ray gas has a very low density, making it undetectable outside the galaxy core. However, if the gas is a product of stellar mass loss, as seems most probable, we would expect to observe supersolar metal abundances. While abundance is not well constrained by the data, we find best fit abundances 0.1 for single-temperature models, and it seems unlikely that we could underestimate the metallicity by such a large factor.
keywords:
galaxies: individual: (NGC 4494, NGC 3585, NGC 5322) – galaxies: elliptical and lenticular, cD – X-rays: galaxies1 Introduction
Since the advent of the Einstein X-ray observatory, elliptical and lenticular galaxies have been known to be luminous sources of X-ray emission (Forman et al., 1985). In the most X-ray luminous examples, typically found in the cores of groups and clusters, the majority of the X-rays are produced through line emission and bremsstrahlung from hot (106-7 K) gas located in extended halos surrounding and permeating the galaxies (e.g. Trinchieri et al., 1986). The origins of these halos and the means by which they are maintained are a subject of ongoing debate. Possible sources of the gas include stellar mass loss within the galaxy, infall and shock heating of cool gas ejected during a merger (Hibbard & van Gorkom, 1996), and accretion of gas from a surrounding cluster halo.
Another important source of X-rays in early-type galaxies is the X-ray binary population. Prior to the launch of Chandra, little was known about this component of the emission, there being no non-dwarf early-type galaxies in the local group. Chandra, and to a lesser extent XMM-Newton, have shown that stellar sources can in fact dominate the emission from some early-type galaxies (e.g. Sarazin et al., 2001; Blanton et al., 2001; Bauer et al., 2001). The superb spatial resolution of Chandra permits the identification of large numbers of individual sources in nearby galaxies, and their spectral characterisation. The spectral properties of the unresolved source population can also be determined with some accuracy, thanks to the large collecting areas of Chandra and XMM-Newton.
In the case of relatively small, low mass galaxies it is to be expected that X–ray binaries will be the dominant source of X–ray emission - the shallow potential wells of these galaxies are less able to hold gas which is thrown or blown outwards from within the galaxy, and less able to accrete gas from outside. However, there are examples of optically luminous ellipticals, which would normally be assumed to be fairly massive systems, which are under-luminous in X-rays (e.g. Pellegrini, 1994, 1999; Sarazin et al., 2001). There are several possible explanations for this. If these galaxies lack significant dark matter halos, their stellar mass alone would be insufficient to maintain large X-ray halos. Alternatively, they might have suffered from ram-pressure (Gunn & Gott, 1972) or viscous Nulsen (1982) stripping while passing through the dense core of a galaxy group or cluster, removing most of their gas. In this case we would expect to see nascent halos in the process of reconstruction. A third possibility is that the galaxies have recently undergone a merger. Galaxy merging is observed to trigger a burst of star formation, followed by the production of large amounts of gas through supernovae and winds from massive stars (e.g. Read & Ponman, 1998). Modelling of recent post-starburst galaxies shows that they develop highly supersonic supernova driven winds (Ciotti et al., 1991; Pellegrini & Ciotti, 1998) whose low density leads to low X-ray luminosity. This is in agreement with observations of post-merger galaxies, which are known to be X-ray faint (Mackie & Fabbiano, 1997; Sansom et al., 2000; O’Sullivan et al., 2001b).
We have used XMM-Newton to observe three relatively nearby early-type galaxies, NGC 3585, NGC 4494 and NGC 5322. The first two of these have also been observed by Chandra and we combine these data with our own where possible. These galaxies were chosen from the sample of O’Sullivan et al. (2001a) to be optically luminous, with log 10.5 , but with exceptionally low /, close to the estimated typical luminosity from stellar sources. We therefore expect these galaxies to have little or no hot gas, and to be dominated by emission from point sources. Our intention is to use these observations to shed light on the question of why their X-ray luminosity is so low.
| Galaxy | R.A. | Dec. | Dist. | 1′= | |
|---|---|---|---|---|---|
| (J2000.0) | (J2000.0) | (Mpc) | (kpc) | (kpc) | |
| NGC 3585 | 11 13 17.1 | -26 45 18 | 21.28 | 4.67 | 13.14 |
| NGC 4494 | 12 31 24.0 | +25 46 30 | 16.07 | 6.19 | 13.83 |
| NGC 5322 | 13 49 15.2 | +60 11 26 | 27.80 | 8.09 | 24.36 |
http://nedwww.ipac.caltech.edu/, distances from the Fundamental Plane study of Prugniel & Simien (1996). is the mean radius at which the B-band optical intensity falls below 25 magnitudes per square arcsecond, taken from LEDA222The Lyon-Meudon Extragalactic Data Archive, http://leda.univ-lyon1.fr/.
Throughout the paper we assume =75 and normalise optical luminosities relative to the B-band optical luminosity of the sun, =5.21032 . In Section 2 we give details of the observations and our basic analysis of the data. Section 3 details the results of spatial and spectral fits to the galaxies, and in Section 4 we discuss the implications of these results and draw conclusions.
| Galaxy | Exposure (ks) | CCD Mode | Filter | Obs. date | Counts in | |
| PN | MOS | (BG subtracted) | ||||
| XMM-Newton | ||||||
| NGC 3585 | 16.5 | 20.9 | PrimeFullWindow | Medium | 2001-12-27 | 3558 |
| NGC 4494 | 24.0 | 29.5 | PrimeFullWindow | Medium | 2001-12-04 | 4457 |
| NGC 5322 | 12.9 | 16.8 | PrimeFullWindow | Thin | 2001-12-24 | 2615 |
| Chandra | ||||||
| NGC 3585 | ACIS-S 32.7 | Faint | - | 2001-06-03 | 2394 | |
2 Observation and data reduction
2.1 XMM-Newton observations
The three galaxies were observed during XMM Cycle 1, using the EPIC instruments. Details of the observations can be found in Table 2. A detailed summary of the XMM-Newton mission and instrumentation can be found in Jansen et al. (2001) and references therein. The raw data from the EPIC instruments were processed with the publicly released version of the XMM-Newton Science Analysis System (sas v.5.3.3), using the epchain and emchain tasks. After filtering for bad pixels and columns, X–ray events corresponding to patterns 0-12 for the two MOS cameras and patterns 0-4 for the PN camera were accepted. Investigation of the total count rates for each field revealed flaring in all three observations. Times when the total count rate deviated from the mean by more than 3 were therefore excluded. Effective exposure times after cleaning are given in Table 2.
Images and spectra were extracted from the cleaned events lists with the sas task evselect. Point sources were identified using the sas sliding-cell detection task eboxdetect to search images for each camera in five energy bands. The source lists for each band were compared and combined to produce a final source list for the field. All data within 17′′ of point sources were also removed, excluding the false source detections associated with the cores of the galaxies. For simple imaging analysis, the filtering described above was considered sufficient. Event sets for use in spectral analysis were further cleaned using evselect with the expression ‘(FLAG == 0)’ to remove all events potentially contaminated by bad pixels and columns. We allowed the use of both single and double events in the PN spectra, and single, double, triple and quadruple events in the MOS spectra. Response files were generated using the sas tasks rmfgen and arfgen.
Background images and spectra were generated using the “double subtraction” method (Arnaud et al., 2002; Pratt et al., 2001). The “blank field” background data sets of Lumb (2002) and the “telescope closed”, particles only data sets of Marty et al. (2002) form the basis of this process. Background images are generated by scaling the “closed” data to match the measured events outside the telescope field of view. The “blank” data are then scaled to match the observation exposure time, and a “soft excess” image calculated by comparison of this scaled background to the low energy counts observed in the outer part of the detector field of view. The source does not extend to the outer part of the field of view, so the soft excess image should measure only the difference in background soft emission between the “blank” data and that for the target. The various background components can then be combined to form the background images. A similar process is used to create background spectra, again scaling the “blank” data to match the observation, and correcting for differences in the soft background component using a large radius spectrum.
2.2 Chandra observations
Two of our galaxies, NGC 3585 and NGC 4494 have been observed with Chandra. A description of the Chandra mission and instruments can be found in Weisskopf et al. (2002) and references therein. Both datasets were initially reprocessed using ciao (v2.3), removing bad pixels and excluding events with ASCA grades 1, 5 and 7. The data were corrected to the appropriate gain map, and a background light curve for each was produced. The light curve for NGC 3585 showed only minimal flaring, and was cleaned by excluding all times where the count rate deviated from the mean by more than 3. The effective exposure and other details of this observation are shown in Table 2. NGC 4494 unfortunately showed flaring throughout the observation (on both front and back illuminated chips), to the extent that removing the flare periods made the effective exposure so short as to be useless for our purposes. We therefore did not include this dataset in our analysis.
For NGC 3585, background images and spectra were generated using the blank sky data described by Markevitch333http://asc.harvard.edu/cal. The data were cleaned to match the background, and appropriate responses were created with the ciao tasks mkwarf and mkrmf. As the ACIS instruments are affected by absorption by material accumulated on the optical blocking filter, we applied a correction to the responses. When fitting spectra we generally held the absorption column fixed at the galactic value of 5.581020 cm-2. Point sources were identified using the ciao tool wavdetect and were excluded from the data by removing regions with twice the radius given by the detection routine.
3 Results
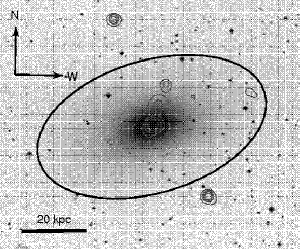
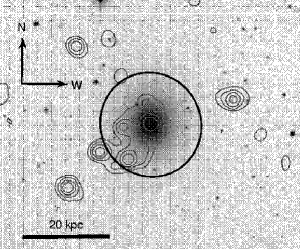
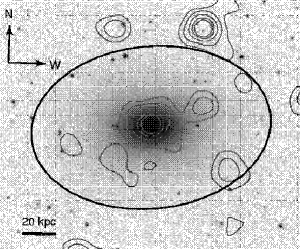
We initially prepared adaptively smoothed images of the galaxies from each dataset. The images from the three XMM-Newton EPIC cameras were combined and smoothed using the sas task asmooth with a maximum signal-to-noise ratio of 10. Chandra data for NGC 3585 was smoothed with the ciao tool csmooth, using a signal-to-noise range of 3 to 5. Figure 1 shows X-ray contours derived from the smoothed EPIC data overlaid on optical images taken from the digitized sky survey.
In all case we found that the X-ray emission from the galaxy was dominated by point sources. There are extended, diffuse components to the emission, but they are relatively minor, and none extend out as far as the radius. There is an apparent lack of correspondence between the diffuse X-ray structure and the optical appearance of the galaxies. This can be largely attributed to the effects of point sources which are unresolved by the EPIC cameras, and in the case of NGC 3585 the Chandra data shows a closer correspondence between diffuse X-ray emission and the stellar component of the galaxy.
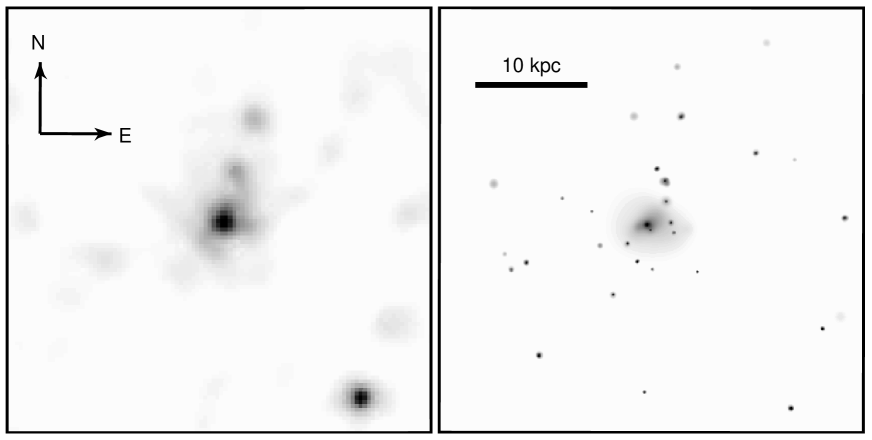
Figure 2 shows the adaptively smoothed Chandra ACIS-S3 image of NGC 3585 alongside the smoothed XMM-Newton EPIC. Many of the point sources visible in the Chandra exposure are also visible in the XMM-Newton image, but the number of sources which are unresolved by XMM-Newton is clear. Given the small number of counts in each dataset, this contamination is difficult to deal with. Ideally Chandra data would be used to identify point sources in the field of view, and regions around these would be removed from the Chandra and XMM-Newton data before fitting. In practice, the size of the XMM-Newton PSF would force us to omit most of the region containing the diffuse emission. We therefore identified and removed point sources from each dataset individually.
3.1 Spectral fits
For each galaxy we initially extracted spectra from a region of radius 45′′, for each of the EPIC cameras. Appropriate background spectra and responses were generated, and the spectra were simultaneously fitted, using xspec (v11.2.0). All spectra were grouped to have at least twenty counts per bin, and fitted using the statistic. Power law emission models were found to give a reasonable fit to the spectra of all three galaxies above 1 keV, but in all cases we found that the fit below 1 keV was improved by the introduction of a cool plasma component. We assume this component is associated with the interstellar medium (ISM) of each galaxy (we discuss this assumption in Section 4.1). The results of the best fitting MEKAL + Power law models are shown in table 3, with power law models for comparison. In all cases the power law model is a significantly poorer fit, and in the case of NGC 5322 errors on the power law slope had to be calculated with the steppar command. The models were fitted in the energy range 0.2-8.0 keV.
| Galaxy | kT | Abundance | red. | d.o.f. | Flux | log | Fraction | ||
| cm-3 | (keV) | () | () | () | (PL/MK) | ||||
| NGC 3585 | 5.581020 | 0.44 | 0.02 | 1.23 | 0.760 | 54 | 1.4410-13 | 39.89 | 0.53/0.47 |
| 5.581020 | - | - | 1.970.12 | 1.424 | 57 | - | - | - | |
| NGC 4494 | 1.561020 | 0.25 | 0.02 | 1.49 | 1.005 | 153 | 2.3410-13 | 39.86 | 0.88/0.11 |
| 1.561020 | - | - | 1.720.05 | 1.153 | 156 | - | - | - | |
| NGC 5322 | 1.811020 | 0.41 | 0.07 | 0.88 | 1.197 | 121 | 2.8710-13 | 40.42 | 0.57/0.43 |
| 1.811020 | - | - | 2.15 | 3.15 | 124 | - | - | - | |
| NGC 3585 (C) | 5.581020 | 0.37 | 0.05 | 1.54 | 1.182 | 47 | - | - | - |
| NGC 3585 (all) | 5.581020 | 0.41 | 0.030.01 | 1.39 | 0.953 | 101 | - | - | - |
The need for a low temperature gas component to the fit prompted us to check several factors which might affect the accuracy of the spectral fit below 1 keV. The calibration of the EPIC cameras is known to imperfect below 0.5 keV, so we carried out the same fits with lower energy limits of 0.4 and 0.5 keV. In all cases a two component model (power law with low temperature plasma) was a better fit than a power law model alone. The parameters of the plasma were poorly constrained, however, and it was not possible to calculate useful errors on the plasma temperature and abundance when a minimum temperature of 0.5 keV was used. As our background data are constructed by a combination of models, including a correction for galactic soft emission, we also checked to see how well the background spectra in use match those from a large, source free region of the observation. As expected they are a good match, particularly in the energy range of interest (0.2-1.0 keV), suggesting that the low temperature gas component is not a result of improper background subtraction. We also note that fits using a power law model with hydrogen column free to vary, while an improvement on those with fixed, do not compare well with the MEKAL + power law fits. As a final test, we reanalysed data for NGC 4494 with sas v5.4.1, a more recent version of the XMM-Newton calibration database, and the more extensive background data files of Read & Ponman (2003). The spectral fitting results were almost identical, the only difference being slightly smaller error ranges for kT and .
For NGC 3585 we are able to extract a spectrum for an identical region from the Chandra data. The spectrum was fitted in the energy range 0.3-6.0 keV, the lower limit determined by the Chandra calibration and the upper limit by a lack of counts above 6.0 keV. The results of fitting this data are shown in the lower portion of Table 3. In general the fit is quite similar to the fit to the XMM-Newton data. Gas temperature, abundance and the power law photon index are all quite comparable within the errors, with the main difference being the slightly steeper power law slope in the Chandra fit. The similarity between the two fits is reassuring, indicating that the low temperature gas component is indeed real. We also show a simultaneous fit to all four spectra (ACIS-S3 and EPIC MOS 1, MOS 2 and PN), giving slightly better constrained parameters. As a further test of the fits, we compared the ratio of MEKAL to pwer law emission with the ratio of counts in point sources (identified by wavdetect in the Chandra data) to counts in diffuse emission. Within 45′′, the radius used for our spectral fits, 54% of the Chandra counts are in point sources, 46% in diffuse emission. This compares very well with the results of the spectral fits (53%/47%). For the galaxy as a whole (defined by the radius) we find that the ratio is reversed, with 44% of emission in point sources and 56% unresolved or diffuse.
The low temperature component of NGC 5322, while reasonably well modelled by a single temperature MEKAL model, can also be modelled by a multi-temperature spectrum. Replacing the MEKAL model with an MKCFLOW model, designed to represent a steady state cooling flow, improved the fit significantly (reduced =1.149 for 120 degrees of freedom). This may indicate that the gas in this system is multiphase, although clearly more detailed spectra would be required before drawing any definite conclusions. The minimum and maximum temperature of the MKCFLOW model were kTmax=0.44 keV and kTmin=0.11 keV. However, it should be noted that these errors were calculated with the abundance frozen at its best fit value of 0.29 . Abundance was poorly constrained, and when it was allowed to vary the fit was unstable and xspec was unable to calculate the error bounds. We take this as an indication that the data do not provide adequate abundance information to allow an accurate fit with this model. It may suggest that while the MKCFLOW abundance is consistent with the very low abundances found with single temperature plasma models, we may be underestimating the abundance of the gas because we are only able to fit simple models. It has been demonstrated that fitting a single temperature model to a spectrum from multi-temperature gas can result in underestimation of abundance (Buote, 2000a, b). The power law slope was similar to that found for the single temperature MEKAL + power law fit.
We also tried fitting each galaxy using a model consisting of a power law, MEKAL model and a black body model with a temperature kT=50 eV. This third component was chosen to represent a contribution from unresolved supersoft sources. (Pellegrini & Fabbiano, 1994) suggested that part of the very soft component of emission in some early-type galaxies may arise from these sources, and showed that the Einstein data for NGC 4365 were well fit by a three component model. For our three galaxies, we find that this model produces only marginal differences from the MEKAL+power law model described above. The fit for NGC 3585 is slightly worse when the black body component is included (reduced =0.785 for 55 degrees of freedom), but the fits to the other two galaxies are somewhat improved (reduced =1.003, 152 d.o.f. for NGC 4494 and reduced =1.19, 120 d.o.f. for NGC 5322). The parameters of the model components do not change significantly, with the exception of the abundance of NGC 4494 which rises to 0.1 (90% errors). We also carried out fits in which the black body temperature was increased to 0.1 keV or allowed to vary freely, but these were less well constrained than the 50 eV model. As the addition of this model component does not greatly improve the fits, we choose to continue using the simpler MEKAL+power law model.
Although the numbers of counts in each dataset is low, we were able to split the Chandra data for NGC 3585 and the XMM-Newton data for NGC 4494 into inner and outer spectral regions. The inner region is determined by the XMM-Newton PSF, and is therefore chosen to be a circle of radius 16′′. The outer region is an annulus with outer radius 45′′ and inner radius enclosing the inner spectral region. The spectrum of each region is not likely to be detailed enough to provide strong constraints on the parameters. Our main interest is in determining whether the fraction of flux contributed by the gas component varies between regions, and whether it is possible to measure temperature variations in the gas with radius. The two galaxies show quite different behaviour. NGC 4494 shows very similar properties in the two regions, with the power law contribution dominating both. The inner part of NGC 3585 has almost equal flux contributions from the gas and power law components, but the gas contribution drops sharply in the outer region.
One factor which may affect the spectral fits to NGC 4494 is the size of the XMM-Newton PSF. The inner spectral region we have used has a radius comparable to the half-energy width of the PSF, and the emission is quite peaked within this region. Markevitch (2002) demonstrated that in the case of A1835, a cluster with a strong peak in core surface brightness, more than 20% of the flux in an annulus 15-45′ from the core originates from the central 15′′ radius bin. The PSF is also energy dependent, with low energy photons better focussed by the telescope mirrors. We must therefore expect that the spectrum of the outer bin of NGC 4494 contains photons which should be in the inner bin, and that this contamination will be biased toward higher energy photons. This could affect the spectral fit, making the outer bin seem to have a harder spectrum, and disguising a temperature gradient.
In the case of NGC 3585, the Chandra PSF is small enough that this issue does not arise. We can also compare the ratio of MEKAL to power law emission to the ratio of counts in detected point sources and in diffuse emission, as we did for the initial fit to this galaxy. We find that in both the inner and outer spectral regions, the fraction of counts in detected point sources is the same, 54%. This fraction is similar to the power law emission fraction in the inner bin (51%), but quite different to that in the outer bin (83%). This perhaps suggests that in the outer spectral bin, a larger part of the X-ray emission is produced by unresolved point sources, which are spectrally distinct from diffuse hot gas, but cannot be spatially distinguished from it.
| Galaxy | Fraction (PL/MK) | kT (keV) | ||
|---|---|---|---|---|
| Inner | Outer | Inner | Outer | |
| NGC 3585 | 0.51/0.49 | 0.83/0.17 | 0.52 | 0.28 |
| NGC 4494 | 0.89/0.11 | 0.86/0.14 | 0.19 | 0.25 |
Having measured the temperature of the X-ray emitting gas in each galaxy we can use the model normalistaion to estimate the cooling time of the gas. Assuming the gas to be approximately isothermal in the 45′′ spectral fitting region, we can then calculate a mean cooling time based on the gas temperature and mean density. These values are shown in Table 5, as well as mean gas particle densities for each system. These cooling times are relatively short, suggesting that either some portion of the gas is cooling or that there is some source of energy in the galaxies preventing it from doing so.
3.2 Surface brightness fits
Given the relatively low numbers of counts in the datasets for our three galaxies, we might wish to perform fits to azimuthally averaged surface brightness profiles. However, at present the ciao sherpa package, which we use to perform the fits, is not capable of convolving models with the instrumental PSF in one dimension. In the case of Chandra data this is relatively unimportant, as the PSF is narrow. When fitting XMM-Newton data the PSF must be taken into account, particularly when dealing with objects such as our three galaxies, where the extent of the emission is only a few times larger than that of the PSF. Regardless of instrument there is the additional problem that the central point source of each galaxy may not lie at the same position as the peak of the extended emission. This could increase the error on a one-dimensional fit, which must by necessity be centred on one component. We therefore fit all three galaxies in two dimensions, using images extracted from the cleaned events lists and performing the fitting using sherpa.
We extracted images and scaled background images of each galaxy, as well as exposure maps and representative PSFs. Images from the XMM-Newton cameras were binned to 4.4′′ pixels and those from Chandra were binned to 1.0′′ pixels. Identified point sources were removed from all images. Images from the XMM-Newton cameras were fit simultaneously, using all three cameras for each galaxy. We chose to fit images in two energy bands, soft (0.2-2.0 keV) and hard (3.0-8.0 keV). This was originally intended to allow a comparison of gas emission with that from unresolved point sources. However, although the emission from cool gas provides a significant contribution to the soft band in terms of energy flux, it does not dominate the photon flux. This means that the images in the soft band are likely to be strongly affected by the population of unresolved point sources, and cannot provide an accurate measure of the distribution of cool gas in the galaxies. A narrower energy band (e.g. 0.2-0.5 keV) might provide images in which the gas emission was the main component, but unfortunately we have insufficient counts to perform fits in this band.
As we had many pixels with few or no counts, we used the Cash statistic (Cash, 1979) to determine the goodness of the fits. The Cash statistic does not provide an absolute measure of goodness of fit, but can be used to measure relative goodness and therefore determine whether a fit is improved by a particular change in model parameters. As we have no measure of absolute goodness of fit we determined whether fits were acceptable based on radial profiles of the data and convolved model (output as images from sherpa). We emphasize that these azimuthally averaged radial profiles are not themselves being fitted, but are only inspected to determine whether the fit is realistic. A further requirement of the Cash statistic is the use of a background model to describe the background image in each fit. We chose to use flat background models which have the advantage that small deviations (‘noise’) in the background image will not affect the fit. On the scale over which we are fitting, the background is relatively (but not perfectly) flat, and the error introduced by using a flat model should be small.
The galaxies were fitted using a combination of beta models, chosen to represent the extended emission, and where necessary point source models which represent any central point source contribution. We assume that any central point source is most likely an AGN. During fitting we found that the statistics were sufficiently poor that we were unable to calculate error limits on the parameters for some of the fits. The fits were unstable, and error fitting in sherpa did not produce reliable results when tested over multiple error calculations. We were unable to fit any model to the hard band XMM-Newton image of NGC 3585, and so used the Chandra data instead. This allowed us to model a central point source but we did not find any extended component. The soft band fits to the XMM-Newton and Chandra data for NGC 3585 were similar. Table 5 shows the results of the fits, and Figure 3 shows azimuthally averaged radial profiles of the data and best fitting model for each galaxy, in the soft band.
| Galaxy | Instrument | Band | rcore | Point Source? | rmax | tcool | n | |
|---|---|---|---|---|---|---|---|---|
| (keV) | (pc) | (kpc) | (Myr) | (cm-3) | ||||
| NGC 3585 | EPIC | 0.2-2.0 | 29.1 | 0.45 | Y | 7.01 | 639.6 | 0.014 |
| NGC 3585 | ACIS-S3 | 3.0-8.0 | Point Source only | Y | ||||
| NGC 4494 | EPIC | 0.2-2.0 | 84.1 | 0.42 | Y | 6.96 | 1863.9 | 0.017 |
| NGC 4494 | EPIC | 3.0-8.0 | 431.8 | 0.65 | N | |||
| NGC 5322 | EPIC | 0.2-2.0 | 139.2 | 0.43 | Y | 12.14 | 825.5 | 0.009 |
| NGC 5322 | EPIC | 3.0-8.0 | Point Source only | Y | ||||
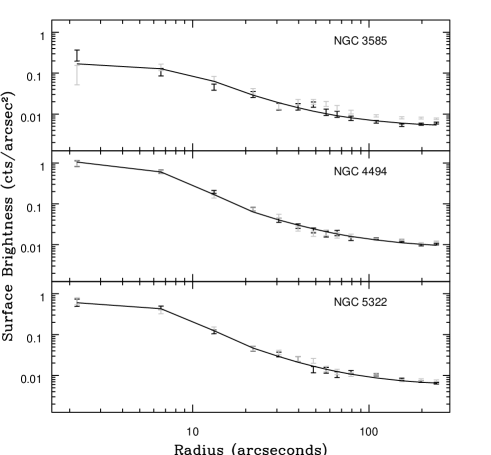
Although the radial profiles show the fits to be fairly good representations of the data, Some differences between model and data are visible. The profile for NGC 3585 suggests that the model is underestimating the surface brightness at radii of 40-80′′. This is likely caused by the apparent extension of the galaxy emission to the northwest, visible in the left hand panel of Figure 2. As the right hand panel of that figure shows, this is largely caused by point sources which are poorly resolved by XMM-Newton but which are clear in the Chandra data. We note that the surface brightness fit to the Chandra data is similar to that we find for XMM-Newton, suggesting that this problem has not significantly biased the fit.
The formal 1 errors on , which are calculated using the projection task in sherpa, are rather small given the apparent uncertainties in the data and the difficulty of finding stable fits. However, using alternate methods of error calculation in sherpa produced similar error estimates, suggesting that either these errors are accurate or that there is a general problem with the calculation of the error on the parameter in this software package. The core radii of the king models are all comparable to the pixel scale of the images used for fitting. This may indicate the presence of central point sources even where these are not required for the fit. One clear trend does emerge from these fits however; the extended emission is primarily seen in the soft band, and has a very flat profile, flatter than that which would be expected for stars. A de Vaucouleurs profile typical of elliptical galaxies is similar to a beta model with =0.5 (Brown & Bregman, 2001). The flatness of the profile could indicate that the gas in the galaxies is more extended than the stellar population. However, unresolved point sources in globular clusters around the galaxies could also be responsible. In NGC 4494, where we have sufficient numbers of counts in the hard band to detect the extended component, the model fit shows a steeper slope than in the soft band. This could be compared to the change in temperature with radius seen in NGC 3585, but given the lack of such a change in NGC 4494, it is perhaps more likely a product of the lack of counts in the hard band. We were unable to calculate the errors on the slope in the hard band, indicating that they are probably large, and likely overlap the slope found in the soft band.
4 Discussion
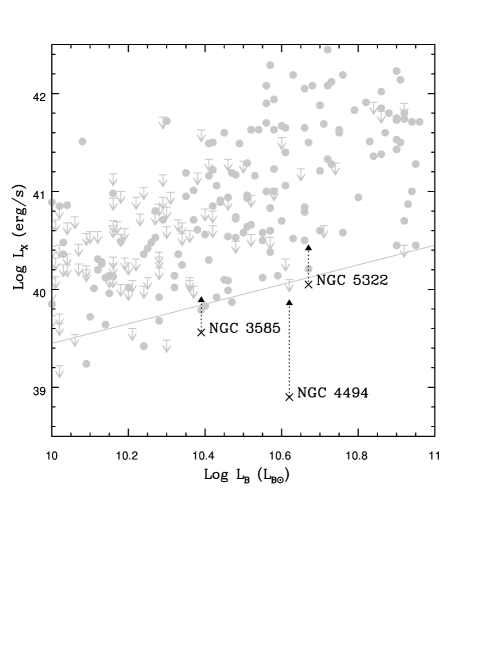
The most important factor arising from the X-ray observations of these galaxies is the confirmation of how unusually X-ray faint they are. Figure 4 shows X-ray luminosity plotted against B-band optical luminosity for a range of early-type galaxies, with our three galaxies shown for comparison. The general population of galaxies forms a band on this plot, the lower limit of which corresponds roughly to the estimate of X-ray emission from discrete sources from Ciotti et al. (1991). This makes sense, in that galaxies in the lower part of the band are presumably dominated by point sources, with little or no gas emission, while those with large gas halos fall in the upper part of the band. The three galaxies we are considering all fall near the lower limit of the band, NGC 4494 in fact falling below the edge of the band. When we consider only the luminosity from the soft spectral component, all three fall further, with NGC 4494 perhaps two orders of magnitude fainter than galaxies with similar optical luminosities.
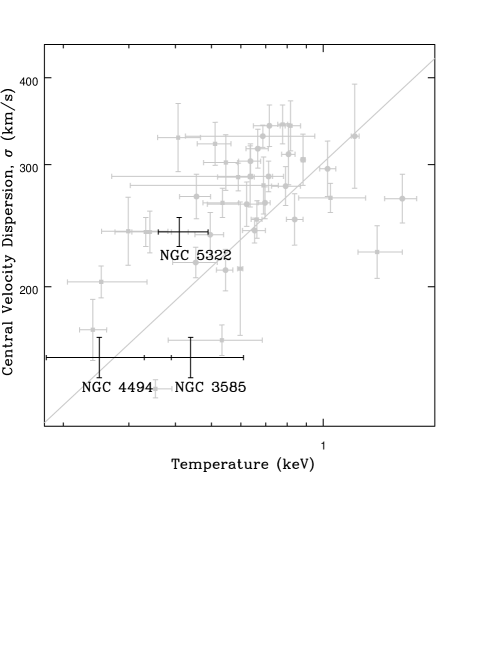
A further comparison can be seen in Figure 5, a plot of stellar velocity dispersion against X-ray temperature. We have compared the three galaxies from this work with the galaxies in the sample of O’Sullivan et al. (2003), which is mainly comprised of large ellipticals in the centres of galaxy groups. The sample does have a few less massive objects however, and it is notable that NGC 4494 and NGC 3585 fall in the bottom left hand corner of the plot, close to points for NGC 5128 (which hosts Centaurus A and has only a moderate amount of X-ray emitting gas), NGC 1549, NGC 1553 (an elliptical and an S0 galaxy which are interacting, Malin & Carter, 1983), and NGC 4697 (another gas-poor elliptical, Sarazin et al., 2001). All three galaxies are fairly close to the line =1, and NGC 4494 is consistent with the line. is defined as
| (1) |
where is the stellar velocity dispersion, is the mean mass per particle and mp is the proton mass. A value of =1 indicates that there is energy equipartition between X-ray gas and stellar velocity dispersion. This may suggest that the main source of the gas is stellar mass loss, so that its current temperature is the product of thermalisation of the velocity it had when ejected from the stars. The fact that there is no major difference between our three low X-ray luminosity galaxies and those in the O’Sullivan et al. (2003) sample suggests that the source of the gas and the means by which it is heated may be similar.
4.1 The soft spectral component
An important question for these galaxies is the origin of the soft spectral component, which we have modelled as a plasma with temperatures of 0.25-0.44 keV. As discussed in Section 3.1, this component does not appear to be a product of poor background subtraction, and is found in both spectral regions used for NGC 3585 and NGC 4494. Although this indicates that the emission is extended to some extent, we are not able to confirm whether it arises from a diffuse gas component or from unresolved point source emission. As the soft band surface brightness fits are affected by emission from the X-ray binary component, these cannot provide any information on the distribution of the soft spectral component.
This issue is not new. Observations of low X-ray luminosity ellipticals with Einstein showed that they had a very soft emission component with a temperature of 0.2-0.3 keV (Pellegrini & Fabbiano, 1994). In one elliptical galaxy, NGC 4365, it was shown that the Einstein data could be modelled using a combination of components representing hard emission from X-ray binaries, a 0.6 keV plasma, and soft emission from stellar sources whose mean temperature was 0.1 keV. Sources such as M dwarf stars, RS Canum Venaticorum (RS CVn) late-type stellar binaries and the so-called “supersoft” X-ray sources were suggested as possible contributors to the softest emission component, but it was shown that they could only produce the required luminosity and temperature when combined. Any of these three classes of source was unlikely to be the sole source of the soft component, and a gas component was still required to model the galaxy.
More recent studies of ellipticals using Chandra have resolved a small number of “supersoft” sources (e.g. Sarazin et al., 2001), and studies of sources within the local group have shown that they are characterised by spectra with temperatures kT90 eV and luminosities of 1036 to 1038 (Kahabka, 2002). We note that these temperatures are substantially lower than those we find for the soft emission in our galaxies, even if we adopt the Pellegrini & Fabbiano (1994) model and increase the temperature to 0.1 keV. However, these sources may contribute some of the soft emission, and we therefore investigate the possibility.
We have attempted to fit our galaxies with models including a soft component such as that produced by supersoft sources (a 50 eV black body, see Section 3.1) but this model is not a significant improvement over a MEKAL+power law model, and is worse in the case of NGC 3585. Fixing the temperature at 0.1 keV, the temperature found by Pellegrini & Fabbiano (1994), does not improve the fit significantly and increases the error bounds on the parameters. If the temperature of this supersoft component is left free, the fits become unstable and poorly constrained. If we assume the model with the 50 eV black body component is accurate, we find that in NGC 4494 the black body component contributes a similar energy flux to the MEKAL component (8 per cent of the total emission), while in NGC 5322 the MEKAL component is 4.5 times as luminous as the black body.
These results suggest that it is possible that a third, very soft component such as that described by Pellegrini & Fabbiano (1994) may contribute to the emission in our galaxies, to a varying degree. The poor fit to the data for NGC 3585 argues against such a component making any significant contribution, but in NGC 5322 a small contribution is possible. In NGC 4494, the contribution may equal that of the gas component. However, these results should be considered as upper limits, as the spectral fits do not show that an additional black body component improves the fits significantly. The additional component also has very little effect on the properties of the other spectral components, except the increase in abundance for NGC 4494. It therefore seems reasonable to continue with the assumption that the soft spectral component represents emission from hot gas, with the caveat that the normalisation may be slightly overestimated.
4.2 Stellar properties
All three galaxies have optical surface brightness profiles which are sharply peaked in the core (Michard, 1998). It has been suggested that this type of profile is associated with disky, rapidly rotating galaxies (Nieto et al., 1991) with low X-ray and radio luminosities (Bender et al., 1989). The differences between galaxies with this structure and those with boxy isophotes, slow rotational velocities and flat central surface brightness distributions may be an indication of different origins. In this model disky ellipticals are formed through dissipational collapse, or perhaps a collapse followed by only minor mergers, while boxy ellipticals with high X-ray luminosities are the product of major mergers.
However, the galaxies in this sample have structures which may indicate that they have undergone major mergers in the past. NGC 3585 is a disky elliptical, containing a rapidly rotating disk component embedded within a non-rotating bulge (Scorza & Bender, 1995). The difference in rotation velocities (280 for the disk, 45 for the bulge) indicates different origins for the two components, and a probably merger origin for the galaxy. NGC 5322 has a counter-rotating core (Bender, 1988), and is boxy in its outer regions, only becoming disky in the core. It can be modelled by assuming that the main body is a slowly rotating (30 ) boxy ellipsoid with a small disk in the core (Scorza & Bender, 1995). Such a disk could be formed by a centrally concentrated burst of star formation after a merger or strong interaction, or could be a remnant of a progenitor galaxy. In either case, a merger origin is indicated for NGC 5322. NGC 4494 contains a small dust disk (Tran et al., 2001) and a central stellar disk (Carollo et al., 1997). The galaxy core is kinematically distinct, but the stellar disk is not more metal poor than the rest of the galaxy, suggesting that it formed through dissipative collapse during a merger between gas-rich galaxies. All three galaxies have globular cluster populations with a bimodal colour distribution (van den Bergh, 2001). NGC 4494 and NGC 5322 have fairly low ’local’ specific frequencies of globular clusters (Kundu, 1999). Based on the distribution and colours of globular clusters in these two objects, studied as part of a sample of galaxies with kinematically distinct cores, Forbes et al. (1996) conclude that the most likely model for the formation of these galaxies is through merger of massive gas-rich progenitors at an early epoch.
Given the optical evidence of formation through merger for these galaxies and their low X-ray luminosity, it seems likely that they are relatively young objects, only a few Gyr from formation through merger. Unfortunately only NGC 3585 has a spectroscopic age (the age of the stellar population, based on fitting stellar evolution models to optical spectra), but this confirms it to be young, with an age of 3 Gyr (Terlevich & Forbes, 2002). Schweizer & Seitzer (1992) describe the age of NGC 5322 through their fine structure parameter, in which values are assigned to galaxies based on the degree of disturbance (shells, ripples, tidal tails, etc. ) visible in their structure. They find a value of =2, indicating moderate disturbance, and supporting the assumption of a young age for the galaxy, as such features generally fade over the course of a few Gyr. It is unfortunate that all three galaxies do not have well determined spectroscopic ages, but it seems clear that two of these objects at least are relatively young.
4.3 Dark matter and halo stripping
In Section 1 we described three possible reasons why these galaxies might be X-ray under-luminous. The first of these was that the galaxies might have minimal dark matter halos, leaving them with too little mass to retain an X-ray halo. In the case of NGC 4494, there is some evidence to suggest that this may be the case. Romanowsky et al. (2003) use planetary nebulae to trace the velocity dispersion profile of the galaxy to 3 (150′′ or 15.2 kpc) and show that within this region the stellar population alone is capable of producing the observed profile. This suggests that either the system has a minimal (or no) dark halo, or that the halo does not show the central concentration expected from cold dark matter formation models. In either case, we must expect that the galaxy’s ability to retain hot gas would be greatly reduced by this lack of a centrally concentrated dark halo. Indeed, the lack of a bright X-ray halo could be considered as evidence that the system does not have a significant dark matter halo. We must also consider the possibility that our other galaxies have a similar lack of dark matter. It is worth noting that the mass-to-light ratios of NGC 4494 and NGC 5322 determined from stellar velocity dispersion measurements, are slightly lower than average (Bacon et al., 1985). The two galaxies were analysed as part of a sample with a mean mass-to-light ratio of 10, and were found to have ratios of 8.30.16 (NGC 4494) and 9.00.43 (NGC 5322).
Perhaps the most likely way to produce a galaxy with a lower than average quantity of dark matter would be to strip the dark matter halo. Such tidal stripping could also remove X-ray gas and globular clusters. Stripping would happen during interactions between the galaxy and its neighbours, but this seems unlikely in the case of our objects. NGC 3585 and NGC 5322 are the dominant galaxies of small groups (Garcia, 1993), an environment which would seem more likely to enhance their halos than reduce them. NGC 4494 lies in a small group in the outskirts of the Virgo cluster, the other members being gas-rich spiral galaxies. In each case, the galaxies we have observed are the most massive elliptical in the group, and it seems more plausible that they would strip matter from their neighbours rather than the other way around. Simulations of interactions between galaxies in compact groups have shown that some of the dark matter originally associated with the member galaxies can be stripped and left as a diffuse group halo (Barnes, 1989). These simulations also show that the dominant (elliptical) merger remnant does possess its own dark halo, but there could be circumstances in which this does not hold. It is very unfortunate that these observations are not sufficiently deep to allow measurement of the surface brightness profile of the gas in each galaxy, as this would allow us to estimate the total mass profile of the galaxies. This is clearly an area in which a larger sample of ellipticals with velocity dispersion measurements extending to large radii as well as high quality X-ray data is needed.
We can more confidently dismiss the option of ram-pressure stripping. A galaxy, even a relatively massive one, could be partially stripped of its X-ray halo by passage through the dense core of a galaxy cluster (Acreman et al., 2003). However, the position of our galaxies in small groups argues against such an event in their history. The galaxies have small velocities relative to the other members of the group, and neither our XMM-Newton and Chandra data nor our analysis of the archival ROSAT observations (O’Sullivan et al., 2001a) show evidence of large group halos of X-ray emitting gas. Based on the background we measure immediately around our target galaxies, we estimated 3 upper limits on the density of gas in each group potential well, and also upper limits on the luminosity of each group. We assumed the halos to have temperatures of 0.3 keV, 0.3 abundance, and to extend to a radius of 100 kpc. The chosen values are low compared to many bright groups (Helsdon & Ponman, 2000) but are probably realistic for low mass, low luminosity systems. These upper limits are given in Table 6, and show that the intra-group medium is of relatively low density. At velocities of (at most) a few hundred such diffuse gas is very unlikely to have affected our target galaxies. The presence of gas-rich spiral galaxies in the groups demonstrates clearly that no ram-pressure stripping has happened to the group as a whole. We cannot therefore explain the lack of dark matter and hot gas in NGC 4494 by postulating a passage through the core of Virgo.
| Galaxy | n | log |
|---|---|---|
| (10-5 cm-3) | () | |
| NGC 3585 | 24.51 | 41.88 |
| NGC 4494 | 4.44 | 39.72 |
| NGC 5322 | 6.86 | 41.14 |
4.4 X-ray halo formation models
The third option mentioned in Section 1 is that these are simply young galaxies. Numerical simulations of the formation of the large X-ray luminous gas halos associated with early-type galaxies suggest that the process is affected by a number of factors, including galaxy mass (stellar and dark matter), supernova rate and environment. For the galaxies we have observed, which although massive are not surrounded by a dense intergalactic medium, models such as those of Ciotti et al. (1991), Pellegrini & Ciotti (1998) or David et al. (1991) may be the most applicable. These ‘galaxy wind’ models all pass through three main phases, characterised by the movement of gas in the ISM. The phases can be described as (1) a supersonic outflow driven by the high supernova rate shortly after galaxy formation, (2) a slower sub-sonic outflow once the supernova rate drops, with consequent higher gas densities, and (3) a sub-sonic inflow driven by cooling of the densest gas in the core of the galaxy. The models of Pellegrini & Ciotti (1998) are slightly different in that they produce ‘partial winds’ in which the inner portion of the galaxy hosts a cooling flow while the outer part is still driving an outflowing wind. In this case, the radius inside which the gas flows inwards expands with galaxy age. David et al. (1991) give details of models both with and without dark matter halos. In those without dark matter, the galaxies never reach phase (3), and at most develop partial inflows. For galaxies of similar to ours, the model predicts supersonic winds at both early and late stages, with a sub-sonic partial wind at intermediate age. In all of the models, the mass of the system and the supernova rate are the major factors in determining how long the galaxy remains in a particular phase. Low mass galaxies may not have passed out of the supersonic wind phase by the present epoch, and galaxies which have undergone major mergers in the recent past may still be in the process of regenerating their halos. Our galaxies may fall in to either category; if they lack sufficient dark matter they may be unable to retain a significant gaseous halo, and if they do have massive dark halos they may be too young to have built up a large quantity of X-ray gas.
The galaxy wind models are supported to some extent by observation. Total X-ray luminosity and / ratio are generally low for dynamically young early-type galaxies (O’Sullivan et al., 2001b; Sansom et al., 2000; Mackie & Fabbiano, 1997), particularly for those galaxies whose stellar population has a spectroscopically determined mean age of 5 Gyr. This timescale compares well with the time predicted by the models for the buildup of a halo. The models suggest that the X-ray luminosity at later times will depend on the development of the gas flow, with lower mass systems remaining fairly faint while more massive objects become highly luminous on a fairly short timescale (1-3 Gyr). The X-ray observations show that the mean X-ray luminosity of a sample of galaxies rises slowly over a long timescale (O’Sullivan et al., 2001b). This may be an indication that the increase in luminosity is somewhat slower than predicted by the models. In any case, the low luminosity of our three galaxies suggests that they may be relatively young objects.
The models make numerous predictions about factors which we can measure, such as the gas density profile, temperature, and the mass of gas available from stellar mass loss. One of the most important concerns the relative gradient of the X-ray surface brightness (or gas density) profile compared to the optical profile. Both the Ciotti et al. and David et al. models predict that the X-ray profile will be steeper or more centrally concentrated than the optical during the supersonic outflow and inflow phases, but flatter than the optical during the sub-sonic outflow phase. The Pellegrini & Ciotti models tend to be steeper in all phases, as the central cooling inflow adds a peak to the surface brightness profile. Our surface brightness profiles are probably strongly influenced by emission from unresolved point sources, and so cannot be used for a direct comparison. However, any strong correlation (or lack thereof) might still be of some interest, as the gas does have some influence on the profile. Figure 6 shows r1/4 law profiles for each of our galaxies compared with the X-ray surface brightness profiles. In all cases the X-ray profile is flatter than the optical, though this is more pronounced in NGC 4494 and NGC 5322, where the core radius is considerably larger than in NGC 3585. If this difference is produced by extended gas emission rather than unresolved point source emission in the globular cluster population, it suggests that if the galaxy wind models are correct, the galaxies are in a sub-sonic outflow phase, a surprising result given their low luminosity. However, we emphasize that this result is biased by the unresolved point source emission and cannot be regarded as definitive.

As well as predicting the slope of the density profile, the stellar wind models make predictions about the absolute density of the gas. The models also make predictions about other factors, such as the mass of gas available from stellar mass loss and the gas temperature profile. Again, the mass and density of the gas depend on the age of the system and its current wind phase; if the galaxies are in a supersonic wind phase we expect a large stellar mass loss rate, but almost all of this mass is lost to the galaxy. Our spectral fits suggest that the three galaxies have gas masses of 106 if the gas is evenly distributed. If we assume a density profile for the gas based on the surface brightness profile and normalised using the spectral fits, these masses rise to 2107-108 and we would predict peak gas densities of 0.1 cm-3. Assuming our galaxies to be relatively young objects with ages 5 Gyr, the models of Ciotti et al. and Pellegrini & Ciotti generally over-predict the amount of gas in the system, suggesting that we should see masses 109 . The exception may be models in which the galaxy is rapidly rotating, as the gas in these models gains more energy from the stellar motions and is more easily lost to the galaxy. The David et al. models do a better job of predicting the gas mass, with values of 107-108 , but under-predict the central density by a factor of 10. This is the case for models both with and without dark matter. The Pellegrini & Ciotti models match our observed temperatures relatively well, predicting kT0.48 keV, with a decline in temperature with radius which would agree with that we observe in NGC 3585. The David et al. models predict a slightly higher temperature, 0.7 keV, and the Ciotti et al. models over-predict kT by a factor of 3-4.
4.4.1 Abundance
However, the most important problem for all the models is the abundance of the gas. All the models assume that the gas is produced through stellar mass loss and must therefore be enriched. Ciotti et al. state that their models predict winds with metallicities several times solar, which would be difficult to reconcile with the very sub-solar abundances we observe. As the low numbers of counts in our spectra lead to rather poorly constrained models, we have carried out simulations to determine whether multi-phase gas models or the contributions from X-ray binaries could cause us to underestimate the gas abundance by a significant amount. In particular we wanted to determine whether the abundances we measured might be reduced through the “Fe bias” effect described by Buote (2000b), which is most influential in low temperature systems such as groups and galaxies.
We used xspec to simulate spectra for NGC 4494 (the galaxy for which we have the best statistics), initially assuming a gas component with an abundance of 0.3 and a temperature as measured from the observed spectra of the galaxy. We modelled the X-ray binary contribution using a powerlaw component with a photon index of =1.56, which Irwin et al. (2003) have shown to be a good representation of the binary population in a range of early-type galaxies. The relative contributions of the two components were then varied, keeping the total number of detected counts at 4500. We found that if the powerlaw component is dominant, contributing 90 per cent or more of the counts, the measured abundance can be reduced by a factor of 2. However, abundances less than 0.3 are required to reproduce the results we observe, and in these cases it is clear that the powerlaw is the dominant component. This does not agree with what we observe in the three galaxies. Similarly, we simulated galaxies in which the gas emission was produced by gas at two temperatures, one held at the measured temperature, the other varied between 0.2 and 1 keV. Abundance was held to be the same for both components and varied between 0.1 and 1 . Again we found that it was difficult to disguise the true abundance of the gas, and that low abundances (0.15 ) were required. These tests strongly suggest that while the abundances we measure may be underestimated, they cannot be as high as those predicted by the galaxy wind models.
There are numerous examples of galaxies observed with a range of satellites which show exceptionally sub-solar abundances (e.g. Davis & White, 1996; Matsumoto et al., 1997; Irwin et al., 2002). The difference between these abundances and the optically determined abundances of the stellar populations has been the subject of debate for a number of years. In the case of ROSAT the spectral resolution of the PSPC camera made modelling of the abundance rather unreliable, and for ASCA observations, it has been shown that most ellipticals can be accurately modelled using multi-temperature models with near solar abundances (Matsushita et al., 2000). More recent studies have also shown that bright ellipticals have abundances more consistent with the stellar population when modelled with multi-temperature models (Buote et al., 2003; Matsushita et al., 2003). However, the problem appears to persist for galaxies with low X-ray gas content, as several recent studies show very low abundances similar to those we observe in our targets (Sarazin et al., 2001; Irwin et al., 2002; Kraft et al., 2003). Given the relatively small numbers of counts detected from the ISM of these galaxies, it is still possible that the abundance could be underestimated owing to the use of overly simplistic models. However, our spectral simulations suggest that this is not the case for our galaxies. It has also been noted (Finoguenov & Jones, 2000) that in many studies the angular scales on which stellar and ISM abundance are determined are different; optical metallicities tend to be measured in the core of each galaxy using apertures considerably smaller than those available to X-ray satellites such as ROSAT or ASCA. However, the advent of Chandra has altered this situation to the point where abundances can be measured on very similar scales for the ISM and stellar population. Irwin et al. (2002) demonstrate that even in the very center of NGC 1291 the ISM has very low abundance. Our galaxies, in which abundance is determined on a rather coarser scale, support the suggestion that low X-ray luminosity and low abundance are linked. This is clearly a problem for the galaxy wind models.
5 Conclusions
There appear to be two main possible explanations for the low X-ray luminosity and low gas content of the three galaxies we have observed. The galaxies may have minimal or nonexistent dark matter halos, reducing their ability to retain gas. They may be young objects, in which the energy released by supernovae is still great enough to drive low density outflowing stellar winds, effectively removing gas from the galaxies. The available optical data suggests that both of these factors may be at work, combining to leave only the small amounts of gas which we detect. Several important issues arise from these results. Firstly, if the galaxies do lack massive dark matter halos, why is this so? Stripping of the dark matter seems unlikely given the environment of the systems, and current galaxy formation models predict that cold dark matter halos are a fundamental feature of early-type galaxies. Secondly, the galaxy wind models do suggest that enough gas should be available to produce the emission we see, but we do not find a close match between their predictions about gas density and the density profiles we measure. Thirdly, the abundances measured in these galaxies are very low, as has been observed in other low X-ray luminosity ellipticals. Galaxy wind models greatly overestimate the abundance of the gas. We look forward to further developments in galaxy modelling codes which may be able to rectify these discrepancies.
Acknowledgments
The Authors would like to thank J. C. Kempner, B. J. Maughan and A. M.
Read for the use of their software and their advice on XMM and Chandra
analysis, and D. Forbes for his help in the early stages of the project.
We would also like to thank an anonymous referee whose comments
significantly improved the paper. This work made use of the Digitized
Sky Survey, the NASA/IPAC Extragalactic Database, and Starlink facilities
at the University of Birmingham. This research was supported in part by
NASA grants NASA NAG5-10071 and NASA GO2-3186X, for which we are most
grateful.
References
- Acreman et al. (2003) Acreman D. M., Stevens I. R., Ponman T. J., Sakelliou I., 2003, MNRAS, 341, 1333
- Arnaud et al. (2002) Arnaud M., Majerowicz S., Lumb D., Neumann D. M., Aghanim N., Blanchard A., Boer M., Burke D. J., Collins C. A., Giard M., Nevalainen J., Nichol R. C., Romer A. K., Sadat R., 2002, A&A, 390, 27
- Bacon et al. (1985) Bacon R., Monnet G., Simien F., 1985, A&A, 152, 315
- Barnes (1989) Barnes J. E., 1989, Nature, 338, 123
- Bauer et al. (2001) Bauer F. E., Brandt W. N., Sambruna R. M., Chartas G., Garmire G. P., Kaspi S., Netzer H., 2001, AJ, 122, 182
- Bender (1988) Bender R., 1988, A&A, 202, L5
- Bender et al. (1989) Bender R., Surma P., Döbereiner S., Mollenhoff C., Madejsky R., 1989, A&A, 217, 35
- Blanton et al. (2001) Blanton E. L., Sarazin C. L., Irwin J. A., 2001, ApJ, 552, 106
- Brown & Bregman (2001) Brown B. A., Bregman J. N., 2001, ApJ, 547, 154
- Buote (2000a) Buote D. A., 2000a, ApJ, 539, 172
- Buote (2000b) Buote D. A., 2000b, MNRAS, 311, 176
- Buote et al. (2003) Buote D. A., Lewis A. D., Brighenti F., Mathews W. G., 2003, ApJ, in press
- Carollo et al. (1997) Carollo C., Franx M., Illingworth G., Forbes D., 1997, ApJ, 481, 710
- Cash (1979) Cash W., 1979, ApJ, 228, 939
- Ciotti et al. (1991) Ciotti L., D’Ercole A., Pelegrini S., Renzini A., 1991, ApJ, 376, 380
- David et al. (1991) David L. P., Forman W., Jones C., 1991, ApJ, 369, 121
- Davis & White (1996) Davis D. S., White R. E. I., 1996, ApJ, 470, L35
- Faber et al. (1989) Faber S. M., Wegner G., Burstein D., Davies R. L., Dressler A., Lynden-Bell D., Terlevich R. J., 1989, ApJS, 69, 763
- Finoguenov & Jones (2000) Finoguenov A., Jones C., 2000, ApJ, 539, 603
- Forbes et al. (1996) Forbes D. A., Franx M., Illingworth G. D., Carollo C. M., 1996, ApJ, 467, 126
- Forman et al. (1985) Forman W., Jones C., Tucker W., 1985, ApJ, 293, 102
- Garcia (1993) Garcia A. M., 1993, A&AS, 100, 47
- Gunn & Gott (1972) Gunn J. E., Gott J. R. I., 1972, ApJ, 176, 1
- Helsdon & Ponman (2000) Helsdon S. F., Ponman T. J., 2000, MNRAS, 315, 356
- Hibbard & van Gorkom (1996) Hibbard J. E., van Gorkom J. H., 1996, AJ, 111, 655
- Irwin et al. (2003) Irwin J. A., Athey A. E., Bregman J. N., 2003, ApJ, accepted, astroph/0212422
- Irwin et al. (2002) Irwin J. A., Sarazin C. L., Bregman J. N., 2002, ApJ, 570, 152
- Jansen et al. (2001) Jansen F., Lumb D., Altieri B., Clavel J., Ehle M., Erd C., Gabriel C., Guainazzi M., Gondoin P., Much R., Munoz R., Santos M., Schartel N., Texier D., Vacanti G., 2001, A&A, 365, L1
- Kahabka (2002) Kahabka P., 2002, in Lewin W. H. G., van der Klis M., eds, , Compact Stellar X-ray Sources. Cambridge Universit Press
- Kraft et al. (2003) Kraft R. P., Nolan L. A., Ponman T. J., C. J., Raychaudhury S., 2003, preprint
- Kundu (1999) Kundu A., 1999, Ph.D. Thesis
- Lumb (2002) Lumb D., 2002, EPIC background files, http://xmm.vilspa.esa.es/docs/documents/CAL-TN-0016-2-0.ps.gz
- Mackie & Fabbiano (1997) Mackie G., Fabbiano G., 1997, in Arnaboldi M., Da Costa G. S., Saha P., eds, ASP Conf. Ser. 116: The Nature of Elliptical Galaxies; 2nd Stromlo Symposium Environmental and internal optical properties and the x-ray content of e and sos. p. 401
- Malin & Carter (1983) Malin D. F., Carter D., 1983, ApJ, 274, 534
- Markevitch (2002) Markevitch M., 2002, preprint, astro-ph/0205333
- Marty et al. (2002) Marty P. B., Kneib J. P., Sadat R., Ebeling H., Smail I., 2002, proc. SPIE, 4851, 208
- Matsumoto et al. (1997) Matsumoto H., Koyama K., Awaki H., Tsuru T., Loewenstein M., Matsushita K., 1997, ApJ, 482, 133
- Matsushita et al. (2003) Matsushita K., Finoguenov A., Böhringer H., 2003, A&A, 401, 443
- Matsushita et al. (2000) Matsushita K., Ohashi T., Makishima K., 2000, PASJ, 52, 685
- Michard (1998) Michard R., 1998, A&A, 335, 49
- Nieto et al. (1991) Nieto J., Bender R., Surma P., 1991, A&A, 244, L37
- Nulsen (1982) Nulsen P. E. J., 1982, MNRAS, 198, 1007
- O’Sullivan et al. (2001a) O’Sullivan E., Forbes D. A., Ponman T. J., 2001a, MNRAS, 328, 461
- O’Sullivan et al. (2001b) O’Sullivan E., Forbes D. A., Ponman T. J., 2001b, MNRAS, 324, 420
- O’Sullivan et al. (2003) O’Sullivan E., Ponman T. J., Collins R. S., 2003, MNRAS, 340, 1375
- Pellegrini (1994) Pellegrini S., 1994, A&A, 292, 395
- Pellegrini (1999) Pellegrini S., 1999, A&A, 343, 23
- Pellegrini & Ciotti (1998) Pellegrini S., Ciotti L., 1998, A&A, 333, 433
- Pellegrini & Fabbiano (1994) Pellegrini S., Fabbiano G., 1994, ApJ, 429, 105
- Pratt et al. (2001) Pratt G. W., Arnaud M., Aghanim N., 2001, in Neumann D. M., Tranh Thanh Van J., eds, Clusters of Galaxies and the High Redshift Universe Observed in X-rays: XMM-Newton observations of galaxy clusters; the radial temperature profile of A2163. p. in press
- Prugniel & Simien (1996) Prugniel P., Simien F., 1996, A&A, 309, 749
- Read & Ponman (1998) Read A. M., Ponman T. J., 1998, MNRAS, 297, 143
- Read & Ponman (2003) Read A. M., Ponman T. J., 2003, A&A, submitted
- Romanowsky et al. (2003) Romanowsky A. J., Douglas N. G., Arnaboldi M., Kuijken K., Merrifield M. R., Napolitano N. R., M. C., Freeman K. C., 2003, Science, 301, 1696
- Sansom et al. (2000) Sansom A. E., Hibbard J., Schweizer F., 2000, AJ, 120, 1946
- Sarazin et al. (2001) Sarazin C. L., Irwin J. A., Bregman J. N., 2001, ApJ, 556, 533
- Schweizer & Seitzer (1992) Schweizer F., Seitzer P., 1992, AJ, 104, 1039
- Scorza & Bender (1995) Scorza C., Bender R., 1995, A&A, 293, 20
- Terlevich & Forbes (2002) Terlevich A. I., Forbes D. A., 2002, MNRAS, 330, 547
- Tran et al. (2001) Tran H. D., Tsvetanov Z., Ford H. C., Davies J., Jaffe W., van den Bosch F. C., Rest A., 2001, AJ, 121, 2928
- Trinchieri et al. (1986) Trinchieri G., Fabbiano G., Canizares C. R., 1986, ApJ, 310, 637
- van den Bergh (2001) van den Bergh S., 2001, PASP, 113, 154
- Weisskopf et al. (2002) Weisskopf M. C., Brinkman B., Canizares C., Garmire G., Murray S., Van Speybroeck L. P., 2002, PASP, 114, 1