0 \Year2004 \Pagespan000000 \lhead[0]D.Steeghs: Doppler Tomography \rhead[Astron. Nachr./AN 325, No. (\yearofpublic)]0 \headnoteAstron. Nachr./AN 325, No. \pages (\yearofpublic) / DOI 10.1002/asna.\yearofpublic1XXXX
Doppler Tomography of accretion in binaries
Abstract
Since its conception, Doppler tomography has matured into a versatile and widely used tool. It exploits the information contained in the highly-structured spectral line-profiles typically observed in mass-transferring binaries. Using inversion techniques akin to medical imaging, it permits the reconstruction of Doppler maps that image the accretion flow on micro-arcsecond scales. I summarise the basic concepts behind the technique and highlight two recent results; the use of donor star emission as a means to system parameter determination, and the real-time movies of the evolving accretion flow in the cataclysmic variable WZ Sge during its 2001 outburst. I conclude with future opportunities in Doppler tomography by exploiting the combination of superior data sets, second generation reconstruction codes and simulated theoretical tomograms to delve deeper into the physics of accretion flows.
keywords:
accretion, accretion discs – line:profiles – techniques: spectroscopic – binaries:closedsteeghs@cfa.harvard.edu
For movies: Follow the links on
the publishers web-pages.
http://www3.interscience.wiley.com/cgi-bin/jtoc?ID=60500255
as well as
on the web-pages of the editorial office:
www.aip.de/AN/movies/
1 Introduction
The detection of broad and strong emission lines is one of the hallmarks of an accreting system. The luminous supersonic accretion flows in cataclysmic variables (CVs) and X-ray binaries (XRBs) lead to complex and highly time-dependent line profiles across the electromagnetic spectrum. The interpretation of such broad lines in the spectrum of the CV AE Aqr as due to Doppler motions in a binary system (Crawford & Kraft 1956) formed the foundation for the development of our standard accretion scenario involving mass transfer via Roche-lobe overflow. The possibility of using these line profiles as a powerful diagnostic of the accretion flow was also recognized early on. For example, Greenstein & Kraft (1959) analysed the nature of emission line eclipses and Smak (1969) calculated synthetic line profiles formed in an extended accretion disc around the accretor. The time-dependent velocity structure of emission lines thus quickly became an important tool. Doppler tomography was developed in the late 1980’s by Keith Horne and Tom Marsh, who aimed to exploit the kinematical information contained in the observed line profiles and recover a model-independent map that spatially resolves the distribution of line emission in the binary (Marsh & Horne 1988). It was recognized that the observed line profiles at each orbital phase provide a projection of the accretion flow along the line of sight. Given sufficient observed projections, these profiles can then be inverted into a 2D image, very much like the CAT-scanning procedures used in medical imaging. An excellent recent review of Doppler tomography can be found in Marsh (2001). This concise review summarises the key ingredients of Doppler tomography and focuses on future opportunities for extending Doppler mapping methods in the light of enhanced capabilities with large aperture telescopes. The growing popularity of Doppler tomography is clearly illustrated by the large number of applications of the technique that can be found in the recent literature as well as in several other contributions to this volume.
2 From data to Doppler map
With Doppler tomography, a 2D data set consisting of a time series of line profiles is inverted into a 2D Doppler tomogram. Since the dataset provides us with projected radial velocities of the emitting gas, the Doppler tomogram one reconstructs provides the distribution of the line emission in the binary in a velocity coordinate frame. This permits image reconstructions without detailed à priori assumptions concerning the nature of the flow that one is mapping. The velocity coordinate frame greatly increases the flexibility of Doppler tomography and significantly simplifies the inversion process compared to image reconstructions in the Cartesian X-Y frame. Nonetheless, some implicit assumptions are made when performing Doppler tomography, and these must be borne in mind when interpreting reconstructed accretion flow maps (Marsh 2001; Steeghs 2003). The rather unfamiliar velocity coordinate frame of Doppler tomograms is the main hurdle a novice user of Doppler tomography has to overcome. In the Doppler tomogram coordinate frame, each line source is characterised by its inertial velocity vector in the orbital plane, V=, where the binary center of mass is at the origin, the -axis points from the accretor to the donor and the -axis points in the direction of motion of the donor, as viewed in the co-rotating frame of the binary. Each source then traces a sinusoidal radial velocity curve as a function of the orbital phase () centered on the systemic velocity of the binary ();
The observed line profiles are the projection of the radial velocities and intensities of all velocity vectors considered;
with describing the local line profile intensity at a Doppler shift of and the image value of the Doppler map at the corresponding velocity grid point. The inversion from data-set to Doppler map can be achieved via either a Radon transform in the form of filtered back-projection (Horne 1991) or via regularised fitting using maximum entropy or a similar quantity as the regularising function (Marsh & Horne 1988). The superior handling of noise and image artifacts with maximum entropy mapping, combined with its flexibility and usage of a formal goodness of fit parameter in the form of make it the preferable inversion choice in most cases.
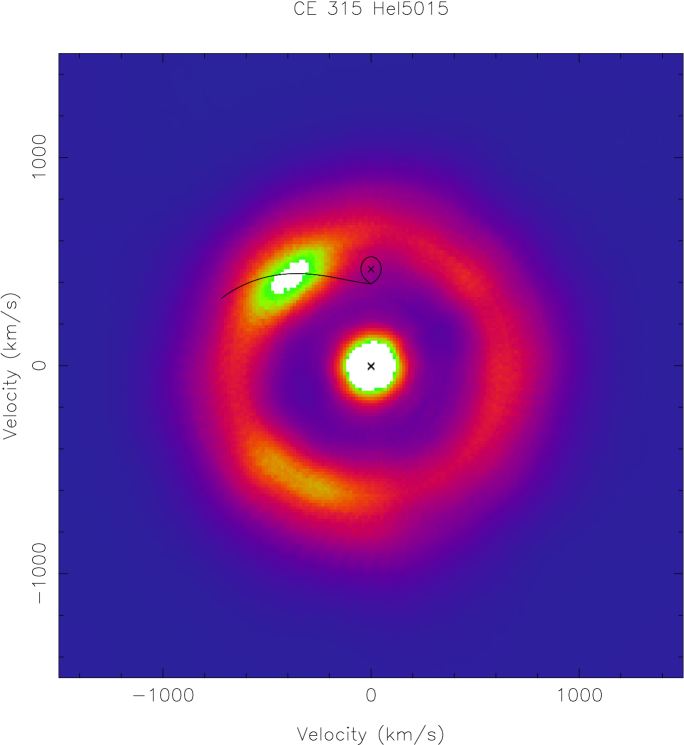
Despite the unfamiliar coordinate frame of Doppler tomograms, it is relatively straightforward to identify and resolve prominent emission sites such as the extended accretion disc, the gas stream and its impact on the outer disc (Fig. 1), the magnetically channeled flow in polars and emission from and around the mass donor star. Spatial asymmetries in the emissivity of the accretion disc map into similar structures in the inside-out Doppler projection of that disc. Since each of these sites has a completely different position-velocity relation, it would be impossible to reconstruct the equivalent position image without imposing detailed assumptions concerning the (unknown) translation between velocity and position. Therefore it is advised to compare data with models by presenting models in the velocity coordinate frame, as opposed to trying to reconstruct the data in an XY-frame. Then a direct and quantitative comparison between model and data can be made. Thus Doppler tomograms in the literature are now not only generated from observed line profiles, but also from theoretical simulations (e.g Wynn, King & Horne 1997).
3 Tomography highlights
I refer to the several other contributions to this volume as well as the proceedings of the 2000 Brussels tomography workshop (Boffin, Steeghs & Cuypers 2001) for specific applications of Doppler tomography of accreting binaries. In disc accreting systems, tomograms have demonstrated that in many cases accretion disc flows are highly asymmetric. The interaction between the in-falling stream and the outer edge of the disc manifests itself in a prominent bright spot as well as more extended disc asymmetries downstream (e.g. Figure 1). With Doppler maps, we have the prospect of studying this interaction in detail using a range of different lines. The disc itself generates strong asymmetries most notably the two armed tidal spiral structures observed in dwarf novae during outburst (Morales-Rueda, this volume). Doppler tomograms have also been instrumental in the mapping of the magnetically controlled flows in polars (Schwope, this volume) and in highlighting unusual emission-line kinematics in high-mass transfer CVs and some X-ray binaries. Below, I discuss two recent results I have been personally involved with in more detail.
3.1 Donor star emission and system parameters
Apart from imaging the geometry and dynamics of the accretion flow in a wide range of settings, Doppler tomography can also be used as a means toward the determination of basic system parameters. In particular, a contribution from the donor star is commonly observed in high-mass transfer rate CVs, polars and X-ray binaries. Whereas a radial velocity analysis of photospheric absorption features is the common technique for measuring the orbital velocity of the donor, there are many cases where such photospheric features are too weak to be detected. This has severely hampered our ability to extract basic system parameters for such binaries. In those cases, emission components from the irradiated donor are the only means of establishing its radial velocity and thereby constrain its mass. Since donor star emission typically contributes only a modest fraction to the overall emission line flux which tends to be dominated by the extended accretion flow, traditional radial velocity analysis of such features is problematic. On the other hand, a Doppler tomogram cleanly separates such donor emission from disc emission since emission from the Roche lobe-shaped donor stars maps onto a Roche lobe-shaped region along the positive axis in Doppler tomograms (Figs 1 & 2). This has the added advantage that the Doppler tomogram makes use of all the observed profiles at once and can thus identify very weak donor contributions that are too feeble to be identified in the individual line profiles. The main disadvantage of this method is that the emission traces only that part of the donor that is exposed to the ionising radiation from the hot accretion flow, and thus is biased toward the front side of the donor. A correction has to be made therefore to estimate the true orbital velocity of the donor’s center of mass as is required for system parameter estimates. Similar, but opposite, biases are present in the radial velocities curves derived from photospheric absorption line, which tend to over-estimate the amplitude since the absorption is weighted towards the back side of the donor. In some cases, the presence of both photospheric absorption as well as donor star emission lines allow us to investigate these relative biases (e.g. Schwope, this volume). 3D mapping of the distribution of donor star emission/absorption can be achieved via Roche tomography (Watson, this volume). Nonetheless, despite these biases, emission line radial velocity measurements of donor stars allow us to derive firm limits on the radial velocity amplitude of the donor star in systems for which no other dynamical constraint is available. In dwarf novae during outburst, the donor star is commonly present. This finally gave us a view of the hitherto unseen low mass donor star in WZ Sge during the 2001 outburst, when the hot accretion flow irradiated its Roche lobe (Figure 2; Steeghs et al. 2001). The detection of sharp donor emission components in the Bowen blend in the prototypical XRB Sco X-1 (Steeghs & Casares, 2002) illustrates the prospect for extending this technique to a significant number of neutron star (Casares et al. 2003) and black hole binaries (Hynes et al. 2003) as well.
3.2 Time-lapsed tomography: WZ Sge in outburst
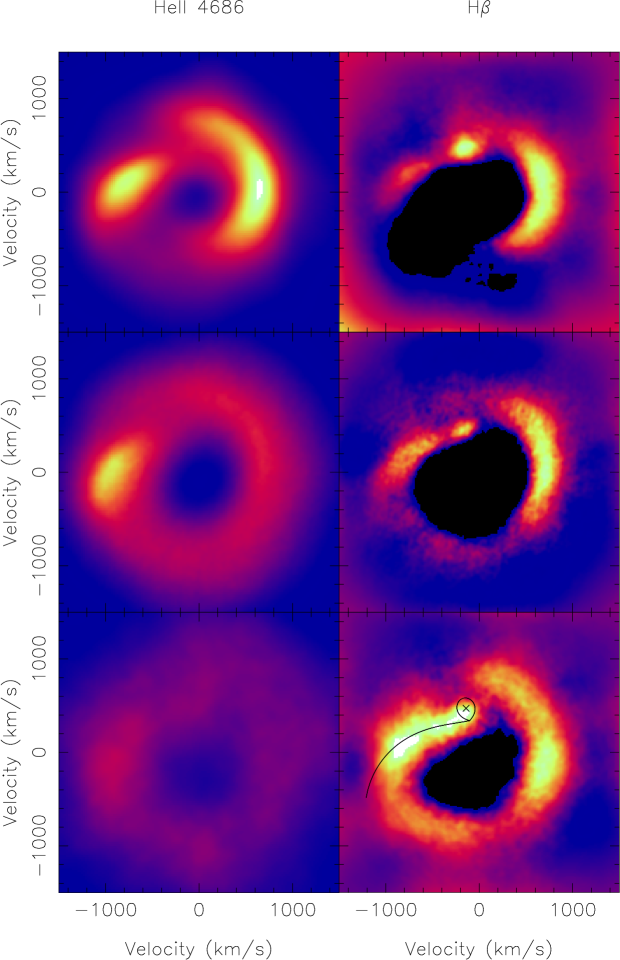
Doppler tomograms provide snapshots of the accretion geometry in a wide range of systems. In many cases, data sets covering several orbits are averaged together to provide a time-averaged image of the accretion flow in the co-rotating frame. Given that in principle only half an orbit is required for the reconstruction of a well constrained tomogram, a sequence of Doppler maps can track the evolution of systems on timescales of order their orbital period and longer. Armed with a suitably long data-set we can thus construct real-time movies of the changing accretion dynamics in binary systems. The dwarf novae and X-ray transients are excellent targets for such time-lapsed tomography experiments, since their recurrent outbursts are characterised by timescales of days to weeks, and can thus be probed by an intensive observing campaign. The 2001 outburst of the short-period CV WZ Sge led to such an extensive campaign with a large number of ground-based as well as space-based observatories studying this rare outburst. With over 35 nights of phase-resolved spectroscopy, the WZ Sge outburst provided a unique opportunity for time-lapsed tomography. During the first weeks of the outburst, which started on July 23rd 2001, time-resolved spectroscopic data obtained using the INT and WHT telescopes on La Palma provided over 10 nights of data with sufficient resolution for tomography. This data allowed the calculation of emission-line movies displaying the evolving accretion flow in the form of a sequence of Doppler tomograms covering the first 20 days of the outburst. In Figure 2, I display some representative frames of these movies. The movies themselves are available via the online edition of this journal. Below I describe the key features of these movies.
During the first few days of the outburst, the large, hot accretion disc is distorted by a two armed spiral structure, very much like the structures seen in IP Peg and U Gem (top panels in Figure 2, Steeghs 2001, Groot 2001). This disc asymmetry weakens as the HeII line flux decays, with the arm closest to the gas stream impact site persisting longer (middle-left panel). Roughly 14 days into the outburst, a short re-brightening occurs which corresponds to an increase in the HeII flux and the renewed presence of both arms. These quickly dissipate as the disc cools down, until the HeII line becomes undetectable (bottom-left panel). The Balmer emission suffers from significant self-absorption in the early stages, and makes a slow transition to a pure emission line. The variable presence of an emission component from the mass donor is also apparent. The most intriguing development is seen around the expected location of the bright spot. After the short re-brightening that was seen in the HeII line, the H line shows an extended emission structure bridging the mass donor and the outer disc; i.e. along the location of the gas stream (bottom-right panel). More extensive analysis is in progress, but it has all the hallmarks of a short-lived burst of enhanced mass transfer from the mass donor. Such a mass transfer burst has been invoked in the past to explain the unusual nature of the WZ Sge outbursts, and extensive photometry by Patterson et al. (2002) indicates the presence of an enhanced bright spot signature in the orbital light-curves around the same time. These first-generation Doppler movies illustrate the potential of time-lapsed tomography experiments. They warrant more efforts to secure similar data sets and provide detailed real-time evolution of the accretion flow. The outburst timescales of dwarf novae provide unique opportunities to scrutinize our understanding of disc instabilities and the physics of angular momentum transport.
4 The road ahead
Since its conception, Doppler tomography has evolved into a popular tool for analysing the complex line profiles from a wide range of accreting binaries. With the advent of large telescopes and a new generation of spectrographs, it is now not only possible to apply tomography to a wider range of systems by going fainter, but also push the technique further by acquiring high-quality data sets (in terms of superior time and wavelength resolution and signal to noise) of relatively bright systems. With the quality and depth of data sets improving, it is also important to evolve the tomography codes and take full advantage of the information contained in such data sets. Although the number of assumptions that go into Doppler tomography are limited, there are prospects for relaxing these assumptions and improving the flexibility and capabilities of tomography further. I explored one such extension recently by relaxing the assumption that the assumed flux from any point in the binary is constant in time (Steeghs 2003). This is one of the standard assumptions that is clearly violated in many cases. By allowing the flux to vary harmonically as a function of the orbital phase, the modulated Doppler tomography implementation can describe complex phase variability in the lines. The first applications include mapping the bright spot region in GP Com (Morales-Rueda et al. 2003) and the anisotropic emission from the spiral arms in IP Pegasi (Steeghs 2003). For the magnetically funneled flows in polars and intermediate polars it is clear that motions out of the orbital plane are significant, whereas Doppler tomography strictly maps the and components. This has led to a number of mapping experiments where the 3D geometry of the flow was prescribed before mapping the brightness distribution across it. However, in principle, the component can be incorporated in a 3D version of Doppler tomography, whereby the image space is now a cube, each slice corresponding to the distribution in the X-Y plane for a given . Tom Marsh has started some exploratory work in this direction (Marsh, private communication).
In order to extract physical parameters from the flow, the information contained in different emission lines can be combined. Rather than mapping each emission line on its own, images can be reconstructed in terms of physical parameters. By analogy with the physical parameter eclipse mapping technique (Vrielmann, Hessman & Horne 1999), a simple LTE atmosphere model characterised by temperature and density can be used to recover density and temperature Doppler maps, constrained by a data set covering a sufficiently diverse set of lines. Such physical parameter constraints would be invaluable. Doppler tomography maps accretion flows in a wide range of settings on micro-arcsecond scales. It continues to grow in popularity and is approaching the point of becoming a standard tool for emission line analysis of CVs and X-ray binaries. A combination of better data sets, more capable reconstruction codes and theoretical tomograms provides plenty of opportunities for novel Doppler tomography applications in the years ahead.
References
- [BSC] Boffin, H.M.J., Steeghs, D., Cuypers, J., 2001, Eds., Astrotomography, LNP Series 573, Springer Verlag, Berlin
- [1] Casares, J. et al., 2003, ApJ, 590, 1041
- [2] Crawford, J.A., Kraft, R.P., 1956, ApJ, 123, 44
- [3] Greenstein, J.L., Kraft, R.P., 1959, ApJ, 130, 99
- [4] Groot, P., 2001, ApJ, 551, 89
- [H91] Horne, K., 1991, in: Fundamental Properties of Cataclysmic Variable Stars, ed. A.W.Shafter, San Diego State University
- [5] Hynes, R. et al., 2003, ApJ, 583, 95
- [M02] Marsh, T.R, 2001, in: Boffin, Steeghs & Cuypers (2001)
- [MH88] Marsh, T.R., Horne, K., 1988, MNRAS, 236, 269
- [LMR] Morales-Rueda, L. et al., 2003, A&A, 405, 249
- [6] Patterson, J. et al., 2002, PASP, 114, 721
- [7] Smak, J., 1969, Acta Astr., 19, 155
- [8] Steeghs, D., 2003, MNRAS, 344, 448
- [9] Steeghs, D., 2001, in: Boffin, Steeghs & Cuypers (2001)
- [10] Steeghs, D., Casares, J., 2002, ApJ, 568, 273
- [11] Steeghs, D. et al., 2001, ApJ, 562, 145
- [12] Vrielman, S., Horne, K., Hessman, F., 1999, MNRAS, 306, 766
- [13] Wynn, G., King, A., Horne, K., 1997, MNRAS, 286, 436