Early (0.3 day) R-band light curve of the optical afterglow of GRB030329
Abstract
We observed the optical afterglow of the bright gamma-ray burst GRB030329 on the nights of 2003 March 29, using the Kiso observatory (the University of Tokyo) 1.05 m Schmidt telescope. Data were taken from March 29 13:21:26 UT to 17:43:16 (0.072 to 0.253 days after the burst), using an -band filter. The obtained -band light curve has been fitted successfully by a single power law function with decay index of . These results remain unchanged when incorporating two early photometric data points at 0.065 and 0.073 days, reported by Price et al.(2003) using the SSO 40 inch telescope, and further including RTT150 data (Burenin et al. 2003) covering at about 0.3 days. Over the period of 0.065-0.285 days after the burst, any deviation from the power-law decay is smaller than 0.007 mag. The temporal structure reported by Uemura et al. (2003) does not show up in our -band light curve.
1 Introduction
The bright and long gamma-ray burst (GRB), GRB030329, was detected on 2003 March 29 11:37:14.67 UT, with the HETE-2 spacecraft (Ricker et al. 2003). The burst lasted for more than 25 s in the 30-400 keV band. The fluence of the burst was 1 x 10⁻⁴ ergs cm-2 and the peak flux over 1.2 s was 7 10-6 ergs cm-2 s-1 (i.e., 100 Crab flux) in the same energy band. The subsequent ground analysis of the HETE-2 data produced an accurate location for the burst, which was reported in a GCN Position Notice at 12:50:24 UT, 73 minutes after the burst. The location is centered at , with the 90%-confidence error radius of (Vanderspek et al. 2003).
The optical afterglow was found within the -radius error circle at 0.077 days after the burst, at the coordinates of (Peterson and Price 2003; Torii 2003). The redshift of GRB030329 was determined as 0.168 0.001 by numerous absorption and emission lines in the optical spectra of the afterglow (Greiner et al. 2003; Price et al. 2003). In the afterglow spectrum, a bright Type Ic supernova feature appeared at 7.6 days; the associated supernova has been named SN2003dh (e.g., Stanek et al. 2003; Hjorth et al. 2003; Chornock et al. 2003; Zaritsky et al. 2003). This detection strongly suggests a physical link between GRBs and supernovae explosion. Uemura et al. (2003) claim that the optical light curve of the afterglow, produced by their unfiltered observation, deviates from a single power-law decay, exhibiting temporal breaks at 0.0850.028, 0.1630.060, and 0.2270.043 days.
We have established a GRB follow-up observation system at Kiso observatory (Urata et al. 2003). Because the Japan area had been blank for the GRB follow-up observational network, this observational system is very important in studying the temporal and spectral evolution of early (1 day) afterglows. Another merit of the system is its multi-color capability, using two instruments (2k2k CCD and KONIC) and -, -, -, -, -, -, and -bandpass filters (Urata et al. 2003). We have already performed early optical color measurements of a number of GRB afterglows. In the present burst, we have also performed an early -band follow-up observation of the afterglow, from 0.072 to 0.253 days. Here we study the temporal evolution of the optical afterglow over a very early phase (0.065 to 0.286 days), by combining our Kiso measurements with the published photometric points from the Siding Spring Observatory (SSO0 40-inch telescope (Price et al.2003), and the 1.5 m Russian-Turkish Telescope (RTT150) by Burenin et al. (2003).
2 Observations
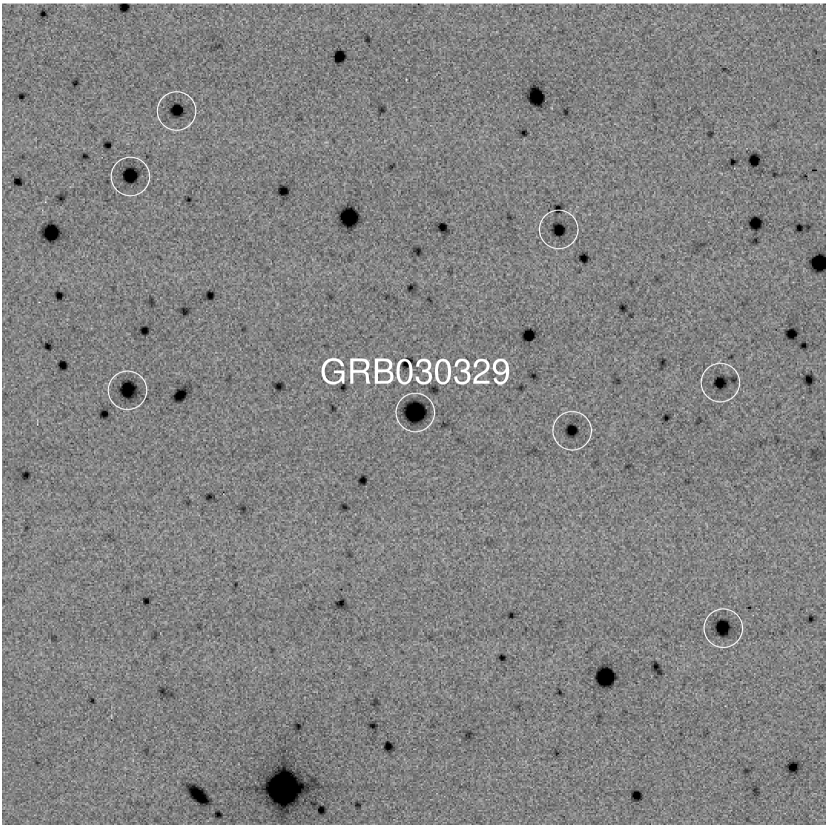
We carried out -band follow-up observations of the optical afterglow of GRB030329, using the system described in section 1. Specifically, we used the 1.05 m Schmidt telescope and a 2k2k CCD Camera at Kiso observatory, the University of Tokyo. The field of view was and the pixel size was square. The observation started at 2003 March 13:21:26 UT (0.075 days), and ended at 17:43:16 (0.253 days). Meanwhile, we acquired 36 -band images in total, mostly with 60-s exposure. An example of the -band image we obtained is shown in figure 1, where the afterglow is extremely bright.
3 Analysis
The data reduction was carried out by a standard method using the NOAO IRAF. We performed the dark-subtraction and flat-fielding correction using appropriate calibration data. The photometric calibrations were done for all frames using APPHOT package in IRAF, with 7 standard stars around the afterglow suggested by Henden (2003). We indicate these standard stars in figure 1. For each data, we set the one-dimensional aperture size to 4 times as large as the full-width at half maximum of the objects. The magnitude error in each optical images is estimated as , where is the photometric errors of GRB030329 afterglow, estimated from the output of IRAF PHOT, and is the photometric calibration error estimated by comparing our instrumental magnitude of the 7 standard stars over the 36 frames. The typical errors are mag. for photometric, and mag. for systematic.
4 Result
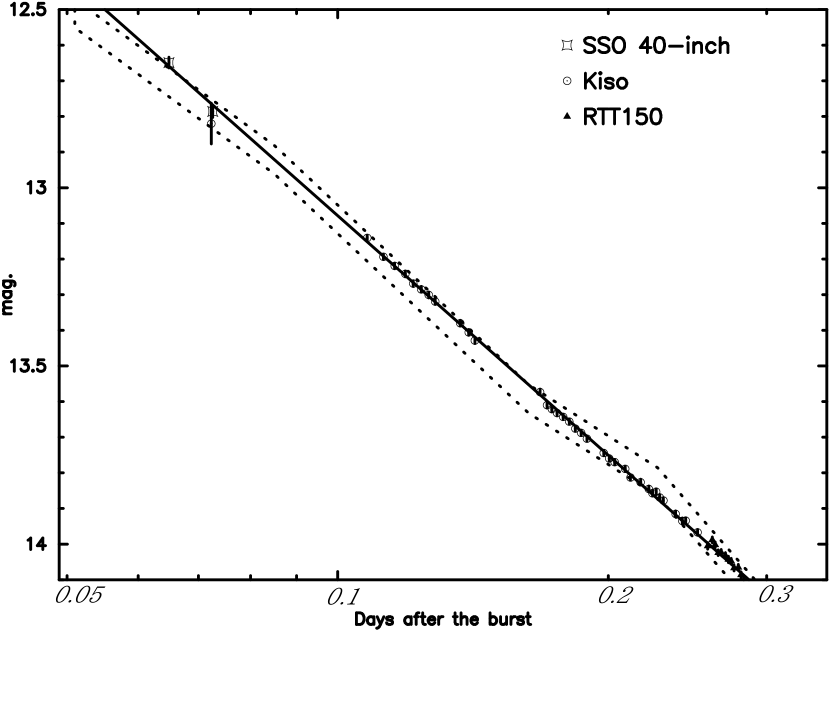
In figure 2, we plot the -band light curve of the afterglow of GRB030329 based on our photometry. The light curve is well fitted with a single power law function of the form , where t is the time after the burst and is the decay index; we have obtained with reduced chi-squared of 0.819 for 34. In order to better constrain the early-time ( 0.25 day) behavior of the light curve, we combined our data with the two -band photometric points reported by Price et al. (2003) using the SSO 40-inch telescope; =12.60.015 mag. at 0.065 day, and =12.7860.017 mag. at 0.073 day. These are among the earliest filtered observations of this afterglow. We have successfully fitted the combined -band light curve again with a single power law, of which the decay index is 0.8910.003 with =0.817 for . We have further included 13 -band photometric data points obtained at about 0.3 days after the burst by Burenin et al. (2003) using the Russian-Turkish telescope (RTT150), but the results did not change either; the decay index is , with for .
5 Discussion
We observed the optical afterglow associated with GRB030329 from 0.072 to 0.253 days after the burst. The light curve based on our photometry is well fitted by a single power law function with a decay index of . The result remains essentially unchanged when we include the published two SSO data points (Price et al. 2003) covering an even earlier phase (up to 0.065 days), and the published 13 RTT150 data points (Burenin et al. 2003) taken at about 0.3 days. Thus, our single power-law representation of the -band decay light curve is valid altogether over a period of 0.065–0.285 days after the burst.
Uemura et al. (2003) reported that their unfiltered light curve has three temporal breaks, at , , and days, across which the power-law decay index changes by 0.2–0.5. In figure 2, we have plotted their best-fit model function, together with the magnitude constant error suggested by them. Because the model normalization is not specified by Uemura et al (2003), we estimated it using 0.2 day data points of their figure 1. Although their measurements are thus consistent with ours within their measurement errors, the reality of the suggested breaks remain an important issue to be clarified.
For a more quantitative examination of the issue, we split our data into three phases, namely , , and , each covering one of the three reported breaks. We then fitted each of these light curve segments with a single power-law, and obtained the results as summarized in Table 1. Thus, the three segments are all expressed adequately with a single power-law, and the derived decay indices do not differ by more than 0.13.
We also tried to fit our light curve with the smoothly broken power-law model used by Uemura et al. (2003), which is expressed as with (), where is the time after the burst onset, is the -band flux, and are the decay indices at early and late times respectively, is a normalization constant, and indicates a smoothness parameter. The break times were fixed to the values reported by Uemura et al. (2003). Furthermore, we fixed at unity after Uemura et al (2003) when fitting the phase. The results from this analysis are again summarized in Table 1. In the first and the third time segments, the slope change is thus insignificant (at most 0.1) and the decay indices before and after the assumed break are all consistent with the global value of 0.89. Although a break is apparently suggested by the second segment, an F-test indicates that the improvement of the broken power-law model over the single power-law is not significant at the 90% confidence level. Thus, our high-quality -band light curve does not show any evidence for the wriggle structure reported by Uemura et al. (2003).
We further tried to fit the present light curve (Kiso, SSO, and RTT150) with the best-fit model function reported by Uemura et al. (2003), in which the over all normalization alone is allowed to vary. The fitting has yielded with for . Based on this large value of , we can rule out the model of Uemura et al. (2003) at more than 99.99% confidence level. A discrepancy between the filtered and unfiltered light curves could arise if there were significant color changes during the decay. In this case, a similar deviation from a single power-law decay should be observed in unfiltered light curves by other observers. However, there is no such structures in the unfiltered light curve obtained by Torii et al. (2003); it is fitted successfully by a single power law with a decay index of , in a good agreement with the present result. Furthermore Uemura et al. (2003) report that their unfiltered CCD has response close to that of the - system. Therefore, the origin of the discrepancy must be found somewhere else.
References
- Burenin et al. (2003) Burenin, R., et al. 2003, Astronomy Letters, 29, 573
- Chornock et al. (2003) Chornock, R., Foley, R. J., Filippenko, A. V., Papenkova, M., & Weisz, D. 2003, IAU Circ., 8114
- Greiner et al. (2003) Greiner, J., et al., 2003, GCN Circ., 2020
- Henden (2003) Henden, A., 2003, GCN Circ., 2023
- Hjorth et al. (2003) Hjorth, J., et al., 2003, Nature, 423, 847
- Matheson et al. (2003) Matheson, T., et al., 2003, ApJ, 582, L5
- Matheson et al. (2003) Matheson, T., et al.,
- Peterson and Price, (2003) Peterson and Price, 2003, GCN Circ., 1985
- Price et al. (2003) Price, P., A., et al., 2003, Nature, 423, 844
- Ricker et al. (2003) Ricker, G.,R., et al., 2003, AIP conf. proce., 662, 3
- Stanek et al. (2003) Stanek, K., Z., et al., 2003, ApJ, 591, L17
- Torii (2003) Torii, K., 2003, GCN Circ., 1986
- Torii et al. (2003) Torii, K., et al., 2003, ApJ, 597, L101
- Uemura et al. (2003) Uemura, M., Kato, T., Ishioka, R., Yamaoka, H., Monard, B., Nogami, D., Maehara, H., Sugle, A., & Takahashi, S., 2003, Nature, 423, 843
- Urata et al. (2003) Urata Y., 2003, Rome2002 procceings
- Vanderspek et al. (2003) Vanderspek, R., et al., 2003, GCN Circ., 1997
- Zaritsky et al. (2003) Zaritsky, D., Bolte, M., Garnavich, P. M., Bonanos, A. Z., & Stanek, K. Z. 2003, GCN Circ., 2169
| Interval | breakb | |||||
|---|---|---|---|---|---|---|
| — | — | — | 0.58 | 12 | ||
| — | 0.085d | 0.69c | 11 | |||
| — | — | — | 0.80 | 27 | ||
| — | 0.163d | 0.49 | 25 | |||
| — | — | — | 1.10 | 35 | ||
| — | 0.227d | 1.20 | 33 |
a A single power-law fit, with being the decay index.
b A fit with the smoothly broken power-law model described in the text.
c The smoothness parameter is fixed at .