Towards a Deterministic Model of Planetary Formation I: a Desert in the Mass and Semi Major Axis Distributions of Extra Solar Planets
Abstract
In an attempt to develop a deterministic theory for planet formation, we examine the accretion of cores of giant planets from planetesimals, gas accretion onto the cores, and their orbital migration. We adopt a working model for nascent protostellar disks with a wide variety of surface density distributions in order to explore the range of diversity among extra solar planetary systems. We evaluate the cores’ mass-growth rate through runaway planetesimal accretion and oligarchic growth. The accretion rate of cores is estimated with a two-body approximation. In the inner regions of disks, the cores’ eccentricity is effectively damped by the ambient disk gas and their early growth is stalled by “isolation”. In the outer regions, the cores’ growth rate is much slower. If some cores can acquire more mass than a critical value of several Earth masses during the persistence of the disk gas, they would be able to rapidly accrete gas and evolve into gas giant planets. The gas accretion process is initially regulated by the Kelvin-Helmholtz contraction of the planets’ gas envelope. Based on the assumption that the exponential decay of the disk-gas mass occurs on the time scales years and that the disk mass distribution is comparable to those inferred from the observations of circumstellar disks of T Tauri stars, we carry out simulations to predict the distributions of masses and semi major axes of extra solar planets. In disks as massive as the minimum-mass disk for the Solar system, gas giants can form only slightly outside the “ice boundary” at a few AU. But, cores can rapidly grow above the critical mass interior to the ice boundary in protostellar disks with 5 times more heavy elements than those of the minimum-mass disk. Thereafter, these massive cores accrete gas prior to its depletion and evolve into gas giants. Unimpeded dynamical accretion of gas is a runaway process which is terminated when the residual gas is depleted either globally or locally in the form of a gap in the vicinity of their orbits. Since planets’ masses grow rapidly from to , the gas giant planets rarely form with asymptotic masses in this intermediate range. Our model predicts a paucity of extra solar planets with mass in the range 10- and semi major axis less than 3AU. We refer to this deficit as a “planet desert”. We also examine the dynamical evolution of protoplanets by considering the effect of orbital migration of giant planets due to their tidal interactions with the gas disks, after they have opened up gaps in the disks. The effect of migration is to sharpen the boundaries and to enhance the contrast of the planet desert. It also clarifies the separation between the three populations of rocky, gas-giant, and ice-giant planets. Based on our results, we suggest that the planets’ mass versus semi major axes diagram can provide strong constraints on the dominant formation processes of planets analogous to the implications of the color-magnitude diagram on the paths of stellar evolution. Finally, we show that the mass and semi major axis distributions generated in our simulations for the gas giants are consistent with those of the known extra solar planets. Future observations can determine the existence and the boundaries of the planet desert in this diagram, which can be used to extrapolate the ubiquity of rocky planets around nearby stars.
1 Introduction
More than 100 extra solar planets have been discovered so far. This sample is sufficiently large that some clues and constraints on the formation of extra solar planets may be inferred from their kinematic properties. Figure 1 shows the distributions of semi major axes () and masses () of the known extra solar planets as of July 2003 (http://www.obspm.fr/encycl/encycl.html). Various radial-velocity surveys may have exhaustively found most of the planets in the solar neighborhood with radial velocity amplitude ms-1 and relatively small semi major axes, -5AU, which correspond to orbital periods years. The mass distribution in these regions appears to follow a weak power-law function in with an abrupt upper cut-off at around 10 , (Jorissen et al., 2001; Tabachnik & Tremaine, 2002; Zucker & Mazeh, 2002) where is a Jupiter mass and is ( is an Earth mass).
But, Figure 1 also shows a correlation between the and distributions. Zucker & Mazeh (2002), Patzold & Rauer (2002) and Udry et al. (2003) discussed a deficit of massive () and short period (AU) planets. Here we focus on another domain of paucity in the distribution: the regions AU and (Figure 1). This paucity is not due to the observational selection effects of precision and legacy baseline since planets in this domain have ms-1 and orbital periods less than a few years (Udry et al., 2003). In this paper, we suggest that this paucity reflects the condition for and the process of planetary formation.
We interpret the observational data on Jupiter-mass extra solar planets with the conventional core accretion model of gas giant planets (Wuchterl et al. 2000 and references therein). In the standard model, terrestrial planets and solid cores of gas giants are formed through the coagulation of planetesimals with initial sizes 1-10 km, e.g., (Safronov, 1969; Wetherill, 1980; Hayashi et al., 1985). Cores which are heavier than a few lunar masses attract the disk gas and form hydrostatic atmospheres. But, if a solid core reaches a critical mass of several (§3.1), the pressure gradient in planet’s gaseous atmosphere can no longer support against its gravity and the planet’s atmosphere collapses onto its core (Mizuno, 1980; Bodenheimer & Pollack, 1986; Pollack et al., 1996; Ikoma et al., 2000). Subsequent disk gas accretion onto the solid core forms a gas giant planet.
The cores’ asymptotic masses and their accretion time scales are determined by surface density of the planetesimal swarm and orbital radius (Kokubo & Ida, 2002). In general, the formation of the gas giants is favored slightly exterior to the “ice boundary” at a few AU (Kokubo & Ida, 2002), where the surface density of dust particles increases by a factor three to four as ice condenses. This enhancement of the dust surface density facilitates the formation of large cores. Well beyond the “ice boundary” (AU), the cores’ growth rate is so small that the residual gas in the disk tends to be depleted before it can be accreted. In very massive protoplanetary disks, however, cores can reach the critical mass interior to the ice boundary (Lin & Ida, 1997; Kokubo & Ida, 2002). Since the core accretion is relatively fast in the inner regions of the disk, gas accretion onto cores can start well before the gas is depleted. Unimpeded dynamical accretion of gas is a runaway process which is terminated when the residual gas is depleted either globally or locally in the form of a gap in the vicinity of the gas giants’ orbits. But, prior to a self-limiting growth stage, the planets grow so rapidly from to more than , that they rarely emerge with an asymptotic mass in the intermediate range (). We will refer to such a planet-deficit domain in versus distribution as a “planet desert”.
After their formation, gas giant planets with sufficiently large masses to open up gaps also undergo type II orbital migration which is well coupled to the viscous evolution of their nascent disks (Lin & Papaloizou, 1985). If these planets’ tidal and magnetospheric interaction with their host stars can halt their inward migration, there would be an accumulation of “short-period planets” (equivalently “close-in planets”, or “hot Jupiters”), near the disk inner edge (AU). Dozens of short-period planets have been discovered (Marcy et al., 2000) and their masses appear to be relatively small (Udry et al., 2003). These planets have either formed with relatively low masses (see §4) or lost some of their initial mass through Roche lobe overflow (Trilling et al., 1998; Gu et al., 2003). The latter process is only effective in the regions close to the stellar surface. Massive short-period planets may also be more vulnerable to post formation orbital decay due to their enhanced tidal interaction with their host stars (Zucker & Mazeh, 2002; Patzold & Rauer, 2002).
Gas giant planets may attain in the range of at AU, only if the disk gas is timely depleted during their migration (Trilling et al., 2002; Armitage et al., 2002). Type II migration proceeds at a faster pace for planets with relatively lower mass and smaller orbital radius. As shown in §5, the intermediate-mass planets can open up gaps in inner regions (AU) and easily migrate to the proximity of the host stars. Larger planets tend to migrate less rapidly than the intermediate-mass planets.
Intermediate-mass planets with insufficient masses to open gaps also interact tidally with the disk gas through their Lindblad and corotation resonances (Goldreich & Tremaine, 1980). In principle, any imbalance in the torque can lead to “type I” migration (Ward, 1986). The effect of the corotation resonances (Tanaka et al., 2002) and secondary instabilities in the vicinity of the coorbital region (Balmforth & Korycansky, 2001) may be able to quench the magnitude and sign of the net torque. Observationally, there is no evidence that type I migration has brought in any water-filled terrestrial planets into the inner Solar system.
Well outside the ice boundary (AU), the intermediate-mass planets can slowly accrete nearby planetesimals. Prior to the depletion of the gas, however, intermediate-mass planets are unable to open up gaps in outer regions. In the absence of type I migration, they cannot migrate to the inner region from larger orbital radii. Cores in the outer regions of the disk can attain masses in excess of after the gas depletion (§2). The mass distribution for long-period planets are expected to be continuous. But, with the residual gas depleted, the intermediate-mass planets which formed lately cannot migrate to fill the planet desert.
Based on these considerations, we suggest that the intermediate-mass planets may be rare and their deficit gives rise to a “planet desert” at AU. In §2, we present the model of core accretion and predict cores’ masses as functions of their nascent disks’ mass and semi major axis. In §3, we include the effects of gas accretion onto the cores. Assuming an appropriate distribution of disk masses that may be comparable to the observationally inferred mass distribution, we carry out, in §4, Monte Carlo calculations to simulate the mass and semi major axis distributions of extra solar planets. The predicted distributions clearly show a paucity of planets with masses at AU. §5 discusses the effects of radial migration of giant planets due to their tidal interaction with a gas disk. We show that type II migration sharpens the boundaries and enhances the contrast of the planet desert. In §6, we summarize our results.
2 Core Accretion
In this section, we briefly recapitulate the current theories for solid core accretion. Our main objective is to determine the cores’ growth rate and asymptotic masses.
2.1 Core accretion model: the feeding zone
In an early stage of planetesimal accretion, the largest planetesimals have the shortest mass-doubling time scale. This process is commonly referred to as the ’runaway growth’, e.g., (Greenberg et al., 1978; Wetherill & Stewart, 1989; Aarseth et al., 1993; Kokubo & Ida, 1996). In the limit that their velocity dispersion is relatively small, field planetesimals are readily captured by nearby runaway bodies (cores). However, the differential Keplerian speed of the planetesimals prevents them from reaching the distant runaway cores until they have acquired sufficient orbital eccentricity. The region within which that the runaway cores can directly accrete planetesimals is commonly referred to as the ‘feeding zone’. When the runaway cores capture all the planetesimals in their feeding zones, their growth stops as they acquire an ’isolation mass’. Lissauer (1987) evaluated the isolation mass as a function of the initial surface density of the solid components in protostellar disks. Assuming a negligible velocity dispersion for the planetesimals, the full width of the feeding zone is given by where
| (1) |
is the Hill radius (Roche lobe radius) for a solid core with a mass around a host star with a mass .
However, when a core becomes sufficiently massive to excite the eccentricity and to pump up velocity dispersion of the neighboring planetesimals, its feeding zone expands. The increases in the relative speed between the planetesimals and the cores also reduce the effective cross section of the cores such that their growth slows down (Ida & Makino, 1993; Aarseth et al., 1993; Rafikov, 2003). The relatively massive cores are more effective in stirring up the velocity dispersion of their neighbors so that the reduction of their effective cross section is larger. Consequently, the growth time scale becomes an increasing function of the cores’ mass. Such a self-regulated growth results in the formation of a population of comparable-mass cores which are embedded in a swarm of small and relatively eccentric planetesimals (Kokubo & Ida, 1998, 2000; Thommes et al., 2002). In this system, the orbital spacings of the cores (equivalently, full width of their feeding zone, ) are nearly equal to one another and are as large as . This maximization of spacing is the combined consequence of the distant perturbations between the cores and the effect of dynamical friction from the small planetesimals on the cores (Kokubo & Ida, 1995). Kokubo & Ida (1998) called this coagulation process, the ’oligarchic growth’. Because the width of the feeding zone is
| (2) |
during the oligarchic growth stage, the isolation masses are slightly larger than those estimated by Lissauer (1987).
The concept of an isolation mass induced by the depletion of the feeding zone is based on the assumption that the orbits of the cores do not evolve with time. In reality, the cores undergo radial diffusion due to their scattering of the field planetesimals, e.g., (Murray et al., 1998; Ida et al., 2000) and their tidal interaction with the gas disk (type I migration), e.g., (Goldreich & Tremaine, 1980; Ward, 1986). Under the action of gas drag, the small planetesimals and dust particles may also undergo migration, e.g., (Adachi et al., 1976). These effects can lead to an expansion of the feeding zones. Thus, in a prescription for the asymptotic mass of cores’ growth, it is worthwhile to consider the possibility that the cores’ feeding zone may be extended throughout the disk.
2.2 The cores’ growth rate
The growth rate of the cores is determined by the velocity dispersion () or equivalently the eccentricity distribution of the planetesimals and cores. Eccentricity damping due to their tidal interaction with the disk gas (Artymowicz, 1993; Ward, 1993) inhibits the cores from attaining any significant growth in their velocity dispersion. In contrast, the eccentricity of the low-mass planetesimals is less effectively damped. Instead, it is excited by cores through recoil of dynamical friction. Through a series of 3D numerical simulations, Kokubo & Ida (2002) showed the planetesimals’ eccentricity is larger than the ratio of the cores’ and their semi major axes so that the cores’ growth time scale is well described by a simple two-body approximation.
In the modest to high- limit, the cores’ accretion rate at an orbital radius is (Safronov, 1969)
| (3) |
where is a Kepler frequency, and are the spatial and surface density of solid components (), and is a physical radius of the core. In order for the planetesimals within to reach the cores,
| (4) |
so that the solid cores’ accretion time scale is
| (5) |
where years] is the Kepler period. By taking into account the effect of gas drag on the planetesimals’ velocity dispersion, Kokubo & Ida (2002) derived a more detailed expression (see their eqs.15 and 16),
| (6) |
where is the surface density of the gas in the disk, is the mass of typical planetesimals, and is the Sun’s mass. Since , we find from eq. (6)
| (7) |
where we neglect variations of and with time. This approximation is adequately satisfied in the inner regions of the disk where is small compared with the gas depletion time scale.
In the outer regions of the disk, the rate of mass growth is reduced from the above expression during the depletion of the disk gas. In eq. (48), we introduce a prescription for the global depletion of the gas. For this prescription of , the evolution of the core mass becomes
| (8) |
where is the disk depletion time scale. In the limit of , eq. (8) reduces to eq. (7).
According to eq. (8), the cores attain an asymptotic mass. But for , the assumptions for circular orbits of the cores and damping of planetesimals’ by gas drag break down. When all the gas is depleted and all the heavy elemental content is retained by the oligarchic cores, their increases to become comparable to their characteristic surface speed and their collisional cross section reduces to their physical cross section. In this limit, the growth time scale for the final planetary embryos become
| (9) |
where , , and are a mass, radius, and an internal density of the embryo. Here, we refer to solid planets after depletion of the gas as ”embryos” rather than ”cores”. The reduced collisional cross section significantly lengthens the growth time scale for the embryos from that of the cores. The corresponding mass for the embryos is
| (10) |
2.3 Disk structure models: the temperature and surface density distributions.
The cores and embryos’ mass, as expressed in both eqs. (8) and (10), is a function of the surface density of the heavy elements in the form of condensed grains and planetesimals, . The distribution of is poorly determined theoretically and observationally. In principle, the distribution is determined by the infall pattern of the heavy elements, the condensation, growth, and sublimation rates of grains, and the particles’ interaction with ambient disk gas. Here, we adopt an ad hoc power-law distribution such that
| (11) |
based on a phenomenological minimum-mass solar nebula model (Hayashi, 1981). The power-law dependence may be the consequence of self-similar evolution. We use this prescription as a fiducial model. We plot as a function of for and 10 in Fig. 2. Using these models, we assess the formation properties of planetary systems as a function of . The step-function variable is introduced to express the effect of ice condensation/sublimation across the ice boundary ( a few AU; see eq. [15]). For the inner disk with , and for outer regions with , . Following the minimum-mass solar nebula model, we adopt to represent the Solar abundance distribution (Hayashi, 1981).
We also introduce a scaling parameter for the total disk mass, , which is assumed to be a constant parameter throughout the disk. In the case of the minimum-mass disk model for the Solar system (Hayashi, 1981), the scaling parameter . This value would be larger if the formation of the solid cores and their retention into the Solar system planets were not highly efficient. Radio observations of the continuum radiation in the mm-wave length range measure the dust emission from the disks. The observationally inferred total mass of dust, , in the protostellar disks around classical T Tauri stars ranges from to , e.g., (Beckwith & Sargent, 1996). The disk mass determinations are somewhat uncertain due to the poorly known radiative properties of the grains. Nevertheless, their differential dust content provides a reasonable evidence for a greater than an orders of magnitude dispersion in . In addition, the image of the disks is not well resolved in many cases. A rough magnitude of can be inferred from the the total mass of the disk under the assumption that all disks have similar sizes (a few tens AU to a hundred AU). The observationally inferred mass of T Tauri disks corresponds to a range of . We note that disks with substantially larger than unity do commonly exist.
The presence of gas affects the velocity dispersion and therefore the growth rate of the cores. It is also important for the formation of gaseous giant planets. In principle, the magnitude of the gas surface density is determined by the gas infall rate and it evolves as a consequence of the viscous stress in the disk, e.g., (Lin & Papaloizou, 1985). Similar to all astrophysical accretion disks, the effective viscosity is generally assumed to be due to turbulence. But, in regions of protostellar disks where planets emerge, the cause of turbulence is highly uncertain (Papaloizou & Lin, 1995). For computational simplicity, we also assume that has a similar power law dependence on as such that
| (12) |
We vary the scaling parameter to obtain different disk models and to test the dependence of the planetary properties on the mass of the gas disk. This assumption implies that the relative ratio of gas (volatiles) to dust (refractories composed mainly of heavy elements)
| (13) |
is uniform throughout the disk except across the discontinuity at the ice boundary. While would represent the Solar abundance, a different choice of would represent the relative enrichment/depletion of the heavy elements in the disks.
In the above equations, we introduce a separate mass scaling parameter for the gas in order to consider the possibility that the solid components may evolve independently from the gas. The basic concept of the minimum-mass solar nebula model is based on the assumption that all the heavy elements are retained while the original disk gas was depleted. Theories suggest that gas diffuses under the action of viscous stress, but dust and planetesimals migrate under the influence of the gas drag effect such that they tend to evolve independently from each other. Gas may also be preferentially depleted through the photo evaporation e.g., (Shu et al., 1993; Matsuyama et al., 2003) and winds while dusty grains may be preferentially retained by the disk (Shang et al., 2000).
At the moment, we can observe the dust component around most, and molecular hydrogen around a few, young stars. Among the classical T Tauri stars, there is no apparent dependence of the mass of the dust disks on the host stars’ ages. For stars with ages greater than years, the dust mass inferred from the mm-wave length continuum is much reduced (Beckwith & Sargent, 1996; Wyatt et al., 2003). The near-IR signatures of disks also evolves on a similar time scale (Haisch et al., 2001). This decline has been interpreted as an evidence for dust growth and planetesimal formation rather than the depletion of heavy elements (D’Alessio et al., 2001). In this paper, we adopt the conjecture that the surface density distribution of the dust plus planetesimals does not change except in those regions where they have been totally accreted by the cores.
Very little information is available on the evolution of and , but there is no indication of divergent depletion pattern between molecular hydrogen and mm-size dust emission (Thi et al., 2001). In addition, the presence of spectral evidences and UV veiling for ongoing accretion are well correlated with the mm flux for the classical T Tauri stars. Both signatures of protostellar disks also disappear together among weak line T Tauri stars (Duvert et al., 2000). Based on these observations, we adopt the most simple-minded assumption that gas is depleted on a similar time scale even though the gas and dust depletion proceed through different mechanisms.
In eq. (11) we introduce a parameter to take into account of the possibility of ice condensation. In order to determine the radius of the ice condensation, , we need to specify the gas temperature in the disk. In most planet-forming regions of interest, the gas density is sufficiently large to maintain a thermal coupling between the gas and the dust particles. In the optically thin regions of the disk, the dust and the gas are heated to an equilibrium temperature (Hayashi, 1981) such that
| (14) |
For solar-type stars, the stellar luminosity is roughly proportional to . Since corresponds to the radius where K, we find that
| (15) |
Hereafter, we adopt AU () until §4.1. In the Monte Carlo calculations in §4.2 and 5, we consider variation of . Since scale height of a gas disk is where is sound velocity, from eq. (14), we find
| (16) |
2.4 The cores’ asymptotic mass
Based on the distributions of given by eq. (11), we find from eq. (7),
| (17) |
by assuming g. Equivalently, the core accretion time scale is (eq. [6])
| (18) |
Note that the actual time scale to reach is but not . The numerical factor of 3 comes from the dependence that .
The unimpeded core growth which is described by eq.(17) can not be sustained indefinitely. In the limit that damping effect due to disk-planet interaction (Artymowicz, 1993; Ward, 1993) regulates a small velocity dispersion for the cores, their growth terminates when they consume all the planetesimals in their feeding zones. If the radial diffusion/migration of the cores is neglected, the isolation mass (Lissauer, 1987; Kokubo & Ida, 1998, 2000)
| (19) |
represents the asymptotic mass of the cores prior to the depletion of the disk gas. If we adopt (where in is replaced by ), the isolation mass would be
| (20) |
Upon acquiring , the cores consume all the nearby planetesimals. These cores cannot cross each other’s orbits, until the gaseous-disk mass has decreased to , equivalently , and the damping effect due to disk-planet interaction becomes weak enough (Iwasaki et al., 2002; Kominami & Ida, 2002). Even in a gas free environment, a swarm of planetesimals has a tendency to evolve into a quasi-static oligarchic state. Kokubo & Ida (2002) performed three-dimensional N-body (with N=10,000) simulations of planetesimal accretion in gas-free disks with a wide variety of surface density distribution of the planetesimal swarm. Their results indicate that the process of planetary accretion is fully consistent with the oligarchic growth scenario, i.e. the cores initially emerge with a characteristic orbital separation of . In later stages, however, increases to , which may be due to the radial diffusion of the cores (they neglected radial migration due to disk-planet interaction and did not include the effect of gas drag on a population of small planetesimals). Here we adopt . From eq. (11), we estimate the core masses in protoplanetary systems with eq. (20) such that
| (21) |
If the effect of radial diffusion/migration of the cores is included, the final core mass could become larger than . In the limiting case that a migrating core can acquire all the planetesimals interior to its orbital semi major axis, it would attain a maximum asymptotic mass
| (22) |
Based on the distributions of given by eq. (11), we find
| (23) |
Growth beyond isolation is also possible after the gas depletion and the elimination of its damping effects (Iwasaki et al., 2002; Kominami & Ida, 2002). After the gas depletion, the velocity dispersion of the residual cores grows until they cross each other’s orbit. The final stages of cores’ growth may proceed through giant impacts (Lissauer & Stewart, 1993). Eventually a few surviving embryos acquire most of the residual planetesimals and less massive cores during the late oligarchic-growth stage. Since their collisional cross section is reduced to their geometrical surface, the mass of the embryos evolves with the growth rate given by eq. (9),
| (24) |
The asymptotic embryos’ masses are given by eq. (20) with ,
| (25) |
Such a scenario is consistent with the current model for the origin of the Moon (Hartmann & Davis, 1975; Cameron & Ward, 1976), and the apparently young isotropic age of the Earth, in comparison with asteroid parent bodies (Halliday et al. 2000). Note that even if large-mass cores can be assembled through giant impacts, they can no longer initiate gas accretion because the disk gas needs to be severely depleted prior to their emergence. The limited gas supply during the late phase of core growth through giant impacts is also consistent with the intermediate mass and mostly-ice composition of Uranus and Neptune.
In outer regions, the growth of the cores may be terminated before their mass reaches or . When their characteristic surface speed exceeds their local escape speed from the host star, , the embryos’ grazing scatterings of nearby bodies can lead to the bodies’ ejection (Thommes et al., 2003). In this high limit, the ratio of collision to ejection probabilities is . When become significantly less than unity, the growth of the embryos is terminated. Based on previous numerical simulations (Lin & Ida, 1997), we set such that most scatterings lead to ejection and the embryos’ asymptotic mass becomes
| (26) |
where is the embryos’ physical radius. For an average ice embryo, with an internal density g cm-3, the asymptotic mass of the embryos is
| (27) |
This limiting mass at AU is comparable to those of the cores of Uranus and Neptune. Note that this limit only applies to the scattering of planetesimals and cores and it is not a limiting mass for gas accretion (see §3). For notations of masses, time scales, etc., see Table 1.
In principle, the largest cores may emerge with sufficient asymptotic masses to initiate gas accretion (see below). But in many regions, this large mass can only be attained after the gas is depleted. Thus, they are prohibited from evolving into gaseous giant planets. In this paper, we consider the formation of the gas giants only if some cores are able to acquire the critical mass for the onset of rapid gas accretion before the disk gas is depleted. We assume that the coalescence between the cores, through giant impacts after the gas depletion, do not lead to substantial further growth in the mass of their gaseous envelopes despite the possibility of substantial increases in their core mass.
2.5 Core growth at different orbital radii
With the above prescriptions, we estimate, with eq. (7), the cores’ growth rate and asymptotic mass limit. The initial mass of the cores is arbitrarily set to be a small value, g. The choice of an initial value of does not affect the results, since increases with . We plot, in Figure 3a, the core masses, after years and years, as a function of at various locations . For this determination, we assume that the growth of the cores is truncated with a mass (eq. [21]). We also assume . A similar plot with the cores’ truncation mass set by (eq. [22]) instead of is shown in Fig. 3b.
As shown in eq. (7), the cores’ growth is relatively fast in regions where is high and is small. The results in Figures 3 show that for this region of the parameter space, the cores’ growth is terminated with their asymptotic masses within years. In contrast, the growth is relatively slow for regions of parameter space with relatively small and large so that remains to be very low in the right lower regions in Figures 3. An “accretion wave” propagates from the top-left to the lower-right regions as time passes. In the very large and large regions, for exceeds the magnitude of . Thus, the appropriate expression for the truncation mass is rather than in these regions.
Next, we consider planetary systems with a distribution similar to that derived from a minimum-mass solar nebula model (see eq. [11]). Figures 4 show some examples of the time evolution of the cores’ masses for (a) and (b) . The jumps in the cores’ masses at 2.7AU in these figures reflect a transition in the values of . These results indicate that in the inner regions of the disk, the gas depletion time scale is longer than the build-up time scale for the cores and all the field planetesimals are accreted onto the isolated cores. But, for the minimum-mass solar nebula model (with ), at 0.7 and 1 AU is considerably smaller than the present masses of Venus and Earth (see eq. [21]). These planets could have acquired their present mass through either giant impacts after depletion of the gas or the accretion of planetesimals prior to the gas depletion if they have diffused or migrated over large radial distances. In this case, the cores’ asymptotic mass would be (eq. [25]) or (eq. [23]) which, at 0.7 and 1AU, is comparable to the mass of the Earth and Venus.
For a more comprehensive parameter study, we show in Figures 5, the dependence of the cores’ mass on and after years and years. In these calculations, does not decline and is set to be always equal to since the stages prior to depletion of the gas are considered. The magnitude of for the minimum-mass solar nebula model corresponds to . On the gas depletion time scale years, the most massive cores attain a critical mass ( several ) just outside the ice boundary (2.7AU). Although the magnitude of both and increases with , the expression in eq. (17) indicates that much beyond , the cores do not have sufficient time to attain their asymptotic values prior to the depletion of the disk gas. In this case, the formation of gas giants within a minimum-mass solar nebula is most likely to be initiated just exterior to the ice boundary. But around many classical T Tauri stars, the disk mass inferred from the mm-wave length continuum observation corresponds (see §1). The results in Figs. 5a and b suggest that in very massive protoplanetary disks with , cores can rapidly attain masses greater than the critical mass for gas accretion (see next section) even inside the ice boundary.
After the gas depletion, expands to or . can also limit embryo growth (see, §4.2.3 and Fig. 10). In the calculations in the following sections, we set the asymptotic masses of cores and embryos as follows:
-
•
the isolated core model
-
–
min, when (before the gas depletion).
-
–
min, when (after the gas depletion).
-
–
-
•
the non isolated core model
-
–
, when .
-
–
min when .
-
–
3 Gas accretion
Up to now, we only consider the drag effect induced by the gas on the damping of the planetesimals’ and cores’ velocity dispersion. In this section, we consider the accretion of gas onto sufficiently massive cores. The necessary condition for any gas accumulation near the cores is that their surface escape velocity must exceed the sound speed of the disk gas. In regions of the disk where dust can condense to form planets, the sound speed is less than a few km s-1 such that even lunar-mass cores can attract gas to their proximity. However, the disk gas first accumulate into a static envelope around these cores. In this envelope, the gravity of the cores is balanced by a pressure gradient which is maintained by the energy release during the planetesimals bombardment onto the cores.
3.1 Gas accretion onto cores
But, when the cores’ mass () becomes larger than a critical value (), the state of quasi hydrostatic equilibrium can no longer be maintained and a phase of gas accretion onto the core is initiated (Mizuno, 1980; Bodenheimer & Pollack, 1986). Thereafter, the planetesimals and gas accretion proceed concurrently, so that the planetary growth can no longer be expressed in an analytical form as that in eq. (17). Based on the existing numerical results we adopt a simple prescription to evaluate and the gas accretion rate, .
The critical core mass depends on the cores’ rate of planetesimal accretion () and the opacity () associated with the disk gas. Faster accretion and higher opacity (relatively large and ) result in a warmer planetary atmosphere and the enhanced pressure gradient stalls the gas accretion (Stevenson, 1982; Ikoma et al., 2000). Based on a series of numerical models, Ikoma et al. (2000) find that the critical core mass has the following dependence,
| (28) |
We adopt here a power index for the dependence on . If the dust particles have a similar distribution and abundance as the interstellar medium, . The actual magnitude of is uncertain since the dust particles’ size distribution and the fraction of heavy element in the gas and solid phases are poorly known (Podolak, 2003). For computational simplicity, we neglect, the dependence of on in our prescription below.
The gaseous envelope of proto giant planets contracts on a Kelvin Helmholtz time scale when their masses (including both their solid cores and gaseous envelope) become larger than . Ikoma et al. (2000) derived through numerical calculation that
| (29) |
with power index and . However, with different opacity table, the values of and can be changed to be and respectively (Ikoma, private communication). Bryden et al. (2000b) obtained by fitting the result of Pollack et al. (1996). We adopt here and and also neglect the dependence on in our prescription below.
The contraction of the gas envelope reduces the local pressure gradient. Consequently, the gas from the surrounding disk flows toward the cores to replenish the envelope at a rate
| (30) |
This rate is well below the Bondi accretion rate (Bondi, 1952) when so the gas accretion rate is insensitive to the boundary condition in the disk. The magnitude of due to the Kelvin Helmholtz contraction increases rapidly with . In principle, is limited by the Bondi accretion rate (Bondi, 1952), the Keplerian shear in the gas inflow (Tanigawa & Watanabe, 2000), mass diffusion rate through the disk Bryden et al. (1999), and the availability of gas near the orbit of the accreting planet. But, these effects become important only when has already become a significant fraction of Jupiter’s mass . For , is reduced to the dynamical free-fall time scale and the growth time scale for Bondi accretion is reduced to years. Thus, the total gas accretion time for the protoplanets to attain their asymptotic masses is essentially determined by at .
Note that when reaches , is reduced to zero. Consequently, also vanishes and gas accretion can start for any value of . However, if
| (31) |
the gas accretion rate is so small (eq. [30]) that is not significantly increased by the gas accretion during the first years after they were formed. In order for the gas giants to actually form and acquire , must be larger than in addition to the requirement of . Both of conditions can be satisfied for , if the cores’ rate of planetesimal accretion is significantly reduced from that in eq. (3).
3.2 A prescription for the growth of gas giant planets
Based on the above considerations, we introduce the following simple prescription for the purpose of numerically integrating the formation and early evolution of the gaseous giant planets. These approximation captures the essence of the planet formation process.
- •
-
•
During the growth of the cores, we check whether is less than the critical core mass for the onset of gas accretion. Based on the discussions in the previous subsection, the magnitude of is approximated with a simplified version of eq. (28) such that
(33) In principle, as the field planetesimals are being accreted onto the cores, their surface density in the feeding zone declines, so that both and decrease. To take this effect into account, we use time-dependent values of calculated in (32) and set for cores with or .
-
•
When exceeds , gas accretion onto a core is set to start. The gas accretion rate is regulated by the efficiency of heat transfer and it is approximated by a simplified version of eqs. (29) and (30) such that
(34) The planets’ mass includes both their gaseous envelope and cores. Due to the expansion of the growing planets’ feed zones, planetesimal accretion onto the cores continues after the gas accretion has started. But, we neglect the collisions between cores until after the disk gas is depleted as we have discussed in the last section.
-
•
The above gas accretion rate does not explicitly depend on the ambient conditions. The approximation is appropriate provided there is an adequate supply of the disk gas. However, the disk gas may be depleted either globally through processes such as the viscous evolution, outflow, and photo evaporation or locally through gap formation. These effects are taken into account in the determination of the asymptotic mass of the giant planets (see the next subsection) but not in their accretion rates.
-
•
In the limit that the growth of the gas giant planets is terminated by gap formation, we also consider their dynamical evolution with or without the type-II orbital migration (see the next section).
3.3 Termination of gas accretion
Equation (34) shows that the gas accretion rate rapidly increases with . However, there are several asymptotic limits to the unimpeded runaway gas accretion process. These limits arise due to the local and global depletion of disk gas.
3.3.1 Local gas depletion
In an inviscid disk, gas accretion onto the cores is terminated when they consume all the gas in their feeding zone and attain an isolation mass. The isolation mass for the gas giants can be obtained by replacing in eq. (20) with such as
| (35) |
where the Hill (Roche lobe) radius is evaluated with . For a fiducial magnitude of , we used the width of gas feeding zone to be a nominal value. Since it flows normally on circular orbits, gas which is much beyond cannot reach the accreting cores without modifying their specific angular momentum. Using the distribution in eq. (12), we find
| (36) |
which is comparable to at the present location of Jupiter. Since and equivalently decrease with time, also decreases with time. is set to be zero when becomes larger than .
However, the observed accretion flow from protostellar disks to their host stars (Hartmann et al., 1998) requires mass and angular momentum transfer throughout the disks. In a viscously evolving disk, gas can continuously diffuse into the feeding zone until the growing planet attains a mass (Lin & Papaloizou, 1985),
| (37) |
where we used eq. (16) and -prescription for the effective viscosity (Shakura & Sunyaev 1973), in which where is a dimensionless parameter. For , an embedded planet induces a strong tidal torque to open a gap near its orbit, provided its Hill (Roche lobe) radius is larger than a critical value (Lin & Papaloizou, 1993; Bryden et al., 2000a). We find that when
| (38) |
Because is generally larger than except for some very large cases, gas inflow onto the planet would actually be halted, when reaches . In some previous hydrodynamic simulations, embedded protoplanets continue to accrete after the above condition is satisfied albeit at a reduced rate (Artymowicz & Lubow, 1996). In oder to take this possibility into account, we also modify, in one set of calculations, the truncation condition to .
3.3.2 Global gas depletion
Before their increases to the isolation mass, , protoplanets can accrete at the rate given in eq. (34). But, for , additional disk material can no longer be brought into the feeding zone by the expansion of its boundary. Nevertheless, in a viscously evolving disk, the feeding zone may be replenished. We also consider the extreme case that the protoplanets’ tidal interaction does not impinge the flow of the gas from the disk to their feeding zone.
Although gas diffusion can replenish the feeding zone, the rate of gas accretion onto the protoplanet is limited to
| (39) |
where the mass transfer rate in the disk,
| (40) |
the gas diffusion speed is determined by the efficiency of viscous transport
| (41) |
With the prescription for a steady disk, .
The magnitude of in the planet formation region is uncertain. We assume that the mass transfer rate throughout the disk is comparable to an observational inferred accretion rate from protostellar disks onto classical T Tauri stars (Hartmann et al., 1998) which can be fitted by
| (42) |
where year-1 for yr (Calvet et al., 2000). The actual data have an order of magnitude spread over this fit. The accretion rate onto the planets is limited by the gas replenishment rate of their feeding zone, , when their
| (43) |
or equivalently when their becomes larger than
| (44) |
(see eqs. [29] and [43]). The limiting replenishment rate only modifies for protoplanets more massive than both and . From eqs. (36) and (49), we find that these conditions are satisfied at the advanced stages of disk evolution when the surface density of the disk is significantly depleted.
At any given location, the emergence of cores which can dynamically accrete gas occurs at an epoch
| (45) |
for . According to eq. (42), the amount of mass can be supplied into the feeding zone for is
| (46) |
If such supply is considered, the isolation mass can increase from to . However, at large , is not a large enough. Since sufficiently massive cores (with ) take longer to form in the outer regions of the disk, the mass transfer rate can limit the amount of material supplied to the feeding zone, , to less than the mass of Jupiter.
The gas accretion is ultimately limited by the amount of residual gas in the entire disk. For our disk model, the maximum available mass is
| (47) |
When , is truncated by rather than . This condition occurs when . Similar to , explicitly depends on the magnitude of , i.e., the amount of residual gas in the disk.
As we have already indicated in §2 that the gas content are observed to decline concurrently with the dust (but not the planetesimal) content in protostellar disks. Since the near IR signature for dust in the inner region declines together with the mm indicators of dust in the outer regions of protostellar disks (Duvert et al., 2000), we assume that the residual gas in the these disks is depleted globally in a self similar manner. We introduce a prescription to approximate the evolution of during the depletion phase of the disk such that
| (48) |
where is an initial distribution (eq. [12]) and is gas depletion time scale. Equivalently, decreases with time from its initial value as
| (49) |
Based on the observed properties of protostellar disks (Beckwith & Sargent, 1996; Wyatt et al., 2003), we set years.
In order to limit the extent of the parameter studies, we also assume here that , that is, the gas-dust ratio is initially equal to the Solar composition. We denote both and to be . We consider the cases with as mentioned in the last section. We do not vary the value of during the cores’ growth but it is locally set to zero when the cores have reach their asymptotic masses.
Based on these prescriptions, we set an asymptotic mass for the gas giants. We assume that the gas accretion onto it is terminated when a protogiant planets either consumes all the nearby residual gas in the disk or has acquired a sufficiently large mass to open up a gap near its orbit.
4 Nascent Orbital Distribution of Potoplanets
In this section, we consider dynamical properties such as the mass-semi major axis distribution which planets are formed with. This distribution evolves with the orbital migration of the gas giant planets. We will discuss effect of orbital migration in the next section.
4.1 Conditions for the emergence of gaseous and ice giant planets
We compute a series of models with years. We determine the asymptotic (at years) magnitude of , including that of the gaseous envelope if any, as a function of () and (see Figures 6). For these models, we adopted the isolated core model (§2.5). We adopt five different prescriptions for the planets’ asymptotic mass after their gas accretion is truncated: (a) , (b) , (c) , (d) , and (e) . For the evaluation of the asymptotic mass of the gas giants, we adopt in (a) and (e), in (c) and (d), and in (c). Since the result of (e) is almost the same as that of (d), it is omitted. There are some uncertainties in the amount of gas diffusion to the planet’s feeding zone. These five upper mass limits provide a range in the asymptotic mass of the planets. In Figs. 7, we show the results of a second series of models computed with the non isolated core model (§2.5). All other parameters are identical to the first series of models.
For disks with a uniform , there are three distinct regions in Figures 6. Similar regions also exist in Figures 7 for disk with uniform . In the inner () regions, the asymptotic mass of the cores is smaller than , which is the minimum mass () needed to undergo a significant amount of gas accretion within years. Since gas is depleted on this time scale, gas giants can not form in these region. Although after gas depletion, the cores’ mass can exceed several through giant impacts between them, they can no longer accrete gas. These massive cores evolve into terrestrial planets similar to the Earth and the mass distinction between the terrestrial planets and gas giants is preserved.
In the outer regions of the disk where AU, the cores’ planetesimal accretion rate is very low. Although the asymptotic mass limit for the cores is large compared with several , there is inadequate amount of time for the cores to attain a significant amount of mass prior to the depletion of the disk gas. Nevertheless, low mass cores can slowly accrete gas because, for very low planetesimal accretion rates , the values of is also small. But, in the low- limit, the gas disk is severely depleted by the time becomes comparable to . In advanced stages of gas depletion, the magnitude of both and becomes smaller than and the cores cannot acquire a massive gaseous envelope. This limited supply of residual disk gas may have quenched the ability of Uranus and Neptune to attain a massive envelope () despite their present ice-core mass being (Pollack et al., 1996). We refer to these heavy element enhanced, late comers with modest gaseous envelopes as ice giant planets.
In the intermediate region slightly exterior to the ice boundaries, an abrupt increase in the cores’ asymptotic mass allows the cores to initiate the onset of rapid gas accretion. Gas giants with are preferentially formed in this bright region in Figures 6 and 7. The boundaries of the region where gas giants can form are set by the requirements that: (a) and (b) . The results in Figures 6 and 7 indicate that conditions (a) and (b) are satisfied, for , at (the ”rocky/gas-giant planets’ boundary”) AU and (the ”gas/ice giants’ boundary”) AU. Terrestrial planets form interior to and ice giants form exterior to . The values of of and are expressed in eqs. (53) and (54) below.
We now consider and for more general values of . Transition from cores to gas giants requires gas accretion and can only occur prior to gas depletion. But, in the presence of gas, the core growth is limited by their asymptotic masses. If the asymptotic mass is determined by the isolation process, it would become . In this case, condition (a) can only be satisfied if . From eq. (21), this necessary condition corresponds to
| (50) |
Similarly, in the non isolated limit, the condition that corresponds to
| (51) |
(see eq. [23]). These estimates agree with the terrestrial/gas-giant planets’ boundary in Figures 6 and 7, respectively. In comparison with the results in the first series, the emergence of the more massive cores in the second series of simulations enhances the probability and speeds up the onset of gas giant formation for modest values of .
In condition (b) (), the quantity is the actual growth time scale for the cores (see eq. [18]). From eq. (18), the condition for corresponds to
| (52) |
This condition does not depend on whether the asymptotic mass of the cores is limited by or . For , , and years, this equation indicates that , which also agrees well with the gas/ice giants’ boundary in Figures 6 and 7.
As the analytical derivation shows, the two boundaries separating the three regions nurture the formation of terrestrial planets, gas and ice giants and they do not depend on conditions of truncation of gas accretion. In the outer regions of the disk, the gas/ice giants’ boundary is also insensitive to the asymptotic mass of the cores. At large , the barrier for reaching is imposed by the persistence of disk gas on time scales rather than the asymptotic limit of the core’s mass.
For disks with arbitrary values of , the boundaries
| (53) |
and
| (54) |
are set by the conditions and respectively. In massive disks with considerable heavy elemental contents, may be considerably larger than unity. In these massive disks, is less than the ice boundary. In that case, it is possible to form gas giants interior to the ice boundary. In disks with smaller than a critical value
| (55) |
(the factors 0.9 and 0.4 correspond to the isolated and non isolated cases, respectively). These results are in agreement with the numerical results presented in Figures 6 and 7.
Since cores must attain at least before they can rapidly accrete gas, in metal deficit disks with , the gas giants cannot form. For a minimum mass solar nebula model, and is inside the ice line and outside the ice line such that gas giants can only form at large radii. Since is smaller beyond the ice line, it sets a more stringent condition with . They are also consistent with the apparent paucity of metal deficit stars with planets, e.g., (Gonzalez, 1997; Santos et al., 2001; Murray & Chaboyer, 2002) and (D. Fischer, private communication).
In the gas giant formation domain, the total mass of the planets increases rapidly through runaway gas accretion after it exceeds . Gas accretion continues until the gas is depleted either globally or locally near the planets’ orbits. Since the planets’ growth time scale from the onset of rapid gas accretion to their asymptotic mass is relatively short compared with the disk depletion time scale, planets with occupy a very limited domain interior to AU, as shown in Figures 6 and 7 (with the exception of the case where is limited by ). In outer regions (AU), however, ice giants in such mass ranges can be formed. Their cores attain sufficient mass to accrete gas only after the gas has already been depleted severely.
4.2 Prediction for mass and semi major axis distribution
Using the same theoretical model of core growth and gas accretion, we performed Monte Carlo calculations to produce a theoretical prediction for the distribution of extra solar planets to compare it with observations (Figure 1). Planets are assumed to form with equal probability per interval of . We assume the distribution as in Fig. 8 to be consistent with observational data (Beckwith & Sargent, 1996; Wyatt et al., 2003). This is a gaussian distribution in terms of with a center at and dispersion of 1.
We omit the high tail at , since such heavy disks are self gravitationally unstable in outer regions. The gravitational stability parameter (Toomre, 1964) for our disk models is
| (56) |
The mass transfer associated with the gravitational instability would rapidly decrease local surface density to a value such that (Lin & Pringle, 1990; Nakamoto & Nakagawa, 1994). Surface density in outer regions (AU) in massive disks () may be adjusted. In principle, we should use the adjusted surface density distribution. However, since most of giant planets found in our model are formed at AU, we adopt a simple cut-off at . We also examined a more artificial distribution in which is uniform in log scale from 0.1 to 30. But, the results are almost the same.
is distributed from to years uniformly in log scale, which is also consistent with observational data (Beckwith & Sargent, 1996; Wyatt et al., 2003). The range of stellar mass is also considered, so that is changed as eq. (15). The location of is essential for the formation of gas giants, as shown before. In order to directly compare with the observed data, we adopt a similar selection criterion for in the range of . Correspondingly, AU. We also assume a uniform distribution in log scale for . In each run, 10,000 initial conditions are taken.
We carry out calculations for planetary formation in disks with an evolving gas content. In these models, the cores’ accretion is truncated when their masses have attained asymptotic values of (the results with are similar). These results are shown in Figure 9. Three truncation asymptotic masses resulting from the truncation of gas accretion are considered: (a) , (b) and (c) , and (d) . We adopt in (a), the critical Hill’s radius being and in (b) and (c), respectively, and in (d).
In Figure 9, the green filled circles and blue crosses represent rocky and icy planets with an insignificant amount of gaseous envelopes around them. The green and blue open circles represent gas-rich rocky and icy planets with gaseous envelopes which are one to ten times more massive than their cores. The red filled circles represent gas giants with gaseous envelopes more than ten times more massive than their cores. The result in panel (a) yields most of gas giants form with masses an order of magnitude larger than Jupiter. Even larger masses would be obtainable if the gas accretion is unimpeded until becomes or . This inconsistency with the observed mass distribution of the extra solar planets is removed by the thermal gap formation condition as represented in panels (b) and (c). However, the viscous gap formation condition in (d) places an over strict upper limit on so that gas giants cannot form. Numerical simulations of disk-planet interaction indicate that is the appropriate upper limit for masses of gas giants (Bryden et al., 1999).
4.2.1 Planetary desert
In panels (a), (b), and (d), these results show a deficit of planets with intermediate mass (10-100) and semi major axis less than 3 AU. The ranges of the deficit is different in panels (a), (b), and (c). The lower mass boundary of the planet-deficit domain in Figure 9 is demarcated by for all models. This value of simply corresponds to the minimum core mass that can satisfy both and (§3.1), which are the condition for the cores to undergo rapid gas accretion. Transition across this boundary is weakened by the growth through giant impacts after the disk depletion. The truncation conditions of the cores and gas do not affect this boundary. Future observational determination of this lower mass boundary will provide useful information and constraints on the critical core mass which can lead to the onset of rapid gas accretion.
The upper mass boundary of the planet-deficit domain in Figure 9 is demarcated by the truncation condition for gas accretion. First, we consider the case of . The upper mass boundary of the planet-deficit domain corresponds to the minimum asymptotic mass of gas giants. As shown in eq. (50), in the case of core accretion being truncated by , rapid gas accretion would occur if In the inviscid-gaseous disk model, the gas accretion process is terminated by isolation when the planets mass reaches a value which is given by eq. (36). Since in all the calculations described here, we obtain, by substituting into eq. (36), a minimum truncated mass of gas giants in these regions to be
| (57) |
A similar calculation with (for cores to be truncated by ) yields
| (58) |
In regions of the disk where , cores cannot undergo rapid gas accretion. But, in regions where , cores accrete gas until reaches . The process of gas accretion can be stalled by the depletion of the disk gas. But the time scale for the planets to attain their asymptotic masses is shorter than the gas depletion time scale so that only small fraction of planets may attain some intermediate masses. Therefore, most planets that undergo gas accretion have , and corresponds to the upper mass boundary of the planet-deficit domain. Note that the -dependence vanishes in , so that the upper mass boundary is essentially independent of in panel (a). If asymptotic mass is regulated by , the observed upper boundary of the planet-deficit domain would provide constraints on the feeding zone width () of gas giants and the critical surface density of solid components that can produce cores large enough for gas accretion (equivalently, ).
4.2.2 Asymptotic mass of the gas giants
Next, the results with gas truncation by are considered. These conditions are particularly appropriate since the ongoing accretion from protostellar disks onto nearly all classical T Tauri stars clearly reflects the consequence of viscous transport of angular momentum and mass in the disks. The thermal truncation condition does not include an explicit dependence in the asymptotic mass of the gas giants. The mass dispersion of giant planets at given is caused by the dispersion of the stellar mass and is relatively small. The giant planet mass as a function of clearly reflects the gap opening condition (38). The upper mass boundary of the planet-deficit domain, or equivalently, the lower mass boundary of the giant planets domain, is demarcated by with in the present models. The truncation condition for the core growth stage does not affect the results. Note that we have adopted some idealized truncation conditions. In many numerical simulations, e.g., (Artymowicz & Lubow, 1996), there are indications that the gas flow on to the giant planets continues, albeit at some reduced rate, after the gap formation. Turbulence may be particularly important in sustaining the planets’ growth until they have acquired larger masses than those shown in panel (b) of Figure 9. In order to demonstrate this dependency, we consider in panel (c) an additional model with . This relaxed condition yields 3 times larger for the gas giants.
The main difference between panels (b) and (c) is abundance of the green and blue open circles which denote the gas-rich terrestrial (rocky) planets and ice giants with the mass of the envelope do not exceed ten times that of the core (i.e. ). From eqs. (21) and (38), we find
| (59) |
Although interior to the ice line, the critical value of for in panel b (where ) is within the range of (0.1-30) we have adopted in our simulations. Outside the ice boundary where , it is much more likely that for . Even though the mass of the gas-rich terrestrial planets and ice giants are dominated by their gaseous envelopes, the metallicity of their envelope may be greater than that of the disk. But, in panel c where , is much larger than . The asymptotic composition of the gas giants in these disks is diluted by the massive gaseous envelope.
4.2.3 Radial extent of planet forming region
The present scenario also indicates an outer boundary for the domain of gas or ice giant planet formation. The outer boundary for gas giants is set by (eq. [54]) where . Although in eq. (54), increases with , it is limited to 30 AU even for the maximum value of we have adopted. This limited extent of the gas-giant formation zone only applies to the core-accretion scenario. In the gravitational instability scenario, gas giants are preferentially formed far from their host stars. The spatial distribution of gas giants may provide a discriminating test for the avenue of planet formation.
After the gas depletion, the residual rocky and icy embryos can grow through giant impacts. In the above discussions, we have already indicated that core grow is limited by a) the availability of building-block material (through ; eq. [23]) and b) the retention efficiency (through ; eq. [27]). But, even with unimpeded growth and infinite supply of planetesimals, c) the maximum mass can be attained within the life span of the host star (), through collisional coagulation, is (eq. [10])
| (60) |
The boundary between conditions a) and b) is demarcated by and it occurs at
| (61) |
The boundary between conditions b) and c) is demarcated by and it occurs at
| (62) |
with G years, , and are plotted as functions of for and 30. in Fig. 10. Rocky and icy planets can exit in the range surrounded by these masses. These analytic approximation is consistent with the upper limits of shown in Fig. 9. In all panels of Fig. 9, the formation of both gas and ice giants is quenched beyond AU despite the availability of planetesimal building blocks. In panels a), b), and c), the gas-poor ice giants (represented by the blue crosses) do not extend above . Their growth is limited mostly by . After the gas depletion, the enhanced velocity dispersion makes the accretion rate very low. In outer regions beyond AU, this effect quenches ice giants’ further growth. If the asymptotic mass of the giant planets is limited by the viscous condition (panel d), gas accretion beyond 10 AU would be quenched when . Since their growth is speeded up by the gas accretion, they may be able to attain masses larger than over some intermediate range of (3-10 AU) through collisional coagulation after the gas depletion.
For modest values of such as that in the minimum mass nebula model (), . In this case, rocky, gas and ice giant planets naturally form in order of increasing distance from their host stars. This expectation is consistent with the distribution of the planets in the Solar System. Outside , the massive ice giants become the scattering agents which induce the residual planetesimals to be ejected to form cometary clouds and freely floating planets. This extrapolation is also consistent with the observed population of scattered Kuiper Belt objects (Duncan & Levison, 1997). Beyond , the growth time is the limiting factor for the emergence of any sizeable protoplanets. In order to account for the absence of modest-size Kuiper Belt objects beyond AU, a few is required.
4.3 Comparison with observational data
The present observational data (Figures 1) are obtained with some selection effects. For example, only planets with radial velocity amplitude ms-1 and semi major axes AU have been detected so far. The planets’ mass inferred from these observations represent a set of minimum values and their real magnitude is a function of the inclination angle of their orbital plane to the line of sight. Many planets are found with AU and . Although with the model in which the gas accretion is truncated by first isolation, we can construct such massive close-in planets (Figure 9a), but their emergence requires massive disks which may be prone to gravitational instability. The second and third models (Figure 9b,c) do not produce Jovian-mass planets interior to AU because the disks’ aspect ratio is relatively small. There are many possibility, within the framework of the core accretion scenario, to account for this discrepancy. Post-gap-opening accretion can lead to in situ formation of such planets. Orbital migration can also bring in the relatively massive planets formed in the outer regions of the disks’ aspect ratio is relatively large (see next section).
The present data show an apparent lack of planets with and AU (see Fig. 1). When corrected for the inclination of their orbits, the demarcation boundary may be shifted to higher masses, by a factor of two, from that indicated in Figure 1. If this hint of a planet-deficit domain is confirmed by the future observations, it would provide useful constraints on the truncation condition for gas accretion. At their face value, the present data are consistent with the simulated results with a combination of the isolation condition with and the thermal condition with . The viscous condition with limits planet masses to values much smaller than observed masses unless 1) an extremely large value of is taken (which can be ruled out by the persistent time scale of protostellar disks) or 2) accretion continues after gap formation.
Our numerical simulations also show an outer boundary for the planet-deficit domain at around 3 AU. This boundary reflects the changes in the dominant process which limits the formation of gas giants. At AU, the condition of is more important, because cores grow rapidly and reach their asymptotic mass prior to the era of gas depletion. But, at AU, the cores’ growth is so slow, that it is more important for to be satisfied. For most cores that can start gas accretion, is of oder of . Hence, many cores may not be able to initiate the process of gas accretion even though their mass can become larger than after gas depletion. As a result, planetary mass distribution at AU is likely to be continuous and does not show a clear deficit. Thus, the outer boundary of the planet-deficit domain indicates the critical semi major axis where core accretion timescales and disk gas depletion timescales are comparable.
5 Orbital migration
The existing data of known extra solar planets include a population of short-period planets with period down to 3 days. We consider the possibility of orbital migration in this section.
5.1 Model of orbital migration
There are several suggestions that, due to a torque imbalance, embedded protoplanetary cores can undergo rapid type I migration , e.g., (Goldreich & Tremaine, 1980; Ward, 1986). At 1 AU, the migration timescale for is only years (Ward, 1997; Tanaka et al., 2002; Bate et al., 2003). If type I migration is considered, all the protoplanetary cores have a tendency to rapidly migrate to the proximity of their host stars, prior to gas accretion. Thus, type I migration appears to be inconsistent with prolific formation of extra solar giant planets as well as the efficient preservation of Earth mass planets in the habitable zones around the Sun.
In contrast, type II migration naturally occurs when a planet acquires an adequate mass to open up a gap. Gap formation process itself requires the dissipation of tidally induced density waves. Turbulent viscosity is a possible mechanism to provide such a dissipation mechanism. It can also regulate the rate of gas accretion onto the classical T Tauri stars. Once a protoplanet has acquired an adequate mass to open up a gap, its orbital evolution is coupled with the viscous evolution of the disk (Lin & Papaloizou, 1985).
In the next set of models, we include the effect of type II migration for gas giants which have already attained their asymptotic masses. For computational convenience, we introduce a simple prescription to follow the orbital evolution of the gas giant planets. The direction of the migration can be both inward and outward. We arbitrarily set an stopping semi major axis for the inwardly migrating planets to be AU. There are several potential mechanisms for halting the migration near the stellar surface (Lin et al., 1996; Trilling et al., 1998), but none of these processes are effective beyond AU. The migration can be halted beyond AU by gas depletion (Trilling et al., 2002; Armitage et al., 2002; Matsuyama et al., 2003). However, both the planet formation and migration timescales at 0.2-3 AU is shorter than years. We consider below the necessary condition to build up gas giants and deplete the disk during the course of their migration so that they would be relocated to this intermediate location.
Here we consider only the type II migration in which orbital evolution of a planet embedded in a gap is coupled with the evolution of the disk (Lin et al., 1996; Trilling et al., 2002; Armitage et al., 2002). In a slowly evolving (quasi steady) disk, the angular momentum flux due to the viscous stress is approximately independent of the disk radius. For a simple approximation, we estimate the net angular momentum transfer rate, in the absence of any planets, at the radius of maximum viscous couple , e.g., (Lynden-Bell & Pringle, 1974),
| (63) |
where the subscript “m” denotes values of various quantities at .
Across the gap, the planets’ tidal torque regulates the angular momentum transport. When the disk interior to their orbits is accreted onto their host stars or that exterior to their orbits diffuses to much larger radii, the embedded planets maintain the angular momentum transport balance by adjusting their orbital radius (Lin & Papaloizou, 1985; Lin et al., 1996). This process leads to planetary migration on a rate,
| (64) |
where is Kepler frequency of the planet’s orbit at .
5.2 An -prescription for gas disk evolution
The value of depends on the distribution. For the minimum-mass disk model, we estimate it to be AU (Lin & Papaloizou, 1985). However, the observationally inferred size and mass of the disks have a large dispersion. A similar dispersion are expected in . During the viscous diffusion process, evolves outward if there is no infall to replenish the disk mass. In the absence of infall and outflow, declines in most part of the disk as mass is accreted onto the host stars. From the conservation of the total disk mass
| (66) |
we expect
| (67) |
If the disk depletion is mostly driven by photo evaporation or stellar wind ablation, the expansion rate of would be slower. However, as shown below, in the model with and (equivalently, ), planetary migration rate is independent of except for outer regions () where the direction of migration is outward. Hence, we only need an approximate prescription for the time evolution of in our simulation. Corresponding to eqs. (48) and (67), we set
| (68) |
In a quasi steady state, the radial velocity of the gas which is
| (69) |
in regions well inside . The scale is evaluated at . Note that cannot be faster than . Equivalently, cannot be smaller than
| (70) |
For small planets embedded in relatively massive disks, is limited by . Also, when decreases to 0.04AU, migration is halted as mentioned above.
Integrating with eqs. (65) and (68), we show examples of type II migration with our model in Figure 11, where time is scaled by at 1AU (). At AU, planets can migrate by a significant distance in the limit that . Since , the inner planets tend to migrate over a greater radial extent and the inward migration accelerates with time. In all figures, we indicate the evolution of with dashed lines. Planets exterior to migrated outward. Some planets which formed slightly outside the initial migrate outward first. But, as expands beyond their orbits, their migration reverses direction and they undergo orbital decay (Lin & Papaloizou, 1985). The migration of some planets are stalled at intermediate radii when the disk is depleted. Note that the number of planets which stalled with intermediate semi major axes or equivalently periods is a function of . The initial migration time scale at 1AU, , provides an arbitrary fiducial comparison between the disk depletion and planets’ migration time scales. In models with , delicate timing is needed for a few planets to stall their orbital evolution at a fraction of an AU. This result is similar to those found by Trilling et al. (2002) and Armitage et al. (2002). But, in models with relatively small , a significant fraction of the gas giant planets formed near 1 AU may attain asymptotic semi major axes between 0.04 to 1 AU.
In Figure 11, we highlight the critical migration paths of (1) those planets which marginally migrate from an initial semi major axis to 0.04AU and (2) those planets which attain an asymptotic semi major axis which are greater than 0.9 times that of their initial semi major axis . Since planets form with semi major axis between and attain asymptotic ’s between 0.04 AU and , relatively large values of would lead to a significant modification in the semi major axis distribution of the planets.
5.3 The modification of the semi major axis distribution by migration
We apply the above prescription for migration to the planetary growth model. We added the effects of migration to the Monte Carlo calculations in §4.2 (Figures 9 a, b, and c). We assume that type II migration starts when a planet’s mass reaches and a gap is opened up in the nascent disk near its orbit (models (a) and (b)). In the case that the gas truncation is induced by isolation, it is less clear when type II migration would be initiated. For simplicity, we assume that migration starts when planetary mass reaches which is larger than . For model (c), migration is initiated when becomes larger than such that there is a range for which gas accretion and migration occur concurrently. This migration condition is similar to . (As mentioned in the last section, the gas truncation by seems to be inconsistent with the observational data, but the migration condition by may be reasonable.)
In these calculations, years. The time dependent calculation of disk evolution (Lynden-Bell & Pringle, 1974) indicates that the disk mass declines on the viscous diffusion time scale near . If gas depletion in disks is due to their viscous evolution, we would expect to be comparable to (eq. [70]) near AU. In order to match the observed properties of protostellar disks around classical T Tauri stars, we adopt which corresponds to at 10AU.
The results of our simulations are shown in Figs. 12 for three series of models. In each case, the gas and core accretion are truncated by the conditions which correspond to those in Fig. 9, respectively. The results show that the spatial distribution of the gas-poor cores is not affected by the migration because it only affects those planets which are able to accrete gas and to open up gaps. But for gas giant planets, equation (65) indicates that the migration time scale increases with their masses and semi major axes. The less massive gas giants are formed preferentially with relatively small semi major axes and they migrate to AU in all the cases. This result is consistent with the observed mass distribution of the short-period planets which appears to be smaller than that of planets with periods longer than a few months (Udry et al., 2003).
Gas giant planets with migrate over extended radial distance provided the disk gas is preserved for a sufficiently long time for them to form. For example, the critical value of for the formation of gas giants is at AU where (see §4.1). From eq. (18), we find that in disks with larger than the critical value, the time scale for a core to acquire a mass is yrs which is much smaller than the mean disk depletion time scale years. If the subsequent gas accretion is limited by either or , the asymptotic mass of the gas giant would be (Figs. 9). For this range of and , we find, from eqs. (65) and (70), that the migration time scale is less than a few Myr provided . In most disks, AU so that the planets formed at AU have . Thus, within our model here, most gas giant planets formed within AU are removed by the orbital migration independent of the truncation condition for gas accretion.
Nevertheless, there is a population of gas giants which attain asymptotic semi major axis in the range of a fraction of an AU. In fact, the distribution of semi major axis is nearly continuous from AU. As we have indicated in the discussion of Figure 11, planets formed between and slightly outside the initial radius of maximum viscous stress () migrate outward first. They reverse their direction and migrate inward after has expanded beyond their orbit. (In all our calculations, we adopt AU initially so that AU and AU.) Their period distribution in the range of a few weeks to years is determined by the ratio of the disk depletion and viscous time scales. With our adopted value , the simulated distribution is similar to that observed.
Numerical simulations of disk-planet interaction suggest that there may be lingering gas accretion after the gap formation which may lead to to be somewhat but not substantially larger than . The post formation accretion may be particularly effective for the eccentric planets because their large epicyclic excursion can be extended beyond the boundaries of the gap. From eq. (65) we find that when reaches
| (71) |
If such an effect leads to the formation of any massive planets with , they would not be able to migrate significantly from their birth place.
5.4 Preservation of the planet-deficit domain
The results in Figures 12 show that the domain of the planet desert becomes more clearly defined with all three prescriptions for the truncation of gas accretion. In comparison with the planets’ initial properties (see Figs. 9), the effect of the orbital migration is to reduce and erase the differences introduced to the distribution by the different truncation conditions for gas accretion.
In this series of simulations, we only consider type II migration, which occurs only if a planet can open up a gap with a mass in excess of (0.3-1) []. The lower- boundary of the planet desert is not modified by the type II migration process because it is populated by cores which have not yet initiated the process of rapid gas accretion and may not migrate. As we have already shown that this boundary is primarily determined by the cores’ mass required for transition from the predominantly planetesimal to the mostly gas accretion, it is insensitive to the truncation condition for the cores and their asymptotic masses.
A direct comparison between Figures 9 and 12 clearly indicates that the planet migration process significantly alter the upper- boundary of the planet-deficit domain. Gas giants formed with AU (see Figs. 12) migrate to 0.04 AU. But some planets formed between and AU, attain asymptotic between AU. As the semi major axis of these marginally survivable gas giants spread out, they attain a nearly logarithmic period distribution similar to the observed period distribution. Outside , the gas giants form in the advanced stages of disk evolution when there is insufficient gas to induce any significant migration. Based on the results in Figures 12, we infer a substantial upturn in the semi major axis distribution of Jupiter-mass gas giants at around 10AU. The boundary of the upturn in the period distribution is determined by the ratio of gas depletion and the viscous evolution time scales of the disk.
During the migration, the gas giants are not expected to lose mass. Thus, the upper- boundary of the planet-deficit region is set by the lowest gas-accretion-truncation mass between and . Above this upper boundary, the spread in among the gas giants with any given is due to the dispersion in the gas-accretion-truncation condition induced by the mass range of the host stars and nascent disks.
In this series of simulations, the outer- boundary of the planet desert in the diagram occurs at AU for all three classes of models. The magnitude of the outer- boundary is determined by the location where cores can attain a sufficient mass to undergo efficient gas accretion prior to the depletion of the gas in the disk. Since this condition is associated with the evolution of the cores, the location of the outer- boundary does not depend on either the gas-accretion-truncation conditions or the migration process.
Beyond the outer- boundary, ice-giant planets, similar to Uranus and Neptune, can form with . In these region, the cores grow relatively slowly. Even though the asymptotic mass of the cores is relatively large, they are unable to acquire to initiate a phase of rapid gas accretion. The large asymptotic mass of these planets is acquired during the final phase of their assemblage after gas in the disk has been depleted. In the limit that some residual gas in the disk is preserved for an extended length of time, type II migration cannot relocate these planets because their mass is too small to open up a gap. Nevertheless, the mass spectrum at any beyond the outer boundary of the planet desert can evolve slightly with gas accretion and significantly via residual core accretion and giant impacts. The time scale of growth through giant impacts is similar to that for the oligarchic cores and is an increasing function of the planets’ mass. This further coagulation process leads to a continuous mass spectrum. The range of ice giants’ masses in the region just beyond the outer- boundary is determined by the dispersion in the heavy element content, i.e. , out there.
The center of the planet-deficit domain is not entirely void of planets with intermediate and ’s. Within the present theoretical framework of our models, only type II migration can modify the planets’ semi major axis. But the necessary condition for type II migration is for gas giant to reach their gas-accretion-truncation mass which is an increasing function of . Gas giants with less than the local can be formed interior to any disk location. However, planets formed interior to the radius of maximum viscous stress in the disk must always migrate inward. Since is generally comparable to or larger than , planets with intermediate and cannot migrate into the planet-desert domains from smaller or larger ’s. In our simulation, a few planets located in the planet-deficit, intermediate and region can be formed in marginally massive disks where the and (see eqs. [55] and [47]). In this estimate, we assume that since these planets do not have adequate mass to open a gap, they eventually acquire all the nearby residual disk gas.
5.5 The spatial extent of planetary systems
In the scenario we presented here, we artificially halt the migration at 0.04 AU to represent the effect of tidal and magnetospheric interaction between short-period planets and their host stars. Besides these processes, MHD turbulence in the disk may also play a role in halting their migration (Terquem, 2003). Since most of the short-period planets were formed with , they generally form with less mass than the planets which accreted gas later, at larger disk radii, and retained a greater fraction of their original semi major axis. Most gas giant planets formed interior to migrate to AU. Since gas giants can readily form well within (see Figs. 9), a large accumulation of short-period planets is expected. Although there is a spike in the observed period distribution just outside 0.03AU, the amplitude of this enhancement is modest. Near the surface of the host stars, the combined effects of tidal, magnetospheric, and radiative effects of the host stars as well as the secular perturbation of more distant planets, disks, and stars may lead to the destruction of the short-period planets and the disruptions of their orbits.
For the outer boundary of planetary systems, we find that there are several very massive planets which managed to migrate to AU in panels a), b), and c) of Figure 12. These planets were formed at 10-30 AU, just outside in massive disks we have simulated. With their large values of -30AU and -30, the gravitational stability parameter (eq. [56]) at formation locations of these planets are found to be 0.7-1.2, which may be (marginally) gravitationally unstable. Hence, the outward migrating massive gas giants may actually be more rare.
For disks with modest masses, ice giants can accrete gas to form sizable gaseous envelopes (represented by open blue circles) well beyond the ice boundary. Although we assume that the ice giants do not migrate because they do not have a sufficient mass to open a clean gap. Nevertheless, the weak tidal interaction may be adequate to induce the ice giants to migrate primarily outward over a limited extent. In the Solar System, the migration of Neptune over several AU’s on a time scale of Myr may have led to the capture of Kuiper Belt objects on its 3:2 (but not on its 2:1) mean motion resonances (Ida et al., 2000).
In the current analysis, we do not consider the interaction between multiple planets which can lead to dynamical instabilities (Chambers et al., 1996; Lin & Ida, 1997; Marzari & Weidenschilling, 2002). Although sizeable planets may be ejected to large distances from their host stars, such an instability is likely to induce the orbits of the residual planets to become highly eccentric and dynamically segregated with large () period ratios, e.g., (Weidenschilling & Marzari, 1996; Lin & Ida, 1997). The search for the orderly-packed ice giants with nearly circular orbits may provide useful constraints to differentiate the core accretion and gravitational instability scenarios for planet formation.
6 Summary and Discussions
We have investigated the mass and semi major distributions of extra solar planets through theoretical models based on the core accretion model for formation of gas giants. Core accretion from planetesimals is modeled by the results of N-body simulations. Gas accretion onto the cores is modeled with Kelvin-Helmholtz contraction of gas envelope. Since the termination of gas accretion onto cores have some uncertainty, we considered various models for the asymptotic mass of the gas giants. In some calculations, we also include the effects of type II migration.
In general, the formation of gas giants is favored just outside the ice boundary at AU. Inside the ice boundary, because the volatile gases cannot condense into grains, the mass of solid cores tend to be smaller than which is necessary for the onset of rapid gas accretion onto them. On the other hand, in outer regions (AU), core accretion is so slow that cores cannot attain before the disk gas is depleted on the time scale of years. In very massive disks, however, cores become massive enough for the onset of rapid gas accretion even inside the ice boundary within the disk life time to attain gas mass . Since planets grow very rapidly from to , planets of the intermediate masses are rare at AU (“planet desert”). If the effect of type II migration is included, the deficit becomes more clear and tends to become independent of the model of termination of gas accretion. It also results in accumulation of planets at AU. As a result, the deficit becomes and AU.
The current radial velocity survey of nearby stars is limited by the availability of accurate radial velocity measurements (down to the level of ms-1) over the past few years. Planets with masses comparable to that of Jupiter and -5AU are inferred from these observations. The processed data show a hint of the planet desert (Figure 1). Further observations in the regime of longer periods (larger ) and smaller will clarify the existence of a planet desert (a deficit of planets with intermediate mass and semi major axis planets).
Gas giants could also be formed by self-gravitational collapse of a disk, e.g., (Boss, 2001). If extra solar planets are formed from the self-gravitational collapse, the mass and semi major axis distributions of extra solar planets should show very different features from those we show here based on the core accretion model for gas giants. As we showed in §4 and 5, with the core accretion model, gas giants may be limited to the regions AU, except for planets on eccentric orbits that are scattered from inner regions by dynamical instabilities in multiple gas giant systems (which we do not consider in this paper). On the other hand, in the self-gravitational collapse model, gas giants are preferentially formed far from their host stars (see eq. [56]), although the mass distribution of gas giants is not clear. The search for gas giants on nearly circular orbits beyond 20-30AU may provide useful constraints to differentiate the core accretion and gravitational instability models for formation of gas giants.
If the the presence of a planet desert is confirmed by future observations, the boundaries of the planet-deficit domain in the mass and semi major axis plane should provide the following constraints on the planetary formation processes (see also Fig. 13):
-
•
The lower mass boundary () indicates the core mass that can initiate the onset of rapid gas accretion. Our theoretical model predicts that and it does not depend on . (If we include the coalescence between cores after gas depletion, slightly increases with .)
-
•
The value of upper mass boundary () and its dependence on provide clues on the truncation mechanism of gas accretion. For various models we find (1) (and independent of ) if the gas giants’ growth is limited by an isolation process, (2) if a complete gap is formed through the viscous condition, or (3) if it is due to the thermal condition. However, if the effect of type II migration is included, the results in models (1) and (3) lead to similar distribution. Then the magnitude of constrains the migration timescales and disk depletion timescales.
-
•
The smaller boundary () indicates the maximum radius at which type II migration can be halted.
-
•
The larger boundary () traces out the radius where a dominant condition for formation of gas giants changes between condition and condition. At , the former is more important than the latter, and vice versa. Our theoretical model predicts that AU.
The results presented here show that the sequences of rocky (terrestrial), gas giant and ice giant planets are clearly segregated in the diagram. The importance of this diagram to planet formation is similar to that of the color-magnitude diagram for stellar evolution. Comparison of future observations and more refined theoretical models will reveal the formation processes of extra solar planets. In the near future our inability to directly detect the presence of terrestrial planets limits the comparison to only the giant planet population. In follow-up papers, we will consider a wider variety of models and identify some robust constraints. Our eventual objective is extrapolate the ubiquity of rocky planets and formulate a predictable theory of planet formation from the statical properties of the giant planets.
References
- Aarseth et al. (1993) Aarseth, S. J., Lin, D. N. C., Palmer, P. L. 1993, ApJ, 403,351
- Armitage et al. (2002) Armitage, P. J., Livio, M., Lubow, S. H., & Pringle, J. E. 2002, MNRAS, 334, 248
- Adachi et al. (1976) Adachi, I., Nakazawa, K., & Hayashi, C. 1976, PASJ, 29, 163
- Artymowicz (1993) Artymowicz, P. 1993, ApJ, 419, 166
- Artymowicz & Lubow (1996) Artymowicz, P. & Lubow, S. H. 1996, ApJ, 467, L77
- Bate et al. (2003) Bate, M. R., Lubow, S. H., Ogilvie, G. I., & Miller, K. A. 2003, MNRAS, 341, 213
- Beckwith & Sargent (1996) Beckwith, S. V. W., & Sargent, A. I., 1996, Nature, 383, 139
- Balmforth & Korycansky (2001) Balmforth, N. J. & Korycansky, D. G. 2001, MNRAS, 326, 833
- Bodenheimer & Pollack (1986) Bodenheimer, P., & Pollack, J. B. 1986, Icarus, 67, 391
- Bondi (1952) Bondi, H. 1952, MNRAS, 112, 195
- Boss (2001) Boss, A. P. 2001, ApJ, 551, L167
- Bryden et al. (1999) Bryden, G., Xingming, C., Lin, D. N. C., Nelson, R., & Papaloizou, J. C. B. 1999, ApJ, 514, 344
- Bryden et al. (2000a) Bryden, G., Rzyczka, M., Lin, D. N. C., & Bodenheimer, P. 2000, ApJ, 540, 1091
- Bryden et al. (2000b) Bryden, G., Lin, D. N. C., & Ida, S. 2000, ApJ, 544, 481
- Cameron & Ward (1976) Cameron, A. G. W. & Ward, W. R. 1976, Proc. Lunar Planet Sci. Conf. 7, 120
- Calvet et al. (2000) Calvet, N., Hartmann, L. & Strom, S. E. in Protostars and Planets IV, ed. V. Mannings, A. P. Boss and S. S. Russell (Tucson:Univ. of Arizona Press), 377
- Chambers et al. (1996) Chambers, J. E., Wetherill, G. W., Boss, A. P. 1996, Icarus, 119, 261
- D’Alessio et al. (2001) D’Alessio, P, Calvet, N., Hartmann, L. 2001, ApJ, 553, 321
- Duncan & Levison (1997) Duncan, M. J. & Levison, H. F. 1997, Science, 276, 1670
- Duvert et al. (2000) Duvert, G., Guilloteau, S., Mnard, F., Simon, M. & Dutrey, A. 2000, A&A, 355, 16
- Goldreich & Tremaine (1980) Goldreich, P., & Tremaine, S. 1980, ApJ, 241, 425
- Gonzalez (1997) Gonzalez, G. 1997, MNRAS, 285, 403
- Greenberg et al. (1978) Greenberg, R., Hartmann, W. K., Chapman, C. R., & Wacker, J. F. 1978, Icarus 35, 1
- Gu et al. (2003) Gu, P., Lin, D. N. C., & Bodenheimer, P. H. 2003, ApJ, 588, 509
- Haisch et al. (2001) Haisch, K. E., Lada, E. A. & Lada, C. J. 2001, ApJ, 553, L153
- Hartmann & Davis (1975) Hartmann, W. K. & Davis, D. R. 1975, Icarus, 24, 504
- Hartmann et al. (1998) Hartmann, L., Calvet, N., Gullbring, E., & D’Alessio, P. 1998, ApJ, 495, 385
- Hayashi (1981) Hayashi, C. 1981, Prog. Theor. Phys. Suppl., 70, 35
- Hayashi et al. (1985) Hayashi, C., Nakazawa, K. & Nakagawa, Y. 1985, Protostars and Planets II, ed. D. C. Black & M. S.Matthew (Tuscon: Univ. of Arizona Press), 1100
- Ida & Makino (1993) Ida, S., & Makino, J. 1993, Icarus, 106, 210
- Ida et al. (2000) Ida, S., Bryden, G., Lin, D. N. C., & Tanaka, H. 2000, ApJ, 534, 428
- Ikoma et al. (2000) Ikoma, M., Nakazawa, K. & Emori, E. 2000, ApJ, 537, 1013
- Iwasaki et al. (2002) Iwasaki, K., Emori, H., Nakazawa, K. & Tanaka, H. 2002, PASJ, 54, 471
- Jorissen et al. (2001) Jorissen, A., Mayor, M. & Udry, S. 2001, å, 379, 992
- Kokubo & Ida (1995) Kokubo, E. & Ida, S. 1995, Icarus, 114, 247
- Kokubo & Ida (1996) ———. 1996, Icarus, 123, 180
- Kokubo & Ida (1998) ———. 1998, Icarus, 131, 171
- Kokubo & Ida (2000) ———. 2000, Icarus, 143, 15
- Kokubo & Ida (2002) ———. 2002, ApJ, 581, 666
- Kominami & Ida (2002) Kominami, J. & Ida, S. 2002, Icarus, 157, 43
- Lin et al. (1996) Lin, D. N. C., Bodenheimer, P. & Richardson, D. 1996, Nature, 380, 606
- Lin & Ida (1997) Lin, D. N. C. & Ida, S. 1997, ApJ
- Lin & Papaloizou (1985) Lin, D. N. C. & Papaloizou, J. C. B. 1985, Protostars and Planets II, ed. D. C. Black & M. S.Matthew (Tuscon: Univ. of Arizona Press), 981
- Lin & Papaloizou (1993) Lin, D. N. C., & Papaloizou, J. C. B. 1993, in Protostars and Planets III, ed. E. H. Levy and J. I. Lunine (Tucson:Univ. of Arizona Press), 749
- Lin & Pringle (1990) Lin, D. N. C. & Pringle, J. E. 1990, ApJ, 358, 515
- Lissauer (1987) Lissauer, J. J. 1987, Icarus, 69, 249
- Lissauer & Stewart (1993) Lissauer, J. J. & Stewart, G. R. 1993
- Lynden-Bell & Pringle (1974) Lynden-Bell, D. & Pringle, J. E. 1974, MNRAS, 168, 603
- Marcy et al. (2000) Marcy, G. W., Cochran, W .D., & Mayor, M. in Protostars and Planets IV, ed. V. Mannings, A. P. Boss and S. S. Russell (Tucson:Univ. of Arizona Press), 1285
- Marzari & Weidenschilling (2002) Marzari, F. & Weidenschilling, S. 2002, Icarus, 156, 570
- Matsuyama et al. (2003) Matsuyama, I., Johnstone, D. & Murray, N. 2003, ApJ, 585, L143
- Mizuno (1980) Mizuno, H. 1980, Prog. Theor. Phys. Suppl., 64, 54
- Murray & Chaboyer (2002) Murray, N. & Chaboyer, B. 2001, ApJ, 566, 442
- Murray et al. (1998) Murray, N., Hansen, B., Holman, M., & Tremaine, S. 1998, Science, 279, 69
- Nakamoto & Nakagawa (1994) Nakamoto, T. & Nakagawa, Y. 1994, ApJ, 421, 640
- Papaloizou & Lin (1995) Papaloizou, J. C. B. & Lin, D. N. C. 1995, ARA&A, 33, 505
- Patzold & Rauer (2002) Patzold, M. & Rauer, H. 2002, ApJ, 568, L117
- Podolak (2003) Podolak, M. 2003, Icarus, 165, 428
- Pollack et al. (1996) Pollack, J. B., Hubickyj, O., Bodenheimer, P., Lissauer, J. J., Podolak, M., & Greenzweig, Y. 1996, Icarus, 124, 62
- Rafikov (2003) Rafikov, R. R. 2003, AJ, 125, 922
- Safronov (1969) Safronov, V. 1969, Evolution of thr Protoplanetary Cloud and Formation of the Earth and Planets (Moscow: Nauka Press)
- Santos et al. (2001) Santos, N. C., Israelian, G. & Mayor, M. 2001, A&A, 373, 1019
- Shakura & Sunyaev (1973) Shakura, N. I. & Sunyaev, R. A. 1973, A&A, 24, 337
- Shang et al. (2000) Shang, H., Shu, F., Lee, T. & Glassgold, A. 2000, Space Sci. Rev., 92, 15
- Shu et al. (1993) Shu, F. H., Johnstone, D. & Hollenbach, D. Icarus, 106, 92
- Stevenson (1982) Stevenson, D. J. 1982, P&SS, 30, 755
- Tabachnik & Tremaine (2002) Tabachnik, S. & Tremaine, S. 2002, MNRAS, 335, 151
- Tanaka et al. (2002) Tanaka, H., Takeuchi, T., & Ward, W. R. 2002, ApJ, 565, 1257
- Tanigawa & Watanabe (2000) Tanigawa, T. & Watanabe, S. 2000, ApJ, 580, 506
- Terquem (2003) Terquem, C. 2003, MNRAS, 341, 1157
- Thi et al. (2001) Thi, W. F., Blake, G. A., van Dishoeck, E. F., van Zadelhoff, G. J., Horn, J. M. M., Becklin, E. E., Mannings, V., Sargent, A. I., van den Ancker, M. E.; Natta, A. 2001, Nature, 409, 60
- Thommes et al. (2002) Thommes, E. W., Duncan, M. J. & Levison, H. F. 2002, Icarus, 161, 431
- Thommes et al. (2003) Thommes, E. W., Duncan, M. J. & Levison, H. F. 2003,
- Toomre (1964) Toomre, A. ApJ, 139, 1217
- Trilling et al. (1998) Trilling, D. E., Benz, W., Guillot, T., Lunine, J. I., Hubbard, W. B. & Burrows, A. 1998, ApJ, 500, 428
- Trilling et al. (2002) Trilling, D. E., Lunine, J. I. & Benz, W. 2002, å, 394, 241
- Udry et al. (2003) Udry, S., Mayor, M., & Santos, N. C. 2003, å, 407, 369
- Ward (1986) Ward, W. 1986, Icarus, 67, 164
- Ward (1993) Ward, W. 1993, Icarus, 106, 274
- Ward (1997) Ward, W. 1997, Icarus, 126, 261
- Weidenschilling & Marzari (1996) Weidenschilling, S. & Marzari, F. 1996, Nature, 384, 619
- Wetherill (1980) Wetherill, G. W. 1980, ARAA, 77, 330
- Wetherill & Stewart (1989) Wetherill, G. W. & Stewart, G. R. 1989, Icaurs, 77, 330
- Wuchterl et al. (2000) Wuchterl, G., Guillot, T. & Lissauer, J. J. 2000, Protostars and Planets II, ed. V. Mannings, A. P. Boss & S. S. Russell (Tuscon: Univ. of Arizona Press), 1081
- Wyatt et al. (2003) Wyatt, M. C. et al. 2003, MNRAS, in press
- Zucker & Mazeh (2002) Zucker, S. & Mazeh, T. 2002, ApJ, 568, L112


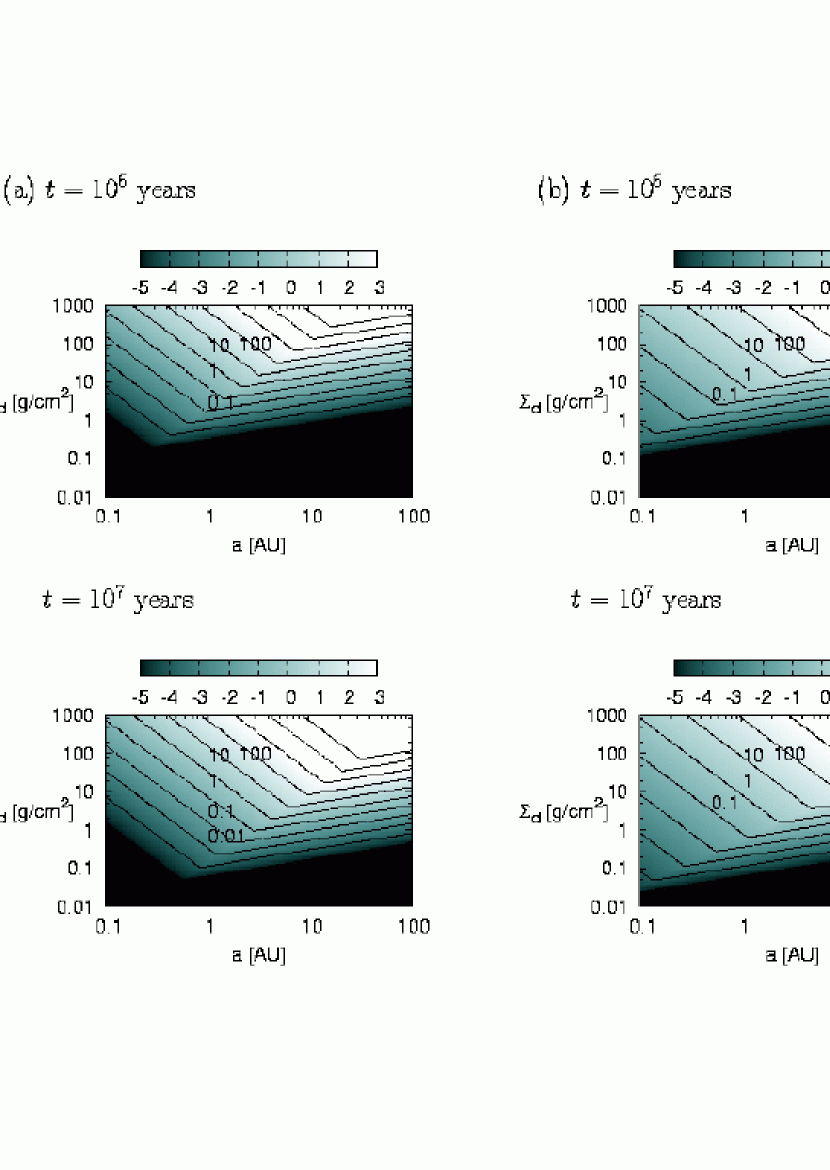

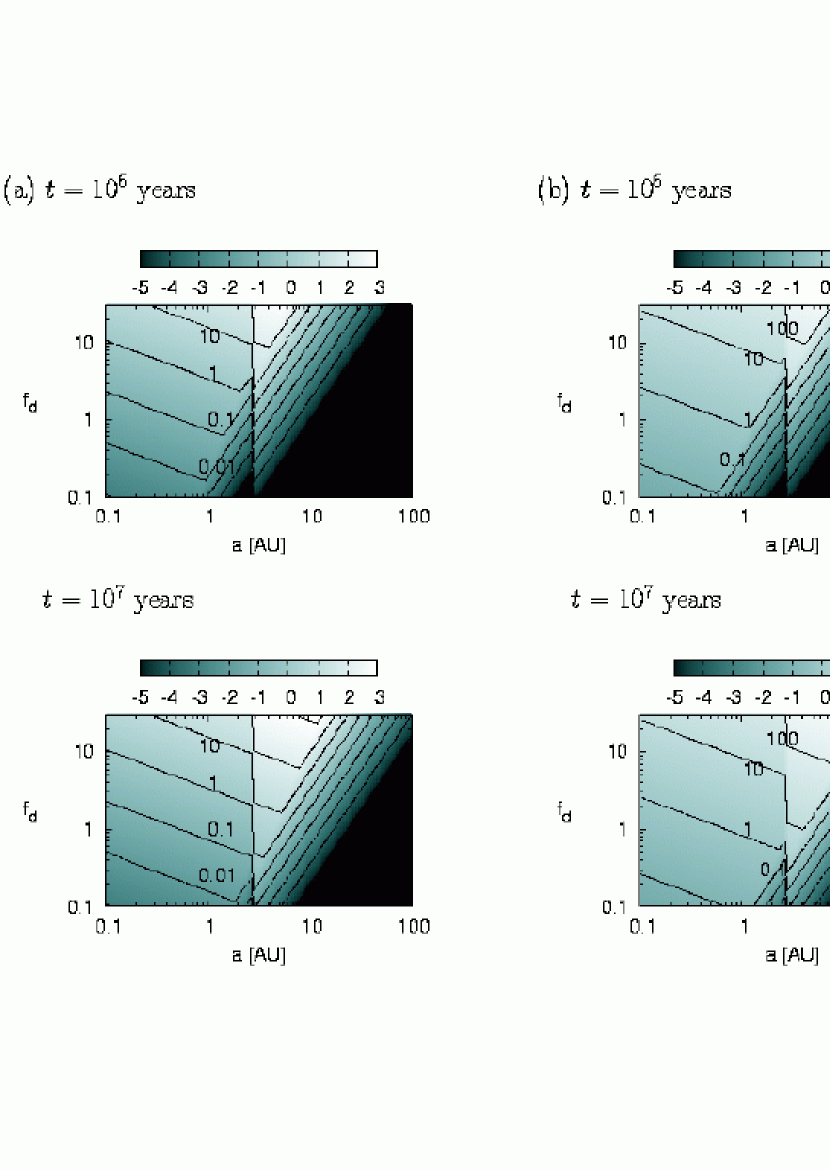
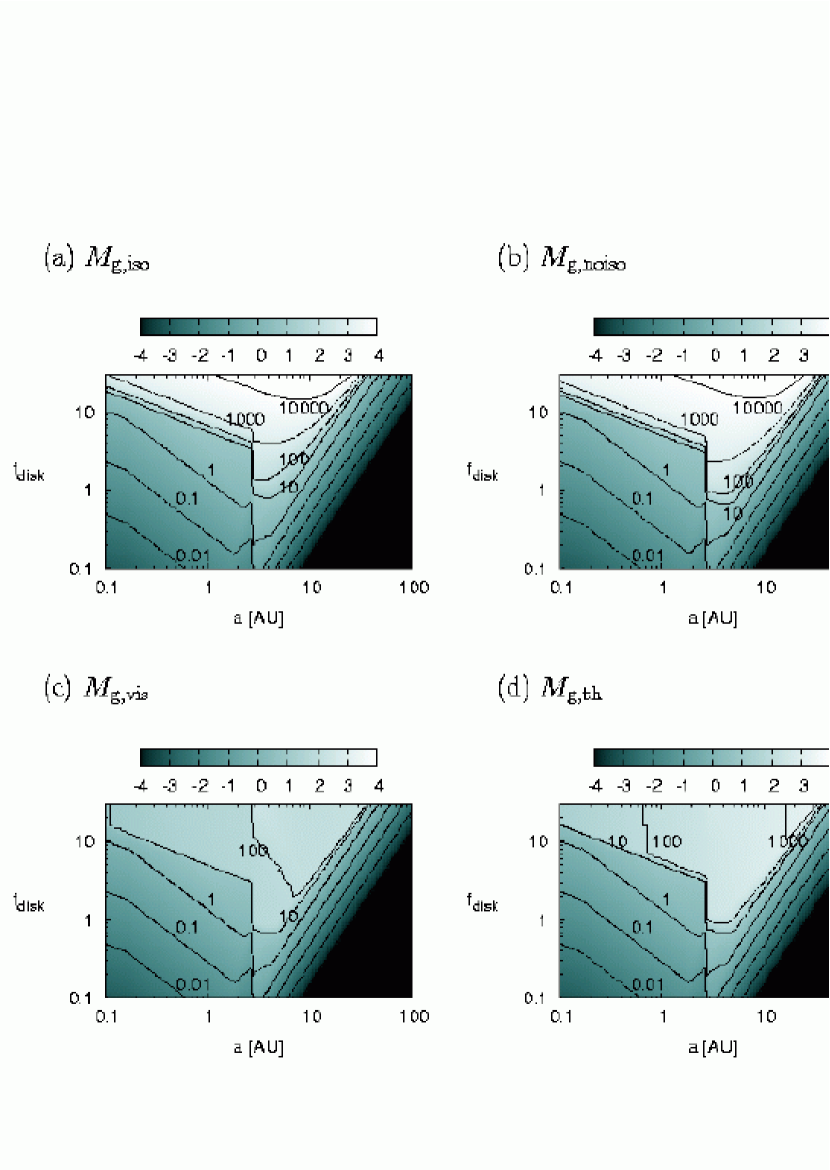
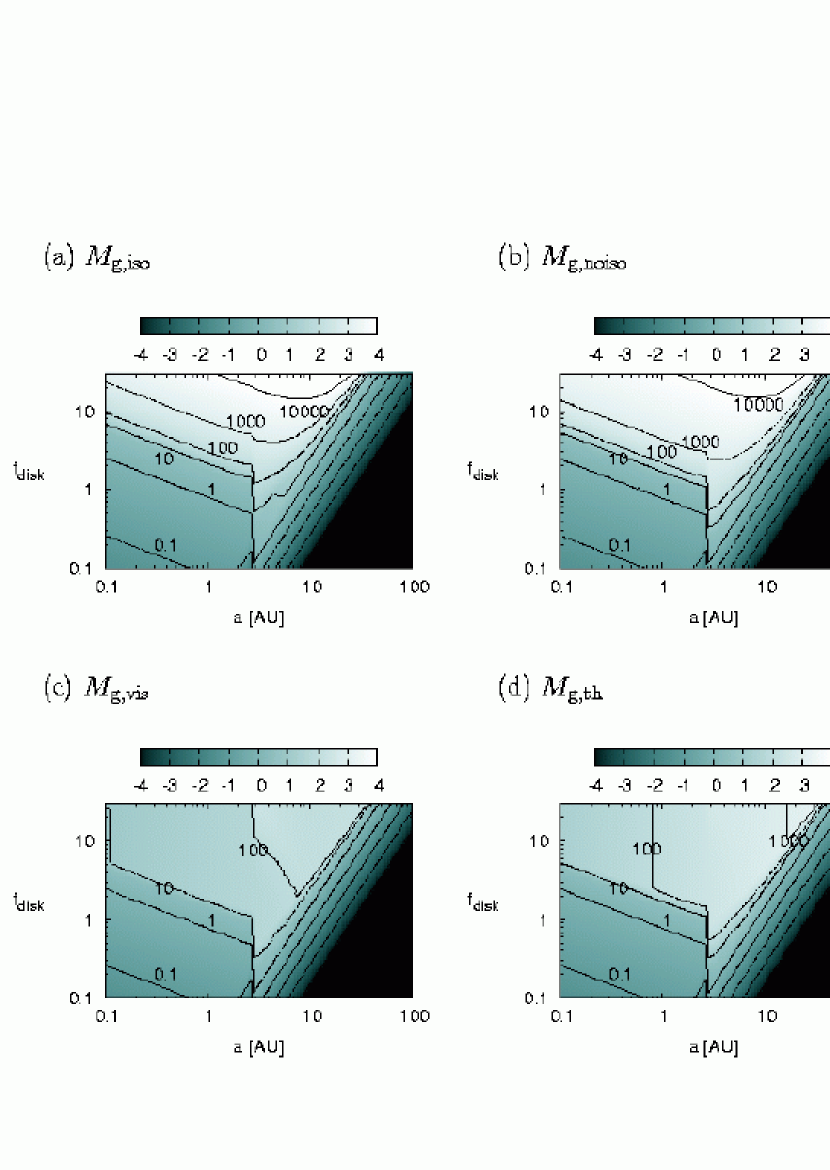

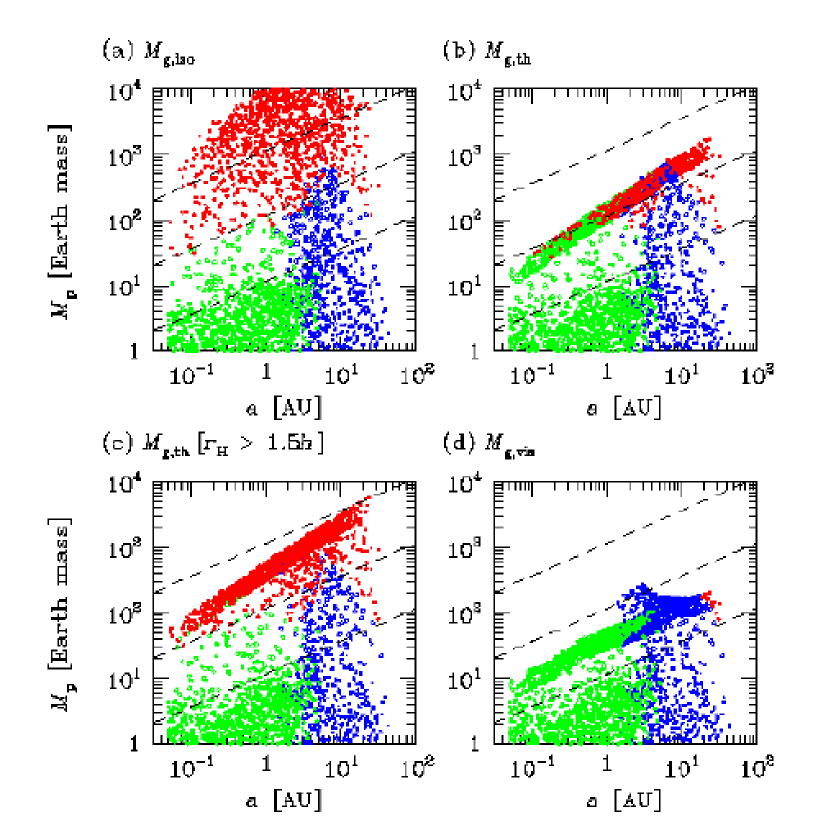


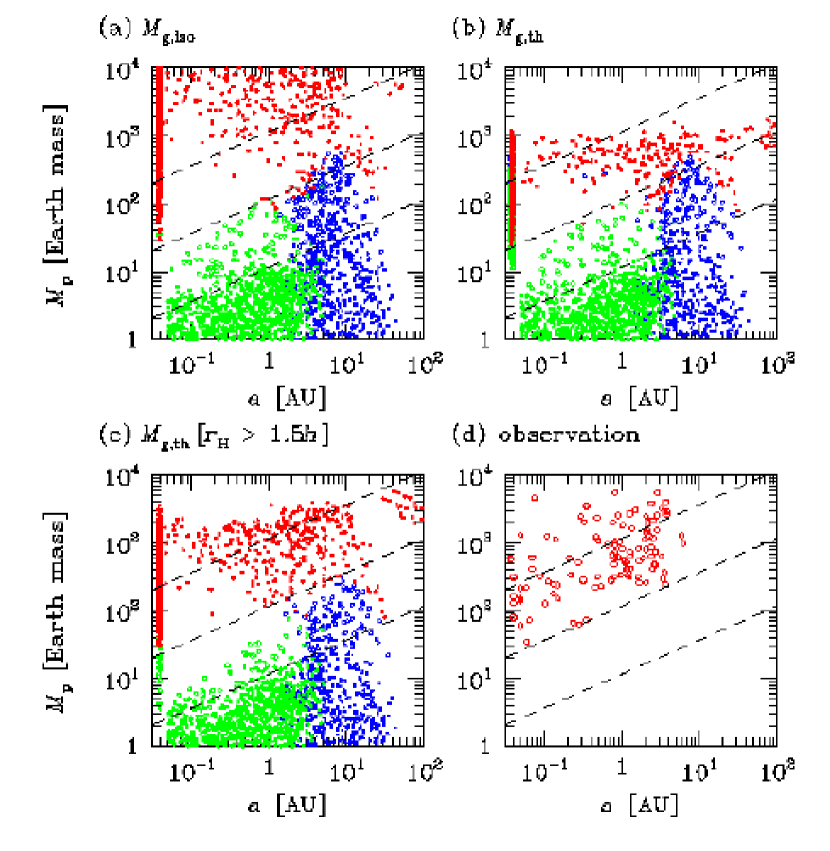

| variables | meaning | definition |
|---|---|---|
| a core mass | ||
| an embryo mass | see §2.4 | |
| a core isolation mass | eq. (20) | |
| a maximum mass of a core | eq. (22) | |
| an embryo isolation mass | eq. (25) | |
| an embryo mass limited by scattering | eq. (27) | |
| an embryo mass at (e,g., 1G years) | eq. (60) | |
| a critical core mass for initiating gas accretion onto the core | eq. (33) | |
| a core mass for K-H contraction time being | eq. (31) | |
| a planet mass including core and envelope | ||
| a gas giant isolation mass | eq. (35) | |
| a maximum mass of a gas giant | eq. (47) | |
| a gas giant truncation mass by thermal condition | eq. (38) | |
| a gas giant truncation mass by viscous condition | eq. (37) | |
| a supplied gas mass into a feeding zone by viscous diffusion | eq. (46) | |
| a core accretion time scale before gas depletion | eq. (6) | |
| an embryo accretion time scale after gas depletion | eq. (9) | |
| a depletion time scale of disk gas | eq. (48) | |
| a Kelvin-Helmholtz contraction time scale of gas envelope | eq. (34) | |
| a migration time scale of a giant planet | eq. (65) | |
| dust surface density of a disk | ||
| gas surface density of a disk | ||
| initial gas surface density of a disk | eq. (48) | |
| an enhancement factor of due to ice condensation | eq. (11) | |
| an enhancement factor of from a nominal disk | eq. (11) | |
| an enhancement factor of from a nominal disk | eq. (12) | |
| an initial enhancement factor of from a nominal disk | eq. (49) | |
| in this paper | ||
| a value of to segregate terrestrial/gas-giant planets regions | eq. (50) or (51) | |
| that to segregate gas/ice giants regions | eq. (52) | |
| ice boundary (a semi major axis of ice condensation) | eq. (15) | |
| a semi major axis to segregate terrestrialgas-giant planets regions | eq. (53) | |
| that to segregate gasice giants regions | eq. (54) |