Molecular Gas in the Lensed Lyman Break Galaxy cB5811affiliation: Based on observations carried out with the IRAM Plateau de Bure Interferometer. IRAM is supported by the INSU/CNRS (France), the MPG (Germany), and the IGN (Spain).
Abstract
We have used the IRAM Plateau de Bure Interferometer to map CO(3–2) emission from the gravitationally lensed Lyman break galaxy MS 1512–cB58. This is the first detection of a molecular emission line in any Lyman break system; its integrated intensity implies a total molecular gas mass of , while its width implies a dynamical mass of (for a flat cosmology). These estimates are in excellent concordance with nearly all parameters of the system measured at other wavelengths, and yield a consistent picture of past and future star formation with no obvious discrepancies requiring explanation by differential lensing. In particular, we find that the age and remaining lifetime of the current episode of star formation are likely to be similar; the surface densities of star formation and molecular gas mass are related by a Schmidt law; and the fraction of baryonic mass already converted into stars is sufficient to account for the observed enrichment of the interstellar medium to . Barring substantial gas inflow or a major merger, the stars forming in the current episode will have mass and coevality at similar to those of a spiral bulge. Assuming cB58 is a typical Lyman break galaxy apart from its magnification, its global parameters suggest that the prescriptions for star formation used in some semi–analytic models of galaxy evolution require moderate revision, although the general prediction that gas mass fraction should increase with redshift is validated. The length of cB58’s star formation episode relative to the time elapsed over the redshift range strongly argues against scenarios in which observed LBGs cohabit their halos with a large number of similar but “dormant” systems whose starbursts have faded or not yet begun. As a useful empirical result, we find that the observed line/continuum ratio for cB58 is similar to those of high–redshift systems with quite different dust luminosities and nuclear activity levels. Finally, we report the detection of a second source close to the position of the cD elliptical in the lensing cluster, which may be nonthermal continuum emission from the cD or CO line emission from a hitherto unknown background galaxy at or .
1 Introduction
The Lyman break technique (Steidel & Hamilton, 1992) has proved to be extremely efficient in identifying large numbers of actively star–forming galaxies at (Steidel et al., 1999, 2003). While its selection criteria require only that Lyman break galaxies (LBGs) have rest–UV colors comparable to those of UV–bright starbursts at (e.g., Meurer, Heckman, & Calzetti 1999), the method has proved to identify high–redshift systems that resemble these local counterparts in other respects as well. The two populations have similar bolometric surface brightnesses (Meurer et al., 1997), UV–through–optical spectral energy distributions (Ellingson et al., 1996; Sawicki & Yee, 1998), and blueshifted interstellar absorption from outflowing gas (Pettini et al., 1998, 2001). The primary difference is that LBGs appear to be forming stars at rates which are larger in proportion to their larger physical sizes (Meurer et al., 1997). Even the most careful studies of LBGs at relatively short wavelengths, however, provide only a partial picture of their important physical parameters. Although population synthesis models (Sawicki & Yee 1998; Papovich, Dickinson, & Ferguson 2001; Shapley et al. 2001) can reconstruct their past star formation histories, and rest–UV fluxes can be used to derive their present star formation rates (Madau et al., 1996; Steidel et al., 1999) modulo uncertain corrections for extinction (Ouchi et al. 1999; Peacock et al. 2000; Adelberger & Steidel 2000; Chapman et al. 2000; Seibert, Heckman, & Meurer 2002; Nandra et al. 2002; Webb et al. 2003), ignorance of their molecular gas contents makes it impossible to predict LBGs’ future courses of star formation. Moreover, estimates of LBGs’ total dynamical masses remain uncertain insofar as they are based solely on observations of nebular emission lines: ionized gas is more likely than molecular gas to reflect non–gravitational influences (Heckman et al., 1998), and less likely to trace the full rotation curve in local starbursts (Lehnert & Heckman, 1996). The detection of molecular gas in one or more LBGs is therefore of great interest in complementing the extensive work in the rest UV and optical.
Within the LBG population, the brightest observable object is the gravitationally lensed system MS 1512–cB58 (hereafter cB58: Yee et al. 1996). Thanks to magnification of a background source into a fold arc by the cluster MS 1512+36, this galaxy has permitted detailed studies in the rest–frame UV (Ellingson et al., 1996; Pettini et al., 2000, 2002) and optical (Bechtold et al., 1997; Teplitz et al., 2000), as well as detections in the rest–frame near (Bechtold et al., 1998) and far infrared (Baker et al. 2001; van der Werf et al. 2001; cf. Sawicki 2000). Two initial searches for CO(3–2) emission from cB58 were unsuccessful (Frayer et al., 1997; Nakanishi et al., 1997); notwithstanding cB58’s sub–solar metallicity, these raised the question of how stars could be forming at such a seemingly high rate out of such a seemingly small reservoir of molecular gas. Our measurement of a surprisingly low flux density (: Baker et al. 2001), implying a lower UV extinction and total star formation rate than those assumed by Frayer et al. (1997), suggested that molecular line emission might also be weaker than previously expected. The measurement by Teplitz et al. (2000) of nebular emission at a redshift apparently outside the bandpass of the Nakanishi et al. (1997) observations strengthened our conviction that a new and more sensitive search for molecular gas in cB58 was warranted.
In this paper, we report our successful detection of CO(3–2) emission from cB58– in fact, the first detection of molecular line emission from any LBG. §2 describes our acquisition and reduction of the data. §3 discusses our measurement of the CO(3–2) line parameters for cB58 and our derivations of molecular gas and dynamical masses. §4 presents our detection of an additional source “X” in the field, close to the position of the cD elliptical in the lensing cluster. We consider the likeliest origin of this emission to be nonthermal continuum emission from the cD or CO line emission from a background galaxy, although neither explanation is entirely satisfactory. §5 lays out a coherent picture of the past, present, and future of star formation in cB58, discusses the implications for our understanding of the Lyman break population as a whole, and assesses source–to–source variation in the millimeter line/continuum ratio at high redshift. §6 summarizes our conclusions. Throughout this paper, we will assume and a flat cosmology.111For cB58 at , this cosmology gives and . For the lensing cluster at , and . The correction of observed fluxes for lensing magnification generally makes use of the most satisfactory model MVIa of Seitz et al. (1998 = S98). In this interpretation, all of the background rest–UV source is magnified by a factor 2.39 into a counterimage (A2), while a lesser fraction () of the background source is magnified by a larger factor () into the cB58 fold arc, giving an arc/intrinsic brightness ratio of .
2 Observations
We observed cB58 with the IRAM Plateau de Bure Interferometer (PdBI: Guilloteau et al. 1992) for 18 intervals from April 2001 through August 2002. The array included between four and six 15 m diameter antennas; during our observations, these were arranged in the compact D configuration whose 15 baselines range from 24 to 82 m in length. Each antenna is equipped with both 3 mm and 1 mm SIS receivers that can be used simultaneously; these were tuned in single–sideband mode at 3 mm for 11 of the 18 observing epochs (encompassing of the data), and in double–sideband mode for the remaining 3 mm and all 1 mm data. Receiver temperatures were 60–80 K, and corrected outside the atmosphere yielded typical system temperatures of and at 3 mm and 1 mm, respectively. For our observations of cB58, we adopted a phase center ( and ) east of the coordinates listed in NED (Abraham et al., 1998). For the reported by Teplitz et al. (2000), the CO(3–2) and CO(7–6) rotational transitions are redshifted to 92.73 GHz and 216.32 GHz. We deployed four correlator modules– giving a total of 580 MHz of continuous bandwidth at resolution– across each of the two lines; both were observed in the lower sideband relative to the reference frequency. After reducing the 2001 subset of the data, we shifted the 3 mm receiver tuning to 92.83 GHz, in order to obtain more symmetric coverage of the already apparent CO(3–2) line at (see §3.1). As a result, only the central of 3 mm bandwidth containing data from all 18 observing epochs has been used to produce the line and continuum maps discussed below.
We calibrated the data using the CLIC routines in the IRAM GILDAS package (Guilloteau & Lucas, 2000). Phase and amplitude variations within each track were calibrated out by interleaving observations of 3C345 (at a separation from cB58 on the sky) every 30 minutes; we also observed the weaker but closer () quasar 1504+377 to permit a check of our astrometric uncertainty (see §3.1 below). Passband calibration used 3C345 or another bright quasar. The overall flux scale for each epoch was set by comparing 3C345 with 3C273 and/or with model sources CRL618 and MWC349. Reference fluxes for 3C273 were extracted from an archive of dedicated monitoring data from the PdBI and the IRAM 30 m telescope. We estimate the accuracy of our final flux scales to be .
Before constructing tables from our calibrated data, we smoothed them to a frequency resolution of 5 MHz (i.e., velocity resolutions for the CO(3–2) line and for the CO(7–6) line). After editing the data for quality in the DIFMAP package (Shepherd, 1997), we were left with the (on–source, six–telescope array) equivalents of 32 hours of 3 mm data and 25 hours of 1 mm data. We inverted the data cubes with natural weighting (but no deconvolution) using the IMAGR task in the NRAO AIPS package (van Moorsel, Kemball, & Greisen, 1996). At 3 mm, the lower–sideband data yield a synthesized beam of at P. A. , and a noise level per channel that increases with velocity (decreases with frequency) from 0.8 to across the 480 MHz bandpass. The upper–sideband 3 mm data from the epochs with double–sideband tuning give a synthesized beam of at P. A. , and a sensitivity to 95.7 GHz continuum emission of . At 1 mm, the lower–sideband data give a synthesized beam of at P. A. , and a noise level per channel of across the entire 580 MHz bandpass. When both 1 mm sidebands are averaged together, the sensitivity to 217.8 GHz continuum emission is for the same synthesized beam.
3 CO(3–2) emission from cB58
3.1 Line parameters
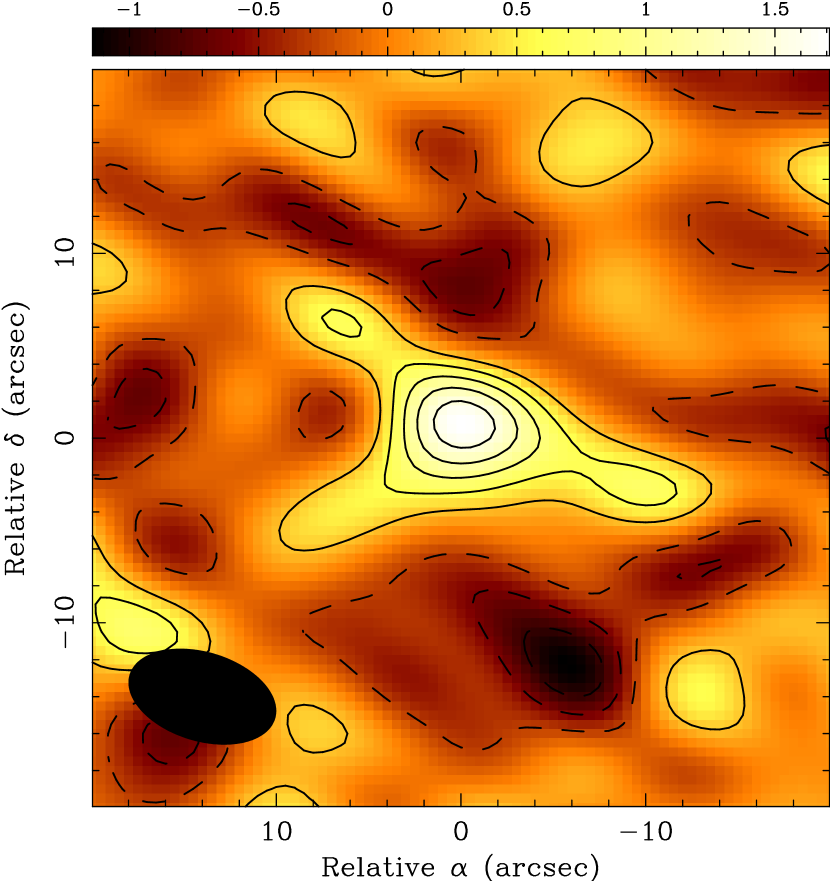
Cursory inspection of the 3 mm data cube reveals the presence of a line emission source close to the phase center with velocity width . To quantify the significance and parameters of this source, we convolved the resolution cube with a twelve–channel boxcar filter. The resulting cube contains channels, each of which overlaps its immediate neighbors by . The strongest source anywhere in this smoothed cube is shown in Figure 1: neglecting primary beam correction, it is a peak centered at 92.79 GHz (i.e., blueward of the nominal ). A two–dimensional Gaussian fit in the image plane indicates that it is spatially unresolved; Table Molecular Gas in the Lensed Lyman Break Galaxy cB5811affiliation: Based on observations carried out with the IRAM Plateau de Bure Interferometer. IRAM is supported by the INSU/CNRS (France), the MPG (Germany), and the IGN (Spain). lists the position derived from a fit that fixes the dimensions of the Gaussian to those of the synthesized beam. Two main lines of evidence argue that this peak is in fact the core of a CO(3–2) emission line from cB58:
-
1.
The position of the source. We can accurately register optical source positions into the radio reference frame for this field by identifying the () 7 mJy radio core in the resolution 6.1 cm map of Laurent–Muehleisen et al. (1997) with the central cD galaxy in the optical catalogue of Abraham et al. (1998).222NED positions for sources in this field have been calculated by identifying the cD with a less precisely located 21 cm source (Becker, White, & Helfand 1995). Under this assumption, the position of the optical fold arc agrees with the position of the putative CO(3–2) detection to within the latter’s astrometric uncertainties (see Table Molecular Gas in the Lensed Lyman Break Galaxy cB5811affiliation: Based on observations carried out with the IRAM Plateau de Bure Interferometer. IRAM is supported by the INSU/CNRS (France), the MPG (Germany), and the IGN (Spain).). Following Downes et al. (1999), we have calculated these uncertainties as the sum of three terms in quadrature:
-
(a)
The absolute uncertainty of the PdBI reference frame; this stems from the fundamental uncertainties of quasar positions.
-
(b)
The relative uncertainty introduced by using a calibrator (3C345) that is offset by from cB58. In principle, this uncertainty is about per degree of separation, i.e., . However, because any error is expected to vary smoothly with position, we can exploit the fact that the quasar 1504+377 (only away from cB58, but away from 3C345) lies within of the phase center in a map also calibrated by 3C345. For cB58, lying between 3C345 and 1504+377, we can then impose the somewhat tighter limit of .
-
(c)
The accuracy of our centroiding, which AIPS indicates is in right ascension and in declination. This term dominates the other two.
-
(a)
-
2.
The redshift of the line. Pettini et al. (2000, 2002) have arrived at estimates of the systemic redshift of cB58 from rest–UV photospheric absorption features that are blueward of the Teplitz et al. (2000) by in the rest frame of the source (see Table Molecular Gas in the Lensed Lyman Break Galaxy cB5811affiliation: Based on observations carried out with the IRAM Plateau de Bure Interferometer. IRAM is supported by the INSU/CNRS (France), the MPG (Germany), and the IGN (Spain).). From fits to the CO line profile (see below), we estimate a , whose blueshift relative to agrees fairly well with the rest–UV results. We do not view the consistent difference from as necessarily astrophysically significant; if were to arise largely in a wind, for example, we would expect to be lower than , contrary to what is seen. The discrepancy may rather reflect simple uncertainties in wavelength calibration.
Three further consistency checks offer no evidence against this proposed identification. First, our detection is consistent with the Frayer et al. (1997) upper limit of for a velocity width. Second, we see no sign of a velocity gradient in the CO(3–2) data cube; this negative result is consistent with the absence of any shear along the arc in rest–UV observations of higher spatial resolution (Pettini et al., 2002). Finally, the lack of obvious 1 mm continuum emission at the position of the putative CO(3–2) line (above a upper limit of 1.2 mJy) agrees with the results of Baker et al. (2001), who report a 250 GHz continuum flux density for cB58 of 1.06 mJy. Adopting their suggested dust temperature and dust emissivity index, the 217.8 GHz flux density expected in our PdBI map would be only 0.68 mJy (see also §4.1).
Given this identification, we proceed to calculate the parameters of the CO(3–2) emission in cB58. While Figure 1 gives a fair estimate of the flux in the core of the line (), it fails to account for additional emission in the line wings extending blueward and redward of this particular chunk of the spectrum. We have therefore fit Gaussians to the line profile through the brightest pixel in Figure 1, as extracted from versions of the original cube that have been rebinned to resolution and corrected for primary beam attenuation (e.g., Figure 2). To estimate the uncertainties in the line widths and intensities, we have performed these fits on spectra smoothed from 16.2 to with all three possible choices of rebinning (i.e., averaging channels {2–4, 5–7, …} and {3–5, 6–8, …} as well as {1–3, 4–6, …}). In addition to , we estimate a total line flux and a velocity dispersion (equivalently, ).
In the 1 mm data cube, we have summed putative CO(7–6) channels over a velocity interval within of that integrated to produce Figure 1. At the position of the CO(3–2) peak, no CO(7–6) emission is seen; the nominal line flux is . For a fair estimate of the CO(7–6)/CO(3–2) integrated intensity ratio , however, we must allow for the possibility that relative weakness in the CO(7–6) line can partly result from a relative lack of sampling at short , denoting the projected baseline length. We have therefore truncated both of the original CO(3–2) and CO(7–6) datasets below an identical minimum , and reinverted them with natural weighting. After correcting for primary beam attenuation and convolving the new CO(7–6) map to the (P. A. ) beam of the new CO(3–2) map, we take their quotient. In flux units, the line ratio in a small region centered on the position of the CO(3–2) line detection is then . Translated to brightness temperature units, this yields a nominal integrated intensity ratio
| (1) |
The lack of CO(7–6) emission in a noisy 1 mm map means that this value may not be a particularly meaningful upper limit. However, we can safely conclude that there is no evidence for large amounts of warm, dense molecular gas in cB58 like those observed in the submillimeter galaxy SMM J14011+0252 at a similar redshift (Downes & Solomon, 2003).
To evaluate whether the width and intensity of the CO(3–2) line in cB58 are consistent with what we would expect for a relatively unobscured starburst, we must compare it to the parameters of CO(3–2) emission observed in appropriate analogues. Mauersberger et al. (1999) report single–pointing CO(3–2) observations of a wide range of galaxy types; however, a better comparison sample is that of Dumke et al. (2001), who have mapped the CO(3–2) line across the disks of twelve nearby starburst and star–forming galaxies. The most revealing quantity for comparison with cB58 is the beam–diluted brightness temperature , where is the areal filling factor of a galaxy’s molecular clouds and is the rest–frame brightness temperature of a single cloud. Following Downes & Solomon (2003), we can write the “unlensed” CO luminosity in terms of both observed and rest–frame quantities:
| (2) | |||||
| (3) |
where is the solid angle in the source plane, is a velocity filling factor generally assumed to be unity due to the smoothness of extragalactic CO line profiles (e.g., Dickman, Snell, & Schloerb 1986), and is the factor by which the intrinsic CO(3–2) emission is magnified due to lensing. Solving for , we find
| (4) |
independent of cosmology. For the Dumke et al. (2001) sample, we can set and ; the CO(3–2) line flux, line width, and solid angle333Computed as from source diameters and in arcseconds. of the dominant “central peak” they determine for each system are listed in their Table 3. The resulting {} range from 0.4 to 5.4 K. For cB58, we can assume that the regions producing CO(3–2) line and rest–UV continuum emission (i.e., molecular clouds and the stars forming from them) are very similar, so that . By the same token, since model MVIa of S98 implies that the background LBG lensed into the cB58 arc has semi–major axes , we can assume . For and the line flux and FWHM derived above, Equation 4 then implies cB58 has . This value falls near those seen in the centers of M 51 (0.4), NGC 278 (0.6), and NGC 4631 (0.8) in the Dumke et al. (2001) sample.
The agreement of estimates for cB58 and three nearby star–forming galaxies is strictly empirical– in particular, we have not (yet) invoked any relationship between and molecular gas mass– and has three general implications. First, the consistency gives tentative support to our assumption that the system’s rest–UV continuum and CO line emission are identically lensed; there is no order–of–magnitude discrepancy that can only be accounted for by differential lensing. Second, it appears entirely plausible that cB58 contains molecular clouds whose distribution (i.e., ) and typical internal conditions (i.e., ) overlap with the ranges seen in local star–forming galaxy populations. A stronger formulation of this point is not warranted, given that the relative weighting of and in the product of both could still differ at high and low redshift. Finally, the molecular ISM in cB58 does not appear to resemble that of an ultra–luminous infrared galaxy (ULIRG) merger. Five of the six ULIRG molecular disks from which Lisenfeld et al. (1996) detect CO(3–2) emission have CO(1–0) line widths measured by Solomon et al. (1997) and intrinsic CO(1–0) and/or CO(2–1) source sizes inferred by Downes & Solomon (1998). Assuming that these systems’ and are similar for all CO transitions, we estimate values for their in the range . By the same token, the parameters of CO(3–2) emission in the lensed IR–luminous galaxy F10214+4724 () mapped by Downes, Solomon, & Radford (1995) imply – a factor of 20 larger than in cB58.
3.2 Molecular gas mass
The CO(1–0) line luminosity is well established as a proxy for the total gas mass gravitationally bound in a galaxy’s molecular clouds (Dickman et al. 1986; Solomon & Barrett 1991; Wolfire, Hollenbach, & Tielens 1993). In terms of a conversion factor ,
| (5) |
after including a factor of 1.36 to account for helium. Although applies reasonably well for molecular clouds in the Galaxy and in the disks of nearby spirals (Strong et al., 1988; Solomon & Barrett, 1991; Scoville & Young, 1991), for galaxies with subsolar metallicity the universality of the conversion factor is a contested issue. Wilson (1995) and Arimoto, Sofue, & Tsujimoto (1996) argue that rises for lower–metallicity systems; averaging their recommended values for the metallicity of cB58, which we take to be from Teplitz et al. (2000), would imply . In contrast, Rosolowsky et al. (2003) find no systematic trend of with metallicity in the range across the disk of M 33, while Bolatto et al. (2003) report for the SMC, considerably smaller than the Wilson (1995) and Arimoto et al. (1996) relations would predict. To reflect the range of these results, we adopt for cB58 in this paper.
Next, we must estimate cB58’s integrated intensity ratio . Dumke et al. (2001) report values ranging from 0.4 to 1.4 in the centers, and from 0.5 to 1.0 in the disks, of their sample of twelve galaxies. The centers of M 51 and NGC 278 are observed to have and 0.8, respectively; based on the analogy with cB58 in §3.1 above, we adopt for cB58. Now combining Equations 2 and 5,
| (6) |
Again assuming , and including the uncertainty in the appropriate value of , we estimate for cB58 . We make no correction for the atomic mass component of cB58’s ISM, although we note that in low–metallicity systems, a large fraction of the gas that is gravitationally bound into the “molecular” clouds traced by the CO lines (and thus readily available for star formation) may already be atomic in phase.
cB58’s molecular gas mass is comparable to those seen in the more gas–rich members of the local spiral population (e.g., Helfer et al. 2003), somewhat smaller than those seen in nearby ULIRGs (Bryant & Scoville 1999; cf. Downes & Solomon 1998), and up to an order of magnitude less than those inferred for submillimeter–selected systems at comparably high (Frayer et al., 1998, 1999; Neri et al., 2003). If its molecular gas is spread over a disk of radius in the source plane (see §3.3 below), the corresponding mass surface density will be . Such surface densities are more reminiscent of the centers of gas–rich spirals (Helfer et al., 2003) than of ULIRGs, consistent with the similarity noted above between cB58 and the Dumke et al. (2001) sample in terms of . Since the use of a single conversion factor in different galaxies relies on the assumption that their molecular cloud properties are reasonably similar (Dickman et al., 1986), this consistency serves to validate our use of a (metallicity–corrected) Galactic to estimate in the first place.444Indeed, our use of a conversion factor exceeding the Galactic by a factor of 2.25 implies that in terms of its mean molecular hydrogen column (), cB58 will more closely resemble the galaxies in the Dumke et al. (2001) sample whose beam–diluted brightness temperatures are more typical (i.e., not among the lowest observed).
3.3 Dynamical mass
Our spectrally resolved CO(3–2) detection means that we can estimate the dynamical mass of cB58 from its velocity width according to
| (7) |
Here is a constant of proportionality whose value depends on the intrinsic geometry of cB58’s molecular gas, and on how that geometry couples with the effects of lensing. Since molecular gas is extremely dissipative and unlikely to remain molecular in phase if severely disturbed, it is more likely than not that the CO emission from cB58 arises in a rotating disk. Indeed, the S98 source plane reconstruction suggests that the fraction () of the background LBG being magnified into the fold arc corresponds to half of such a disk, slightly inclined and with half–light radius . In this scenario, assuming that and that the magnified half of the disk traces only half of the galaxy’s full line width, we would infer . This corresponds to a dynamical mass within a radius of , with the uncertainties in reflecting only the uncertainties in .
If we wish to avoid relying too heavily on the details of the source morphology reconstructed by S98, we can also consider the possibility that cB58’s molecular gas has a spherical rather than disklike distribution. In this scenario, (for a sphere of uniform density) and correction of the observed half–light radius of A2 for lensing yields a characteristic . The implied dynamical mass is now a somewhat smaller within a radius of . We view this estimate as less plausible than the result for a disklike geometry, however, for the a priori reasons noted above.
For either assumed gas configuration, we can compare with the derived in §3.2 above to estimate the molecular gas mass fraction in the center of cB58. For a disk geometry, within a radius; for a spherical geometry, within . Both scenarios imply a rather high gas mass fraction, although the uncertainties in both estimates (including for the disk case) make it impossible to exclude the possibility that .
4 Emission from a second source
4.1 X and its possible origins
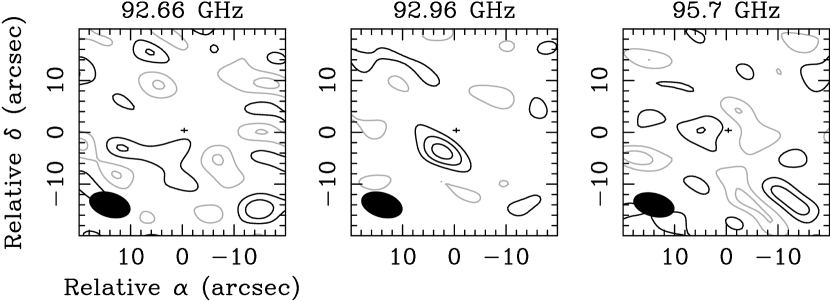
Further examination of our 3 mm data cube– specifically, the velocity channels outside the range spanned by cB58’s CO(3–2) emission– reveals a second source in the same field. Averaging over a 200 MHz bandwidth centered at 92.96 GHz (i.e., over a velocity range lying blueward of for cB58) yields the map shown in the center panel of Figure 3. The new source (hereafter “X”) has an apparent flux density ( for the uncertain flux scale) after primary beam correction. A Gaussian fit gives the position listed in Table Molecular Gas in the Lensed Lyman Break Galaxy cB5811affiliation: Based on observations carried out with the IRAM Plateau de Bure Interferometer. IRAM is supported by the INSU/CNRS (France), the MPG (Germany), and the IGN (Spain)., which coincides with the radio continuum core of the cD in the lensing cluster (Becker et al., 1995; Laurent–Muehleisen et al., 1997) and is clearly distinct from the position of cB58’s CO(3–2) centroid.555The tight astrometric constraints in a common radio reference frame also imply that cB58 cannot be the source of both the CO(3–2) emission discussed in §3 and the 6.1 cm continuum emission mapped by Laurent–Muehleisen et al. (1997). Puzzlingly, however, we do not detect comparably significant emission from X in a 140 MHz bandwidth centered at 92.66 GHz (nominally ), or in our 95.7 GHz continuum map (nominally ), as shown in the left and right panels of Figure 3. X also fails to appear in our 217.8 GHz continuum map (nominally ).
Since the noise is 50% higher in our maps at 92.66 GHz (due to a smaller bandwidth and the noise gradient described in §2) and at 95.7 GHz (due to the dearth of upper–sideband data) than at 92.96 GHz, it remains possible that X is indeed a weak continuum source. In this case, its positional coincidence with the cD suggests a likely nonthermal origin. The cD’s radio core has a 1.4 GHz flux density at resolution (Becker et al., 1995), and a 4.9 GHz flux density at resolution (Laurent–Muehleisen et al., 1997), meaning it either varies or has an unusually inverted slope ( for ). In the Dallacasa et al. (2000) sample of High Frequency Peakers (HFPs), reaches values as extreme as , so the latter possibility is plausible. Assuming the cD radio core is young, with below a turnover frequency as high as those of the most extreme HFPs () and above (e.g., Condon 1992), we would predict a 92.96 GHz flux density . A less aggressively tuned SED could still account for all of the observed 0.87 mJy from X. This scenario would explain why no emission from X appears in our 217.8 GHz continuum map, since a spectral index would imply , i.e., at the level of the noise.
A less plausible continuum scenario accounts for X as thermal dust emission associated with star formation in the cD. Analogous systems do exist; of the two detections of cDs by Edge et al. (1999), for example, at least one (in Abell 1835) has an unambigous dust origin. However, the tight constraints on emission from X at make it unlikely that the cD in MS 1512+36 is similar. For the median dust temperature and (relatively flat) emissivity index in the local starburst sample of Yun & Carilli (2002), a galaxy with flux density 0.87 mJy at 92.96 GHz should have flux densities , 22, and 65 mJy at 1.4 mm (217.8 GHz), 1.2 mm, and , respectively. It is marginally possible that our PdBI map could have resolved out 14 mJy of 217.8 GHz emission from X. It is completely inconceivable, however, that bolometer array observations of cB58 could have missed such strong emission from a second source so close on the sky. For the and (HPBW) beams of MAMBO at the IRAM 30 m telescope and SCUBA at the JCMT, a separation translates to attenuation by factors of 0.59 and 0.75, respectively. Accounting for this correction, Baker et al. (2001) should have measured at 1.2 mm for cB58, rather than the observed, while van der Werf et al. (2001) and Sawicki (2001) should have measured at , rather than their detection and 3.9 mJy upper limit. Similar inconsistencies are encountered for any reasonable choices of and .
If we instead take Figure 3 at face value and interpret X as an emission–line source, its positional coincidence with the cD must be essentially accidental. Its irregular velocity “profile” (Figure 4) does not permit a detailed fit for an exact centroid or width, although it is clear that the latter must be comparable to the bandwidth smoothed to obtain the center panel of Figure 3. Such a velocity width is incompatible with the velocity dispersion for the cD required by the S98 lensing model; moreover, a rest frequency does not correspond to any strong recombination line (Towle, Feldman, & Watson 1996) or molecular rotational transition. We therefore adopt the reverse strategy of assuming X is one of the strongest extragalactic emission lines– i.e., a CO rotational transition– and asking whether an object at the corresponding redshift can provide a self–consistent explanation. As CO(1–0) emission, X would necessarily come from a galaxy lying in front of the cluster. The only possible candidate is the foreground spiral “S” seen southeast of X, which S98 suggest has on the basis of its angular size and color. However, its apparently face–on orientation makes a linewidth highly implausible, particularly at a radius from the center of a spiral that would otherwise appear to be CO–poor.
As CO(2–1) emission from a galaxy or CO(3–2) emission from a (further) galaxy, X would lie behind the lensing cluster and therefore undergo some degree of magnification. A significant challenge for this scenario is that any background source producing an image within an arcsecond of the central cD should also produce a number of counterimages (over the same velocity range) elsewhere in the cluster field. Velocity considerations alone mean X cannot be CO(3–2) emission from a fifth image in the W set of S98, since here the background source redshift lies only from that of cB58 (Teplitz, Malkan & McLean 2002). To explore the possibility that X is CO(2–1) or CO(3–2) emission from a hitherto unknown background source, we have implemented the S98 lensing model within the gravlens package (Keeton, 2001). As discussed in Appendix A, we have then assumed that X is one image of a lensed background point source and calculated where the corresponding counterimages should lie for both and . The only configurations that do not predict a strong counterimage where none is observed require that X correspond to two merging images of opposite parity on opposite sides of a critical curve. Because the details of such models depend sensitively on the exact shape of the lens mass profile, we view our particular results as largely speculative. We do consider a more appealing possibility than , since we already know that cB58 and the background source producing the W image set lie at about the same redshift (Teplitz et al., 2002). The projected separation between the background galaxies lensed to produce cB58 and X would be only in this case; the presence of an additional, more obscured and gas–rich companion that could have helped trigger cB58’s star formation recalls the multiple–component morphology of the LBG Westphal–MMD11 (Chapman et al., 2002). However, for either , a lensed background source would need to have sufficiently strong dust extinction to avoid easy detection behind the cD in HST optical imaging, yet sufficiently weak dust emission to avoid easy detection in and bolometry. This combination of properties requires a significant, perhaps fatal degree of fine tuning.
4.2 Implications of X for parameters of cB58
There are two ways in which the presence of source X within of cB58 on the sky might lead us to adjust the properties of the emission we attribute to the LBG. The first is the prospect that continuum (or broad line) emission from X has contaminated our measurements of the CO(3–2) emission line within the PdBI data cube. This turns out not to be a problem. If we treat X as line emission, then the best estimate of its velocity centroid and width (see Figure 4) place it mostly blueward of cB58’s CO(3–2) emission, and the positional offset suppresses any remaining contamination. If we treat X as nonthermal continuum from the cD and subtract a model of the line–free channels from the data before inverting a now “line–only” cube, we measure CO(3–2) line parameters for cB58 that are virtually identical to those derived in §3 without the benefit of “continuum subtraction” (e.g., the peak in Figure 1 nominally increases from to ).
The second possible problem is that if X is continuum emission from the cD or line emission from a dusty background source, there may be some contamination of the 1.2 mm and dust emission attributed to cB58 by Baker et al. (2001) and van der Werf et al. (2001), respectively. The amount of dust that could be associated with a lensed line source is difficult to quantify. The possible contamination by nonthermal continuum from the cD is more tractable: assuming and accounting for the different MAMBO and SCUBA beam sizes, we would estimate that roughly 0.22 mJy of each detection could have come from the cD. This would represent of the detection, but of the 1.2 mm flux density. To the extent that this has occurred, the weaker dust emission attributed to cB58 would support the conclusion of Sawicki (2001) that the galaxy’s long–wavelength SED differs from those of local starbursts, although this difference would still be less dramatic than past (over)estimates of its rest–UV reddening have suggested (Baker et al., 2001).
5 Discussion
5.1 Star formation in cB58
Previous studies of cB58’s rest–UV spectroscopic properties have placed strong constraints on its most likely star formation history. The underabundance of nitrogen and iron–peak elements inferred from a Keck/ESI spectrum (Pettini et al. 2002; cf. Teplitz et al. 2000) requires that star formation must have begun at some , consistent with the lack of evidence for any older stellar population in rest–frame near–IR emission (Bechtold et al., 1998). The initial population synthesis analysis by Pettini et al. (2000) of their Keck/LRIS spectrum has been revisited by De Mello, Leitherer, & Heckman (2000) and Leitherer et al. (2001) using successive improvements of the original Starburst99 package (Leitherer et al., 1999). Overall, these three exercises find satisfactory agreement with the observed spectrum if cB58 has been forming stars at a constant rate with a Salpeter (1955) Initial Mass Function (IMF) up to for the last . We can use this picture of cB58’s recent past to estimate its star formation rate in the present. The Starburst99 models for the above range in predict
| (8) | |||||
where we have extended the Salpeter IMF to . For cB58, Teplitz et al. (2000) measure a Balmer decrement of 3.23 and an flux of ; correcting the latter by a factor of 1.32 for LMC extinction (Howarth, 1983) and assuming implies . Given that the distributions of UV and emission in local starbursts are broadly similar (Conselice et al., 2000), should indeed hold if the fraction of the background source being lensed is truly as high as . The rate of star formation per unit area in cB58, , appears within the uncertainties to be following a Schmidt (1959) law dependence on . From the best–fit relation determined by Kennicutt (1998),
| (9) |
we would have predicted cB58 to have .
After continuous star formation at the current rate for the last 20–100 Myr, cB58 should already have produced in the present episode. For any such stellar mass, the implied baryonic mass– – is still safely less than the best estimate of the dynamical mass (), an encouraging consistency check. For several reasons, we consider a stellar mass () at the upper end of the allowed range to be the most plausible scenario. First, estimates of small (and low ) that involve rest–UV continuum colors (e.g., Ellingson et al. 1996; Pettini et al. 2000) entail higher levels of extinction than are indicated by several other lines of evidence (Baker et al., 2001). Second, the difference should be small, since (a) there is no evidence for any very old stellar population (see above), and (b) we do not expect large dark matter contributions to the total mass budget at . Indeed, assuming and (all but indistinguishable from in a population synthesis model with continuous star formation) would leave exactly. We will therefore assume and in what follows. Third, if cB58 is a typical LBG in respects other than its fortuitous location behind a lensing cluster, we would expect its to be comparable to those inferred from population synthesis analyses of LBGs with similar intrinsic brightnesses. Correcting the observed (Ellingson et al., 1996) for lensing implies cB58 has an intrinsic . 32 of the 74 LBGs for which Shapley et al. (2001) succeed in deriving SED fits have within 0.5 mag of this value. These have a mean stellar mass of ; a healthy five of the 32 have , but only one has . Finally, following the argument of Pettini et al. (2002), would also imply that cB58 has already turned a fraction of its baryons into stars, roughly the level required to account for the enrichment of cB58’s ISM to the observed . In fact, the stellar/baryonic mass fraction is close enough to this threshold to reinforce the argument against previous episodes of star formation; these would tend to have elevated the galaxy’s oxygen abundance above its observed value.
Besides charting its past history, we can predict how far into the future cB58 can continue forming stars at the present rate before it exhausts its readily available fuel. Combining Equations 6 and 8, we have (independent of cosmology) a gas consumption timescale
| (10) | |||||
For cB58, we find , an eminently reasonable value. In nearby spiral galaxies, using far–IR luminosity as a proxy for star formation rate, Devereux & Young (1991) have showed that the median is . In contrast, the most luminous local ULIRGs have more efficient star formation and approaching (Bryant & Scoville, 1999). cB58, as befits a starburst of intermediate intensity, falls between these two extremes.
An important caveat in forecasting the future of star formation in cB58 is that the remaining lifetime of the current episode, , may be less than if a large fraction of the galaxy’s molecular gas reservoir is expelled by an energetic superwind before it can be turned into stars. Pettini et al. (2000, 2002) have shown that cB58 is driving a wind in which two thirds of the neutral column is blueshifted by with respect to (Table Molecular Gas in the Lensed Lyman Break Galaxy cB5811affiliation: Based on observations carried out with the IRAM Plateau de Bure Interferometer. IRAM is supported by the INSU/CNRS (France), the MPG (Germany), and the IGN (Spain).). The black cores for the strongest absorption lines at this indicate a high covering fraction and suggest that much of the outflowing material lies well in front of the galaxy’s stars along the line of sight. Following Heckman et al. (2000), the mass loss rate for a constant–velocity, mass–conserving superwind flowing from some minimum radius into a solid angle will be
| (11) |
For cB58, setting and by analogy with local systems (Heckman et al., 2000) yields , somewhat smaller than the current star formation rate. In this simple picture, the superwind should reduce below by about a third– an effect whose relative mildness accords with several other lines of evidence. Since , the bulk of the molecular gas in cB58 cannot be participating in the outflow, and the observed enrichment of cB58 implies it has been able to retain at least some of the metals produced at earlier times (Pettini et al., 2002). Moreover, while would already fall within a factor of 2–3 of cB58’s most plausible , a much lower would require that we have caught the starburst in this system at a special moment near its very end.
Overall, then, we appear to be observing a galaxy in the midst of converting worth of baryons into stars over a period (see also §5.2 below). Both the mass of stars formed (and their age) by the end of this process will fall within the ranges inferred from population synthesis analyses of large LBG samples (Papovich et al., 2001; Shapley et al., 2001). As expected from considerations of causality (Lehnert & Heckman, 1996), the duration of the star formation episode will exceed the crossing time in cB58, which is roughly . By the present day, cB58 will be of order a system in the local mass function of Cole et al. (2001b),666For self–consistency, we assume here that , as appropriate for the Cole et al. (2001b) population synthesis models using a Salpeter IMF. with the stars formed in the current burst ranging from in age, i.e., indistinguishable from coeval. This projected stellar mass is necessarily quite uncertain, given that the superwind may permanently expel some fraction of the system’s current baryonic mass, while galaxy merging, and ongoing star formation from the atomic gas presumably lying at larger radii, are both likely to occur as time passes. Nevertheless, it is suggestive that even this crude estimate lies well within the range of bulge masses estimated from –band isophote fitting of local spirals. The samples of Andredakis, Peletier, & Balcells (1995) and Moriondo, Giovanardi, & Hunt (1998), for example, scatter (widely) about a median , assuming in band (Moriondo et al., 1998).
Because cB58 is such a strongly lensed system, it is fair to ask how our conclusions depend on the details of the lensing model. The complexity of the S98 model, which is tightly constrained by a number of multiply imaged sources in the cluster field, makes a detailed examination prohibitive. However, we can at least argue that differential lensing of emission at different wavelengths is not likely to have undermined our results. We have already assumed without penalty that (in §3.1) and that (above). The strong correlation between dense gas and dust emission suggests is also reasonable. More concretely, Shapley et al. (2003) show that cB58 obeys all of the same scaling relations (among equivalent width, interstellar absorption line strengths, and interstellar absorption line velocity offsets from ) obeyed by unlensed LBGs. This consistency suggests that the fraction () of the background source we are seeing is not some unrepresentative slice of the galaxy. In short, differential lensing does not appear to have a major impact on the inferred global parameters of cB58, or at least, is not the dominant source of uncertainty in our conclusions. It remains possible, of course, to make assumptions that will lead to a contradiction of some sort. Adopting a larger conversion factor and a smaller age for the current star formation episode , for example, the stellar/baryonic mass ratio becomes too small () to account for the observed enrichment. However, for the equally (if not more) reasonable assumptions made in this paper, no such problems occur; this not only gives us confidence that the parameters we have derived are appropriate for cB58, but also hope that they may be representative for the LBG population as a whole.
5.2 Implications for galaxy evolution models
Our detection of CO(3–2) emission from cB58 provides a set of parameters whose values can be compared with those adopted and inferred by models for galaxy evolution at high redshift. Basing such comparisons on rather uncertain measurements for a single object obviously limits the generality of our conclusions; nevertheless, the exercise is interesting as a guide to the analyses that will eventually be possible for larger samples with more sensitive millimeter interferometers like ALMA. Our discussion here focuses on comparisons to representative semi–analytic models (Kauffmann & Haehnelt 2000 = KH00; Somerville, Faber, & Primack 2001 = SPF01; Cole et al. 2001a = CLBF01) rather than fully numerical models, since it is fairly straightforward to compare the assumptions made in the former with the relationships among the global properties we have measured for cB58. The first question we examine is how well cB58 matches the models’ parametrizations for star formation. SPF01 assume (as in the fiducial model of Somerville & Primack 1999) that for “constant efficiency” quiescent–mode star formation, at all times. This prescription overpredicts the current star formation rate in cB58 by about a factor of five. Other authors have chosen to model quiescent–mode star formation using empirical relations seen to hold in local disk galaxy samples. We have already noted in §5.1 above that cB58’s surface densities of (molecular) gas and star formation follow a global Schmidt law; this validates the simple assumption made for LBGs by Mo, Mao, & White (1999). Star formation rates also correlate with the ratio of gas surface density to a disk’s dynamical timescale (Kennicutt, 1998; Wong & Blitz, 2002). For the convention , i.e., half of the orbital timescale at the disk’s outer edge, this relation takes the form locally
| (12) |
in terms of a dimensionless efficiency parameter (Kennicutt, 1998). For cB58, adopting and gives and as observables for the models to reproduce.
In KH00, the disk dynamical timescale is estimated from the parameters of halos at a given redshift under the assumption that disks typically contract by a factor of ten before becoming rotationally supported. In this case,
| (13) |
in terms of the Hubble constant as a function of redshift; for our cosmology, and . cB58 would then be expected to have , compatible with the observations given its uncertain inclination. However, also represents almost a factor of four discrepancy with the parametrization of quiescent–mode star formation preferred by KH00, which postulates an efficiency declining as . A similar underefficiency is seen in the models of CLBF01, whose fiducial case effectively specifies that
| (14) |
for the convention adopted in Equation 12 above and the circular velocity at the half–mass radius. Assuming, crudely, that for cB58, Equation 14 predicts an efficiency that will only match the observations if – a scenario in which the galaxy’s dynamical mass becomes implausibly large.
Although the above discussion suggests that current semi–analytic models do not adequately describe cB58 in terms of quiescent–mode star formation, it remains possible that a merger–induced burst mode may provide a better account. KH00 model bursts using a fixed gas consumption timescale ; this is about a factor of three shorter than what we infer for cB58. SPF01 implement a more complex prescription for bursts, in which a fraction of the progenitors’ original gas mass is turned into stars according to
| (15) |
over a duration . Reflecting the results of numerical simulations, is set to 0.75 for equal–mass mergers, and to 0.5 for minor (10:1 mass ratio) mergers in which neither progenitor has a significant bulge. For cB58, if we fix and assume that the current stellar mass within can be estimated independently of the galaxy’s star formation history (e.g., as ), we can solve for and as well as the age of the current burst. As a major merger in this parametrization, cB58 would be observed before the peak of a burst; as a minor merger, it would be observed after the peak of a burst. SPF01 set in their models; the estimated for cB58 above thus slightly favors a minor merger scenario, in which the bulge that could otherwise have suppressed star formation (Mihos & Hernquist, 1994) might only now be forming (see §5.1). However, since SPF01 also assume that the quiescent mode of star formation should continue throughout a burst, the total star formation rate their model predicts for cB58 is still likely to exceed what is observed.
In the context of the semi–analytic models considered here, then, cB58’s star formation parameters can be accounted for by a simple Schmidt law; by a quiescent mode whose rate depends on the dynamical timescale (provided the efficiency remains at least as high as seen locally; cf. KH00); or by a burst mode triggered by a minor merger (provided rapid quiescent–mode star formation can somehow be suppressed; cf. SPF01). Given the observational uncertainties, the variety of complex star formation histories that are compatible with cB58’s rest–UV spectrum (e.g., Leitherer et al. 2001), and the lack of comparison objects, it would be premature for us to argue strongly here for or against the use of any of these star formation recipes for the LBG population as a whole. cB58 does fulfill the more general expectation– noted by both KH00 and SPF01– that star–forming galaxies at high redshift should be relatively gas–rich. SPF01 in particular predict that LBGs should have high mass fractions of cold (molecular) gas, with the median for LBGs with . For cB58, whose observed magnitude (Ellingson et al., 1996) corrected for lensing implies , the most likely falls well inside the envelope of the authors’ mock Hubble Deep Field catalogue (as is also the case for several of the galaxy’s other parameters; see their Figure 16). The KH00 models predict similarly that for major mergers increases to by , although the evolution will not be as strong for a cosmology.
A second question our observations of cB58 help address relates to the uncertain mass scale of LBGs. Direct estimates of stellar masses from optical/near–IR photometry (Papovich et al., 2001; Shapley et al., 2001) and dynamical masses from nebular emission line widths (Pettini et al., 1998, 2001) reveal concentrations in the centers of LBGs, as anticipated by early analyses of LBG sizes and luminosities alone (e.g., Lowenthal et al. 1997). In this context, it is not a surprise that we estimate in cB58 from observations that (by assumption– most explicitly in our invocation of ) again trace only a galaxy’s bright core. The fact that the CO(3–2) linewidth is within 10% of the linewidth measured by Teplitz et al. (2000)– vs. – does supply useful evidence that is not unduly affected by the superwind, although it remains possible that neither nor CO emission traces cB58’s full rotation curve. The more unique contribution here comes from our estimate of a total star formation timescale ( for a constant star formation rate; for a merger–triggered burst a la SPF01) that is a substantial fraction of the time elapsed over the range probed by the Lyman break selection function ( for our cosmology). Given that the star formation timescale can be extended if the gas reservoir is replenished by inflow, recycling (Kennicutt, Tamblyn, & Congdon 1994), or future merging, we can conclude– provided cB58 is representative and does not suffer substantial mass loss– that the duty cycle for star formation in LBGs at this redshift will be of order 50%.
The strong clustering of LBGs implies that they are a highly biased galaxy population (Giavalisco et al., 1998; Adelberger et al., 1998; Arnouts et al., 1999; Giavalisco & Dickinson, 2001; Porciani & Giavalisco, 2002; Foucaud et al., 2003), and thus that they must occupy the most massive halos at . Exactly how to associate LBGs with halos of mass – i.e., the precise form of the halo occupation function – remains an open issue. If is assumed, a fiducial can be estimated for a given LBG sample by identifying the mass scale at which halos have the same number density and bias. Adelberger et al. (1998) and Giavalisco & Dickinson (2001) use this approach to infer for the halos hosting LBGs with (like cB58 after correction for lensing). The associated baryonic masses should then be ,777We assume for (Burles & Tytler, 1998). which even if reduced to match lower estimated clustering strengths (Adelberger et al., 2003) will be in excess of the direct measurements for most individual LBGs by at least a factor of a few. Packing multiple LBGs into a single massive halo would in principle reduce this discrepancy. However, while the high close pair fraction at does favor (Wechsler et al. 2001; Bullock, Wechsler, & Somerville 2002), the apparent dependence of clustering strength on number density (Giavalisco & Dickinson, 2001; Foucaud et al., 2003) argues strongly that in fact (Bullock et al., 2002). Our estimate of a duty cycle for star formation further suggests that the remaining baryons in a halo hosting one LBG also do not lie in some large population of cohabiting, “dormant” LBGs in which starbursts have faded or not yet begun. This consideration further disfavors scenarios in which star formation episodes in an individual LBG are extremely brief (e.g., triggered by frequent sub–halo collisions: Kolatt et al. 1999). Instead, the remaining baryons in a given LBG’s host halo are likely to be found in the galaxy’s own lower surface brightness outskirts, in cohabiting galaxies of significantly lower mass, or outside galaxies altogether (where they may have been banished by a vigorous superwind).
5.3 Millimeter line/continuum ratios at
After SMM J14011+0252 (Frayer et al., 1999; Ivison et al., 2000), cB58 is only the second galaxy without an active nucleus to have been detected in CO emission at high redshift. Among all detected sources, cB58 is also fairly unusual in not having been prioritized for CO observations on the basis of a previous measurement of strong dust emission in the (sub)millimeter; the radio galaxy 53W002 (Scoville et al., 1997) is perhaps the only other member of this category. Because it does not reflect common selection biases, then, it is of interest to compare cB58’s line/continuum ratio to those of other systems at comparable redshifts. Due to the large uncertainties in dust temperature and conversion factor, this ratio may only poorly translate to a star formation efficiency or a gas/dust ratio. However, it is still interesting from a practical standpoint to see how much source–to–source variation in global ISM parameters exists at high redshift, since this will drive strategies for deep surveys with the next generation of millimeter interferometers.
In order to limit the impact of CO excitation uncertainties on our comparison, we will restrict our comparison to sources in the range that have been observed in the CO(3–2) line and in continuum at 1.2 mm. The observed 1.2 mm flux density (corresponding to rest wavelengths over this redshift range) is a generally reliable (albeit somewhat redshift–dependent) measure of thermal dust emission.888We exclude the exception to this rule, MG 0414–0534, whose extremely strong 1.2 mm flux density is dominated by nonthermal emission (Barvainis et al., 1998). cB58 has a ratio ; if we assume as discussed in §4.2 that 0.22 mJy of its apparent 1.2 mm flux density actually comes from the foreground cD, then becomes . The seven comparison objects in the compilation of Beelen et al. (2003)999F10214+4724, the Cloverleaf, 53W002, SMM J02399–0136, Q1230+1627B, SMM J14011+0252, and J 1408+5628. have values of ranging from (J 1408+5628: Omont et al. 2003; Beelen et al. 2003) at the low end to (53W002: Alloin, Barvainis, & Guilloteau 2000) and (SMM J14011+0252) at the high end. With cB58 occupying the opposite end of this interval from the only other galaxy not hosting an energetically dominant active nucleus (SMM J14011+0252), and the only other galaxy not selected on the basis of its dust emission (53W002), there is no evidence that either selection criterion significantly biases the line/continuum ratio. It is in fact rather remarkable that all eight systems have values agreeing to within better than a factor of three. Two quasars with CO(3–2) upper limits in the survey of Guilloteau et al. (1999) would in principle correspond to ; however, since quasar nondetections often result from uncertain CO redshifts rather than weak CO lines, these may not be the outliers they appear.
6 Conclusions
From our observations of the gravitationally lensed Lyman break galaxy cB58, we estimate that within a radius of , it most likely has
-
1.
an age for the current star formation episode ;
-
2.
a current star formation rate ;
-
3.
a formed stellar mass ;
-
4.
a molecular gas mass ;
-
5.
a lifetime for continued star formation , lower to the extent that molecular gas is expelled by the observed superwind before it can be turned into stars;
-
6.
a molecular gas mass surface density ;
-
7.
a dynamical mass ; and
-
8.
a gas mass fraction .
We judge that these estimates should not have been severely compromised by differential lensing, or by the possible effects of nonthermal continuum or (lensed) CO line emission from a nearby source X. We conclude that cB58 is partway through an episode of star formation lasting several dynamical timescales, and in the absence of substantial mass loss, gas inflow, or further merging will evolve into a system whose mass and coevality are those of a spiral bulge.
To the extent that cB58 is a typical LBG apart from its magnification, its global parameters place new constraints on the permissible recipes for star formation in semi–analytic models of galaxy evolution. Its current star formation rate, molecular gas mass, and inferred stellar mass are at least reasonably compatible with the expectations for a Schmidt law, for a quiescent mode of star formation tied to the local dynamical timescale, and for a burst mode of star formation (here triggered by a minor merger), although no published model offers perfect agreement. Its high gas mass fraction agrees with theoretical predictions that should increase with redshift. The duration of cB58’s current star formation episode appears to be long relative to the redshift range probed by the Lyman break technique at ; this argues for a high duty cycle for star formation, and against scenarios in which the halo hosting an observed LBG is over time “lit up” by many different objects undergoing brief bursts. Finally, from a comparison with other systems detected in CO(3–2) and dust emission, we arrive at the useful empirical conclusion that the millimeter line/continuum ratio is not a strong function of nuclear activity or dust luminosity.
Appendix A Revisiting the S98 lensing model
S98 model the total deflection potential of the lens as a sum of elliptical potentials due to individual galaxies and the cluster as a whole. The th term in this sum is centered at some position and is characterized by a normalization (recoverable from a tabulated velocity dispersion according to their equation A3), a scale length , and an ellipticity :
| (A1) |
In gravlens, a softened power–law potential can be specified in terms of an index , normalization , scale length , and ellipticity :
| (A2) |
Equality between Equations A1 and A2 holds for and
| (A3) | |||||
| (A4) | |||||
| (A5) |
Our version of the S98 model is constructed in an coordinate frame with axes parallel to the rows and columns of the WFPC2 chip and an origin at the position of the cluster cD. We have measured lens–plane galaxy positions from the F675W image of S98, used Equations A3 through A5 to rescale the values specified for their model MVIa, and rotated position angles for the cluster and cD major axes to match our coordinate convention. To confirm that the resulting gravlens version is a reasonable facsimile of the original model, we have examined the lensing of a background point source which would appear at the observed position of image A2. Our model specifies that the image of a point source at A2 has undergone a factor of 2.38 magnification, in excellent agreement with the factor of 2.39 estimated by S98. Our model also predicts that two additional images of the same background source should appear at the locations marked by filled circles in Figure 5, i.e., within the cB58 arc. Exact reproduction of the arc produced by an intrinsically extended (rather than point) background source is beyond the scope of this paper.
We have also checked that the projected mass density specified by our reparametrization of the S98 lensing model can roughly account for the positions and magnifications of the additional (B, C, and W) sets of multiple images in this field. Because the corresponding background sources do not necessarily lie at the same as cB58, it is necessary to apply a further rescaling to the deflection potential for each one. Conveniently, the cosmological dependence of the deflection potential can be factored out of the normalizations for the individual terms. For source and lens redshifts and and the critical surface density for lensing ,
| (A6) |
where we write to denote the angular diameter distance to a source at redshift as seen from a lower redshift . The correct rescaling for the th background source at redshift is thus to map for each , where is a lensing strength defined as
| (A7) |
The precise mapping between and depends on the choice of cosmology. Since the S98 model MVIa solves for the explicitly (corresponding, in our cosmology, to , , and ), we can rescale our gravlens deflection potential directly. The derived image positions shown in Figure 5 are in generally good agreement with the data, although gravlens predicts that there should be one additional image each of both the C and the W background sources (only the latter is predicted by S98). Note that the assumption of (see below) fixes in our cosmology.
In exploring the possibility that source X could be gravitationally lensed CO(2–1) emission from a source at or CO(3–2) emission from a source (other than cB58) at (see §4.1 above), the strongest constraint is imposed by the absence of counterimages within the 50% response of the PdBI primary beam at 92.96 GHz (see, e.g., the lower panel of Figure 6). Indeed, the second–strongest feature in the entire map is a peak lying to the southeast of X (not shown), where the primary beam response is only . If this were a true counterimage, its implied flux density of would require that it be more highly magnified than X by a factor between 15 and 36– an unlikely situation at a position where the lens model predicts only a single image and a magnification for either choice of . The counterimages of X that the model does predict lie at much smaller radii. For both and , we have used gravlens to predict the image positions and magnifications that result if we place X at each of the nine grid points defined by in terms of the astrometric uncertainties listed in Table Molecular Gas in the Lensed Lyman Break Galaxy cB5811affiliation: Based on observations carried out with the IRAM Plateau de Bure Interferometer. IRAM is supported by the INSU/CNRS (France), the MPG (Germany), and the IGN (Spain).. Typically, we find X has one or more counterimages that are at least as strongly magnified, far enough away not to be confused with X, and close enough to our phase center that they would hardly suffer any primary beam attenuation. Such counterimages would be detected if they existed at all; their absence instantly invalidates the particular models in which they appear.
In a few cases, the lensing geometry can conspire to place X and a bright counterimage X2 close to each other on opposite sides of a critical curve. The upper panels of Figure 6 show the most promising examples of such configurations. For (at left), placing X at yields a net magnification of X+X2 three times higher than that of the next brightest counterimage in the field. For (at right), the magnification of X+X2 that results from placing X at is a factor of twelve higher than that of the next brightest counterimage– entirely consistent with the manifestation of only a “single” source in the lower panel of Figure 6. Exactly how realistic such models are depends strongly on the precise shape of the lens mass profile at small radius. With Kassiola & Kovner (1993) having shown that elliptical potentials translate to unphysical, peanut–shaped isodensity contours for ellipticities (using the gravlens definition), for example, our use of for the cluster and for the cD suggests there are reasonable grounds for caution.
References
- Abraham et al. (1998) Abraham, R. G., Yee, H. K. C., Ellingson, E., Carlberg, R. G., & Gravel, P. 1998, ApJS, 116, 231
- Adelberger & Steidel (2000) Adelberger, K. L., & Steidel, C. C. 2000, ApJ, 544, 218
- Adelberger et al. (1998) Adelberger, K. L., Steidel, C. C., Giavalisco, M., Dickinson, M., Pettini, M., & Kellogg, M. 1998, ApJ, 505, 18
- Adelberger et al. (2003) Adelberger, K. L., Steidel, C. C., Shapley, A. E., & Pettini, M. 2003, ApJ, 584, 45
- Alloin, Barvainis, & Guilloteau (2000) Alloin, D., Barvainis, D., & Guilloteau, S. 2000, ApJ, 528, L81
- Andredakis et al. (1995) Andredakis, Y. C., Peletier, R. F., & Balcells, M. 1995, MNRAS, 275, 874
- Arimoto et al. (1996) Arimoto, N., Sofue, Y., & Tsujimoto, T. 1996, PASJ, 48, 275
- Arnouts et al. (1999) Arnouts, S., Cristiani, S., Moscardini, L., Matarese, S., Lucchin, F., Fontana, A., & Giallongo, E. 1999, MNRAS, 310, 540
- Baker et al. (2001) Baker, A. J., Lutz, D., Genzel, R., Tacconi, L. J., & Lehnert, M. D. 2001, A&A, 372, L37
- Barvainis et al. (1998) Barvainis, R., Alloin, D., Guilloteau, S., & Antonucci, R. 1998, ApJ, 492, L13
- Bechtold et al. (1998) Bechtold, J., Elston, R., Yee, H. K. C., Ellingson, E., & Cutri, R. M. 1998, in ASP Conf. Ser. 146, The Young Universe, ed. S. D’Odorico, A. Fontana, & E. Giallongo (San Francisco: ASP), 241
- Bechtold et al. (1997) Bechtold, J., Yee, H. K. C., Elston, R., & Ellingson, E. 1997, ApJ, 477, L29
- Becker et al. (1995) Becker, R. H., White, R. L., & Helfand, D. J. 1995, ApJ, 450, 559
- Beelen et al. (2003) Beelen, A., et al. 2003, A&A, in preparation
- Bolatto et al. (2003) Bolatto, A. D., Leroy, A., Israel, F. P., & Jackson, J. M. 2003, ApJ, 595, 167
- Bullock et al. (2002) Bullock, J. S., Wechsler, R. H., & Somerville, R. S. 2002, MNRAS, 329, 246
- Bryant & Scoville (1999) Bryant, P. M. & Scoville, N. Z. 1999, AJ, 117, 2632
- Burles & Tytler (1998) Burles, S. & Tytler, D. 1998, ApJ, 507, 732
- Chapman et al. (2000) Chapman, S. C., et al. 2000, MNRAS, 319, 318
- Chapman et al. (2002) Chapman, S. C., Shapley, A., Steidel, C., & Windhorst, R. 2002, ApJ, 572, L1
- Cole et al. (2001a) Cole, S., Lacey, C. G., Baugh, C. M., & Frenk, C. S. 2001a, MNRAS, 319, 168 (CLBF01)
- Cole et al. (2001b) Cole, S., et al. 2001b, MNRAS, 326, 255
- Condon (1992) Condon, J. J. 1992, ARA&A, 30, 575
- Conselice et al. (2000) Conselice, C. J., Gallagher, J. S., Calzetti, D., Homeier, N., & Kinney, A. 2000, AJ, 119, 79
- Dallacasa et al. (2000) Dallacasa, D., Stanghellini, C., Centonza, M., & Fanti, R. 2000, A&A, 363, 887
- De Mello et al. (2000) De Mello, D. F., Leitherer, C., & Heckman, T. M. 2000, ApJ, 530, 251
- Devereux & Young (1991) Devereux, N. A. & Young, J. S. 1991, ApJ, 371, 515
- Dickman et al. (1986) Dickman, R. L., Snell, R. L., & Schloerb, F. P. 1986, ApJ, 309, 326
- Downes et al. (1999) Downes, D., et al. 1999, A&A, 347, 809
- Downes & Solomon (1998) Downes, D. & Solomon, P. M. 1998, ApJ, 507, 615
- Downes & Solomon (2003) Downes, D. & Solomon, P. M. 2003, ApJ, 582, 37
- Downes et al. (1995) Downes, D., Solomon, P. M., & Radford, S. J. E. 1995, ApJ, 453, L65
- Dumke et al. (2001) Dumke, M., Nieten, C., Thuma, R., Wielebinski, R., & Walsh, W. 2001, A&A, 373, 853
- Edge et al. (1999) Edge, A. C., Ivison, R. J., Smail, I., Blain, A. W., & Kneib, J.–P. 1999, MNRAS, 306, 599
- Ellingson et al. (1996) Ellingson, E., Yee, H. K. C., Bechtold, J., & Elston, R. 1996, ApJ, 466, L71
- Foucaud et al. (2003) Foucaud, S., McCracken, H. J., Le Fèvre, O., Arnouts, S., Brodwin, M., Lilly, S. J., Crampton, D., & Mellier, Y. 2003, A&A, 409, 835
- Frayer et al. (1999) Frayer, D. T., et al. 1999, ApJ, 514, L13
- Frayer et al. (1998) Frayer, D. T., Ivison, R. J., Scoville, N. Z., Yun, M., Evans, A. S., Smail, I., Blain, A. W., Kneib, J.–P. 1998, ApJ, 506, L7
- Frayer et al. (1997) Frayer, D. T., Papadopoulos, P. P., Bechtold, J., Seaquist, E. R., Yee, H. K. C., & Scoville, N. Z. 1997, AJ, 113, 562
- Giavalisco & Dickinson (2001) Giavalisco, M. & Dickinson, M. 2001, ApJ, 550, 177
- Giavalisco et al. (1998) Giavalisco, M., Steidel, C. C., Adelberger, K. L., Dickinson, M. E., Pettini, M., & Kellogg, M. 1998, ApJ, 503, 543
- Guilloteau & Lucas (2000) Guilloteau, S. & Lucas, R. 2000, in Imaging at Radio Through Submillimeter Wavelengths, ed. J. G. Mangum & S. J. E. Radford (San Francisco: ASP), 299
- Guilloteau et al. (1992) Guilloteau, S., et al. 1992, A&A, 262, 624
- Guilloteau et al. (1999) Guilloteau, S., Omont, A., Cox, P., McMahon, R. G., & Petitjean, P. 1999, A&A, 349, 363
- Heckman et al. (2000) Heckman, T. M., Lehnert, M. D., Strickland, D. K., & Armus, L. 2000, ApJS, 129, 493
- Heckman et al. (1998) Heckman, T. M., Robert, C., Leitherer, C., Garnett, D. R., & van der Rydt, F. 1998, ApJ, 503, 646
- Helfer et al. (2003) Helfer, T. T., Thornley, M. D., Regan, M. W., Wong, T., Sheth, K., Vogel, S. N., Blitz, L., & Bock, D. C.–J. 2003, ApJS, 145, 259
- Howarth (1983) Howarth, I. D. 1983, MNRAS, 203, 301
- Ivison et al. (2000) Ivison, R. J., Smail, I., Barger, A. J., Kneib, J.–P., Blain, A. W., Owen, F. N., Kerr, T. H., & Cowie, L. L. 2000, MNRAS, 315, 209
- Kassiola & Kovner (1993) Kassiola, A. & Kovner, I. 1993, ApJ, 417, 450
- Kauffmann & Haehnelt (2000) Kauffmann, G. & Haehnelt, M. 2000, MNRAS, 311, 576 (KH00)
- Keeton (2001) Keeton, C. R. 2001, ApJ, submitted (astro–ph/0102340)
- Kennicutt (1998) Kennicutt, R. C., Jr. 1998, ApJ, 498, 541
- Kennicutt et al. (1994) Kennicutt, R. C., Jr., Tamblyn, P., & Congdon, C. W. 1994, ApJ, 435, 22
- Kolatt et al. (1999) Kolatt, T. S., et al. 1999, ApJ, 523, L109
- Laurent–Muehleisen et al. (1997) Laurent–Muehleisen, S. A., Kollgaard, R. I., Ryan, P. J., Feigelson, E. D., Brinkmann, W., & Siebert, J., 1997, A&AS, 122, 235
- Lehnert & Heckman (1996) Lehnert, M. D. & Heckman, T. M. 1996, ApJ, 472, 546
- Leitherer et al. (2001) Leitherer, C., Leão, J. R. S., Heckman, T. M., Lennon, D. J., Pettini, M., & Robert, C. 2001, ApJ, 550, 724
- Leitherer et al. (1999) Leitherer, C., et al. 1999, ApJS, 123, 3
- Lisenfeld et al. (1996) Lisenfeld, U., Hills, R. E., Radford, S. J. E., & Solomon, P. M. 1996, in Cold Gas at High Redshift, eds. M. N. Bremer & N. Malcolm (Dordrecht: Kluwer), 55
- Lowenthal et al. (1997) Lowenthal, J. D., et al. 1997, ApJ, 481, 673
- Madau et al. (1996) Madau, P., Ferguson, H. C., Dickinson, M. E., Giavalisco, M., Steidel, C. C., & Fruchter, A. 1996, MNRAS, 283, 1388
- Mauersberger et al. (1999) Mauersberger, R., Henkel, C., Walsh, W., & Schulz, A. 1999, A&A, 341, 256
- Meurer et al. (1999) Meurer, G. R., Heckman, T. M., & Calzetti, D. 1999, ApJ, 521, 64
- Meurer et al. (1997) Meurer, G. R., Heckman, T. M., Lehnert, M. D., Leitherer, C., & Lowenthal, J. 1997, AJ, 114, 54
- Mihos & Hernquist (1994) Mihos, J. C. & Hernquist, L. 1994, ApJ, 425, 13
- Mo et al. (1999) Mo, H. J., Mao, S., & White, S. D. M. 1999, MNRAS, 304, 175
- Moriondo et al. (1998) Moriondo, G., Giovanardi, C., & Hunt, L. K. 1998, A&A, 339, 409
- Nakanishi et al. (1997) Nakanishi, K., Ohta, K., Takeuchi, T. T., Akiyama, M., Yamada, T., & Shioya, Y. 1997, PASJ, 49, 535
- Nandra et al. (2002) Nandra, K., Mushotzky, R. F., Arnaud, K., Steidel, C. C., Adelberger, K. L., Gardner, J. P., Teplitz, H. I., & Windhorst, R. A. 2002, ApJ, 576, 625
- Neri et al. (2003) Neri, R., et al. 2003, ApJ, 597, L113
- Omont et al. (2003) Omont, A., Beelen, A., Bertoldi, F., Cox, P., Carilli, C. L., Priddey, R. S., McMahon, R. G., & Isaak, K. G. 2003, A&A, 398, 857
- Ouchi et al. (1999) Ouchi, M., Yamada, T., Kawai, H., & Ohta, K. 1999, ApJ, 517, L19
- Papovich et al. (2001) Papovich, C., Dickinson, M., & Ferguson, H. C. 2001, ApJ, 559, 620
- Peacock et al. (2000) Peacock, J. A., et al. 2000, MNRAS, 318, 535
- Pettini et al. (1998) Pettini, M., Kellogg, M., Steidel, C. C., Dickinson, M., Adelberger, K. L., & Giavalisco, M., 1998, ApJ, 508, 539
- Pettini et al. (2002) Pettini, M., Rix, S. A., Steidel, C. C., Adelberger, K. L., Hunt, M. P., & Shapley, A. E. 2002, ApJ, 569, 742
- Pettini et al. (2001) Pettini, M., Shapley, A. E., Steidel, C. C., Cuby, J.–G., Dickinson, M., Moorwood, A. F. M., Adelberger, K. L., & Giavalisco, M. 2001, ApJ, 554, 981
- Pettini et al. (2000) Pettini, M., Steidel, C. C., Adelberger, K. L., Dickinson, M., & Giavalisco, M., 2000, ApJ, 528, 96
- Porciani & Giavalisco (2002) Porciani, C. & Giavalisco, M. 2002, ApJ, 565, 24
- Rosolowsky et al. (2003) Rosolowsky, E., Plambeck, R., Engargiola. G. & Blitz, L. 2003, ApJ, in press (astro–ph/0307322)
- Salpeter (1955) Salpeter, E. E. 1955, ApJ, 121, 161
- Sawicki (2001) Sawicki, M. 2001, AJ, 121, 2405
- Sawicki & Yee (1998) Sawicki, M. & Yee, H. K. C. 1998, AJ, 115, 1329
- Schmidt (1959) Schmidt, M. 1959, ApJ, 129, 243
- Scoville & Young (1991) Scoville, N. Z. & Young, J. S. 1991, ARA&A, 29, 581
- Scoville et al. (1997) Scoville, N. Z., Yun, M. S., Windhorst, R. A., Keel, W. C., & Armus, L. 1997, ApJ, 485, L21
- Seibert et al. (2002) Seibert, M., Heckman, T. M., & Meurer, G. R. 2002, AJ, 124, 46
- Seitz et al. (1998) Seitz, S., Saglia, R. P., Bender, R., Hopp, U., Belloni, P., & Ziegler, B. 1998, MNRAS, 298, 945 (S98)
- Shapley et al. (2001) Shapley, A. E., Steidel, C. C., Adelberger, K. L., Dickinson, M., Giavalisco, M., & Pettini M. 2001, ApJ, 562, 95
- Shapley et al. (2003) Shapley, A. E., Steidel, C. C., Pettini, M., & Adelberger, K. L. 2003, ApJ, 588, 65
- Shepherd (1997) Shepherd, M. C. 1997, in Astronomical Data Analysis Software and Systems VI, eds. G. Hunt & H. E. Payne (San Francisco: ASP), 77
- Solomon & Barrett (1991) Solomon, P. M. & Barrett, J. W. 1991, in Dynamics of Galaxies and Their Molecular Cloud Distributions, ed. F. Combes & F. Casoli (Dordrecht: Kluwer), 235
- Solomon et al. (1997) Solomon, P. M., Downes, D., Radford, S. J. E., & Barrett, J. W. 1997, ApJ, 478, 144
- Somerville & Primack (1999) Somerville, R. S. & Primack, J. R. 1999, MNRAS, 310, 1087
- Somerville et al. (2001) Somerville, R. S., Primack, J. R., & Faber, S. M. 2001, MNRAS, 320, 504 (SPF01)
- Steidel et al. (1999) Steidel, C. C., Adelberger, K. L., Giavalisco, M., Dickinson, M., & Pettini, M. 1999, ApJ, 519, 1
- Steidel et al. (2003) Steidel, C. C., Adelberger, K. L., Shapley, A. E., Pettini, M., Dickinson, M., & Giavalisco, M. 2003, ApJ, 592, 728
- Steidel & Hamilton (1992) Steidel, C. C. & Hamilton, D. 1992, AJ, 104, 941
- Strong et al. (1988) Strong, A. W., et al. 1988, A&A, 207, 1
- Teplitz et al. (2002) Teplitz, H. I., Malkan, M. A., & McLean, I. S. 2002, BAAS, 201, 52.04
- Teplitz et al. (2000) Teplitz, H. I., et al. 2000, ApJ, 533, L65
- Towle et al. (1996) Towle, J. P., Feldman, P. A., & Watson, J. K. G. 1996, ApJS, 107, 747
- van der Werf et al. (2001) van der Werf, P. P., Knudsen, K. K., Labbé, I., & Franx, M. 2001, in Deep millimeter surveys: implications for galaxy formation and evolution, ed. J. D. Lowenthal & D. H. Hughes (Singapore: World Scientific Publishing), 103
- van Moorsel, Kemball, & Greisen (1996) van Moorsel, G., Kemball, A., & Greisen, E. 1996, in Astronomical Data Analysis Software and Systems V, ed. G. H. Jacoby & J. Barnes (San Francisco: ASP), 37
- Webb et al. (2003) Webb, T. M., et al. 2003, ApJ, 582, 6
- Wechsler et al. (2001) Wechsler, R. H., Somerville, R. S., Bullock, J. S., Kolatt, T. S., Primack, J. R., Blumenthal, G. R., & Dekel, A. 2001, ApJ, 554, 85
- Wilson (1995) Wilson, C. D. 1995, ApJ, 448, L97
- Wolfire et al. (1993) Wolfire, M. G., Hollenbach, D., & Tielens, A. G. G. M. 1993, ApJ, 402, 195
- Wong & Blitz (2002) Wong, T. & Blitz, L. 2002, ApJ, 569, 157
- Yee et al. (1996) Yee, H. K. C., Ellingson, E., Bechtold, J., Carlberg, R. G., & Cuillandre, J.–C. 1996, AJ, 111, 1783
- Yun & Carilli (2002) Yun, M. S. & Carilli, C. L. 2002, ApJ, 568, 88
| Source | (observed) | (J2000) | (J2000) | (J2000) | (J2000) | Reference(s) |
|---|---|---|---|---|---|---|
| phase center | — | 15:14:22.25 | — | +36:36:24.40 | — | — |
| cB58a | CO(3–2) | 15:14:22.218 | +36:36:24.79 | 1 | ||
| optical | 15:14:22.271e | +36:36:25.2e | 2, 3 | |||
| cDb | 6.1 cm | 15:14:22.47 | +36:36:20.8 | 2 | ||
| 21 cm | 15:14:22.443 | +36:36:20.68 | 4 | |||
| Sc | optical | 15:14:22.578e | +36:36:16.8e | 2, 3 | ||
| X | 3.2 mm | 15:14:22.455 | +36:36:20.90 | 1 |
| Velocitya | ||||
|---|---|---|---|---|
| Quantity | Rest feature(s) | Redshift | () | Reference |
| mean of 10 () | 0 | 1 | ||
| C III | –110 | 2 | ||
| mean of 10 () | –180 | 3 | ||
| CO(3–2) | –200 | 4 | ||
| mean of 35 () | –370 | 2 |