Enhanced production of HD and D2 molecules on small dust grains in diffuse clouds
Abstract
Motivated by recent observations of deuterated molecules in the interstellar medium, we examine the production of HD and D2 molecules on dust grain surfaces. A mechanism for the enhanced production of these deuterated molecules is studied. This mechanism applies on grain surfaces on which D atoms stick more strongly than H atoms, under conditions of low flux and within a suitable range of temperatures. It is shown that under these conditions the production rates of HD and D2 are greatly enhanced (vs. the H2 production rate) compared with the expected rates based on the adsorption of gas-phase atomic abundances of D and H. The enhancement in the formation rate of HD is comparable with the enhancement due to gas-phase ion-molecule reactions in diffuse clouds.
keywords:
ISM: molecules - molecular processes1 Introduction
The formation of molecular hydrogen on the surfaces of dust grains in the interstellar medium is a process of fundamental importance because the formation rate in the gas phase cannot account for the observed abundance (Gould & Salpeter, 1963). Once produced on grain surfaces and ejected or desorbed into the gas, hydrogen molecules are a necessary component in the initiation of gas-phase chemical reaction networks that give rise to the chemical complexity observed in interstellar clouds. The formation of molecular hydrogen has been studied both theoretically (Hollenbach & Salpeter, 1970, 1971; Hollenbach et al., 1971; Williams, 1968; Smoluchowski, 1981, 1983; , 1985; Duley & Williams, 1986; Pirronello & Avera, 1988; Sandford & Allamandola, 1993; Takahashi et al., 1999) and experimentally (Brackmann, 1961; Schutte et al., 1976; Pirronello et al., 1997a, b, 1999; Manico et al., 2001). Although formation of H2 is clearly the most studied surface reaction pertaining to interstellar clouds, there are many other reactions that are thought to take place, for the most part involving H atoms and other species. Reactions are typically considered to occur via the Langmuir-Hinshelwood mechanism, in which weakly-bound surface species diffuse towards one another. Some authors have considered different mechanisms, where chemisorption plays a role (Cazaux & Tielens, 2002).
The computational modeling of diffusive chemical reactions on dust grains in the interstellar medium is typically done using rate equation models (Pickles & Williams, 1977; d’Hendecourt et al., 1985; Brown, 1990; Brown & Charnley, 1990; Hasegawa et al., 1992; Hasegawa & Herbst, 1993a, b; Caselli et al., 1993; Willacy & Williams, 1993; Shalabiea & Greenberg, 1994). As long as a sizable number of reactive species exists on a grain surface, the rate equation results are valid. However, in the limit of small average surface populations () of reactive species, rate equations are not always suitable, because they take into account only average densities and ignore the fluctuations as well as the discrete nature of the populations of the atomic and molecular species (Tielens, 1995; Tielens & Hagen, 1982; Charnley et al., 1997; Caselli et al., 1998; Shalabiea et al., 1998; Stantcheva et al., 2001, 2002). Depending on the parameters chosen, this limit can pertain mainly to small grains or can even to “classical” grains, namely grains of 0.1 radius. For example, as the number of H atoms, , on a grain fluctuates in the range of 0, 1 or 2, the H2 formation rate cannot be obtained from the average number alone. This can be easily understood, since recombination requires at least two H atoms simultaneously on the surface.
Recently, a master equation approach was proposed that is suitable for the simulation of diffusive chemical reactions on interstellar grains in the accretion limit (, 2001, 2001; Biham & Lipshtat, 2002). The master equation takes into account both the discrete nature of the reactive species as well as the fluctuations in their populations. (2001) considered a simple system in which H and O atoms land on classical grains to produce H2, OH, and O2. Biham and co-workers focused on the formation of H2. With a slow diffusion rate for H based on the analysis by Katz et al. (1999) of experimental work by Pirronello, Vidali, & co-workers (Pirronello et al., 1997a, b), they found the master equation approach to be needed mainly for small grains. For the formation of H2, the dynamical variables are the probabilities that there are atoms on the grain at time . The time derivatives , are expressed in terms of the adsorption, reaction and desorption terms. The master equation provides the time evolution of , , from which the recombination rate can be calculated. The master equation has also been used for the study of reaction networks involving multiple species (Stantcheva et al., 2002; Stantcheva & Herbst, 2003).
In addition to the master equation method, a Monte Carlo method (Tielens & Hagen, 1982) was proposed (Charnley, 2001), and applied to surface reaction networks involving multiple species (Caselli et al., 2002; Stantcheva & Herbst, 2003). The weakness of the Monte Carlo approach to surface chemistry is that it cannot be used easily for models in which gas-phase reactions take place simultaneously. Finally, a semi-empirical approach, known as the modified rate method, was proposed by Caselli et al. (1998). Although artificial, the modified rate method is easy to employ and has been used with mixed success (Stantcheva et al., 2001; Caselli et al., 2002).
In addition to H, which is the most abundant atom in the universe, there is a density of D atoms, which is smaller by a factor of about compared with the density of H atoms in regions where the gas is primarily atomic. If deuterated hydrogen molecules, namely HD and D2, are formed on grain surfaces in the same way as H2, these molecules are expected to be rare due to the low abundance of D atoms. Of course, some differences between the formation rates of HD and D2 and that of H2 are expected because of the possibly different diffusion and desorption rates of H and D atoms on the surface. It was realized early in the study of interstellar chemistry, however, that the formation of HD in diffuse interstellar clouds occurs more efficiently in the gas phase via the sequence of reactions
| (1) |
which can lead to enhancements of over surface formation (Watson, 1973; Dalgarno et al., 1973) and explain the observed HD/H2 abundance ratio in diffuse clouds. By the stage in which dense interstellar clouds have been formed, HD has become the major repository of deuterium, and is the starting point for a rich chemistry of deuterium fractionation that occurs in the gas phase via ion-molecule reactions (Watson, 1973; Millar et al., 1989; Charnley et al., 1997; Roberts & Millar, 2000a, b; Rodgers & Charnley, 2001; Roberts et al., 2002). Since gas-phase fractionation produces a large D/H atomic abundance ratio in dense clouds, it then becomes possible that surface processes can produce multiply deuterated species in high abundance following the adsorption of D atoms (Charnley et al., 1997; Rodgers & Charnley, 2001; Caselli et al., 2002; Stantcheva & Herbst, 2003).
Although it has been thought for some time that the formation of HD in diffuse clouds occurs primarily in the gas, the surface processes for the formation of HD and D2 have not been looked at carefully. In this paper we propose a mechanism taking place on the surfaces of dust grains that, under certain conditions, can provide a significantly enhanced production of deuterated molecules. We demonstrate the mechanism for the simple case that involves only H and D atoms in diffuse clouds, and examine the formation rates of HD and D2 vs. that of H2. The mechanism is based on the assumption that D atoms stick to the surface more strongly than H atoms so that their desorption rate is lower. An isotope effect of this type has been observed in various experimental situations (Koehler et al., 1988; Hoogers et al., 1995).
Due to the very low cosmic abundance ratio of D vs. H () most of the atoms that hit the grain surfaces in diffuse clouds are H atoms. However, the residence time of D atoms on grains is expected to be longer than that of H atoms, due to their lower desorption rate. Thus, the D/H atomic abundance ratio on the grains is enhanced compared with the gas-phase ratio. As a result, newly adsorbed H (or D) atoms are more likely to find D atoms already residing on the grains, giving rise to an enhanced production of HD molecules. This enhancement turns out to be even larger on very small grains on which only a handful of H and D atoms typically reside. This effect is expected to be significant in diffuse clouds, where the density of the gas phase is low and the grain size distribution is broad and dominated by very small grains (Li & Draine, 2001).
The paper is organized as follows. The interaction between hydrogen atoms and dust grains in interstellar clouds in described in Sec. 2. The formation of molecular hydrogen on large grains is described in Sec. 3 using the rate equation model. The formation of molecules on small grains is presented in Sec. 4 using the master equation approach, followed by an asymptotic analysis for very small grains in Sec. 5. The simulations and results are presented in Sec. 6. The results are discussed in Sec. 7 and summarised in Sec. 8. In Appendix A we consider the relevance of the isotope effect studied here to related experiments.
2 The interaction between hydrogen atoms and dust grains
Consider a diffuse interstellar cloud dominated by a density (cm-3) of H atoms and also including a density of D atoms, where is the DH abundance ratio (the cosmic ratio is approximately ). The typical velocity of the hydrogen isotope I (H or D) in the gas phase is denoted by (cm s-1). It is given by
| (2) |
where the mass is (grams) for H atoms and (grams) for D atoms and the temperature of the gas is denoted by . The cloud includes a density (cm-3) of dust grains. To evaluate the flux of atoms onto grain surfaces we will assume, for simplicity, that the grains are spherical with a radius (cm). The cross section of a grain is and its surface area is . The number of adsorption sites on a grain is denoted by , and their density (sites cm-2) on the surface is given by . The fluxes (atoms s-1) and of H and D atoms onto the surface of a single grain are given by . The atoms stick to the surface and hop as random walkers between adjacent sites until they either desorb as atoms or recombine into molecules. The desorption rates of H and D atoms on the surface are given by
| (3) |
where is the attempt rate (typically assumed to be s-1), is the energy needed for desorption of an atom of isotope I and is the surface temperature. The hopping rates of the atoms from site to site are
| (4) |
where is the activation energy barrier for diffusion of the isotope I. Here we assume that diffusion occurs only by thermal hopping, in agreement with recent experimental results (Katz et al., 1999). In the faster diffusion rates often adopted by astrochemists, tunneling is allowed to occur (Hasegawa et al., 1992) and results in very different rates for H and D. The rate is approximately the inverse of the time required for an atom of isotope I to visit nearly all the adsorption sites on the grain surface, because in two dimensions the number of distinct sites visited by a random walker is linearly proportional to the number of steps, up to a logarithmic correction (Montroll & Weiss, 1965).
In this paper, we take the density of adsorption sites on the surface as (sites cm-2) (, 2001). The density of H atoms is (cm-3) and the density of D atoms is , where is the cosmic abundance ratio, which according to Eq. (2) gives rise to to the ratio . The gas temperature is taken as K, thus and (cm s-1). The surface temperature is K, although variations from this value are considered. These values are within the range of typical parameters for diffuse interstellar clouds.
The parameters used for the interaction between the adsorbed H and D atoms and the grain are crucial to the determination of the isotope effect. Since D is heavier than H, it sits lower than H in any potential surface when zero-point energy is included. The smaller zero-point energy of D leads to larger values for the desorption energy and the barrier against diffusion, although the differences between H and D are uncertain. In the analysis of their experimental results, for example, Katz et al. (1999) assumed no difference between H and D atoms at all. In a previous paper, Caselli et al. (2002) argued for a difference of 2 meV between both the desorption energies and barriers against diffusion. Here, the adopted energy barriers for diffusion are meV for H atoms and meV for D atoms, while the desorption energies are meV for H atoms and meV for D atoms. The values for H atoms are intermediate between those obtained experimentally on olivine and amorphous carbon surfaces (Katz et al., 1999). The difference between the desorption energies is assumed to be 10 meV; an argument in favour of this larger value is that the barrier against diffusion balances the zero-point energy of a potential well with that of a saddle point while desorption does not possess a saddle point. In any case, the difference in desorption energies between H and D is crucial to the isotope effect discussed here.
3 Molecular hydrogen formation on large grains
After being adsorbed onto the surface, the H and D atoms hop between adsorption sites until they either desorb or meet one another and form molecules. The number of atoms of isotope I on the surface of a grain is denoted by . The rate equation analysis deals with the expectation values , I H, D obtained by averaging over a large ensemble of identical grains under given physical conditions. The rate equations for the expectation values of the H and D populations take the form
| (5) |
These equations provide the time derivatives of the sizes of the populations of reactive species. Each equation includes a flux term, a desorption term and two reaction terms. The first reaction term accounts for reactions between atoms of the same specie, while the second reaction term accounts for the reaction that produces HD molecules. The rate of the latter reaction is proportional to the rate at which H and D atoms encounter each other, which is proportional to the sum of the hopping rates of the two species. Therefore, the pre-factor of this term is the sum of and . By integration of the rate equations for a given initial condition one obtains the time dependence of the population sizes. The rate equations provide a good description of the surface reactions with our chosen parameters as long as the grain is not too small and the flux is not too low. The rate equations are strictly valid when both the D and H populations per grain are greater than unity. However, we have found that, despite a very small D population in even our largest grains, as long as the H population per grain is not too much smaller than unity, the rate equations provide a reasonable approximation to the master equation results.
We will now solve the rate equations for the case of steady state conditions, in which for I H, D. Due to the small ratio between the fluxes of and atoms, the effect of the D atoms on the density can be neglected. Thus, neglecting the HD formation term in the first equation in (5) we obtain
| (6) |
Inserting this solution into the second equation in (5) we obtain
| (7) |
where
| (8) |
is the effective desorption coefficient for the D atoms. The ratio between the population sizes of D and H on the grain surface is obtained from Eqs. (6) and (7). This ratio turns out to be higher than the gas phase ratio due to the lower desorption rate of D atoms. The production rate of HD molecules per grain is
| (9) |
and of molecules is
| (10) |
The ratio between these production rates is thus
| (11) |
Due to the assumption that , namely that the diffusion of H atoms is faster than of D atoms, we obtain that the additional enhancement factor multiplying is in the range . The production rate of D2 molecules is
| (12) |
and the ratio between the D2 and H2 production rates is
| (13) |
4 Molecular hydrogen formation on small grains
The master equation that describes the hydrogen-deuterium system consists of a two-dimensional matrix of equations. These equations describe the time derivatives of the probabilities of having hydrogen atoms and deuterium atoms simultaneously on the surface. The master equation takes the form
where . Each of these equations includes three sets of terms. The first set describes the effect of the incoming fluxes and on the probabilities. The probability increases when an H atom sticks to the surface of a grain that already has adsorbed H atoms and adsorbed D atoms. There is a similar term for the adsorption of a D atom. The probability decreases when a new atom is adsorbed on a grain with H atoms and D atoms that are already adsorbed. The second set of terms describes the effect of desorption. An H [D] atom that is desorbed from a grain on which there are adsorbed H atoms and adsorbed D atoms decreases the probability and increases the probability []. The third set includes three terms describing the reactions that lead to the formation of H2, D2 and HD, respectively. The rate of each of these reactions is proportional to the sum of the sweeping rates of the atoms involved ( or ) times the number of pairs of atoms that may participate in the reaction. In the equations in which or , some of the terms vanish. These terms can be easily identified since their initial or final states include a negative number of H or D atoms on the grain.
By suitable summation over the probabilities, the master equation provides the moments of the population size distribution, given by
| (15) |
where [note that in case that () the corresponding power, (), is removed from the equation]. The order of each moment is specified by the sum of these powers, namely by . Clearly, there are two first-order moments, and , three second-order moments, , and , as well as moments of any higher order . The average rates of production of the H2, HD and D2 molecules on the surface of a single grain can be obtained by a proper summation over the third set of terms in the master equation (4). These production rates can be expressed in terms of the first and second moments of the population size distribution (, 2001; Stantcheva et al., 2001, 2002):
| (16) |
The fact that the production rates depend on the second moments explains the failure of the rate equations in the limit in which the average surface populations of reactive species become . In the rate equations, which account only for the first moments, second moments are approximated by products of the corresponding first moments. The equations fail to account for the production rates when this approximation is no longer valid.
The production rates given by Eqs. (16) can be obtained by direct integration of the master equation (4) as a set of time dependent coupled differential equations, using a standard Runge-Kutta stepper. In this paper we focus on the production rates under steady state conditions. Therefore, the data collection is done only after the populations of the reactive species have reached their asymptotic sizes under the simulated conditions. In order to limit the number of equations, suitable cutoffs are imposed, either on the population size of each reactive specie or on the entire population of adsorbed atoms on the grain surface (Stantcheva et al., 2001). The production rates can also be obtained from Monte Carlo simulations, based on the master equation (Charnley, 2001).
5 The limit of very small grains
In the limit of very small grains, one can reach the situation in which both and . In this limit the formation rate of molecules is reduced and the dominant mechanism for removing atoms from the surface is thermal desorption. The formation of molecules can then be considered as a perturbation on top of the adsorption and desorption processes. This limit can be described by the master equation using cutoffs that do not allow more than a single atom on the grain. The master equation then consists of only three coupled equations, for , and . With these cutoffs, the average population sizes are related to the probabilities by
| (17) |
Solving the three coupled equations for steady state conditions we obtain that
| (18) |
Consider the situation in which there is one atom on the surface of a grain. Since the grain is very small an atom can easily scan the whole surface before it desorbs, namely . Thus, when a second atom is adsorbed, it is most likely to form a molecule with the atom that is already on the surface. Therefore, the production rate does not depend on the diffusion rates, a point noted by Tielens & Hagen (1982) and subsequently used to define the term “accretion” limit rigorously, as distinguished from the “reaction” limit. In the former limit, the production rates are given by the flux terms of H and D atoms in the master equation, multiplied by the probabilities of having a single atom (either H or D) on the surface, namely, and , where I H, D. Using Eqs. (17), the production rates of molecules take the form
| (19) |
The HD molecule can form in two channels: an H atom on the surface reacts with a newly adsorbed D atom, or a D atom on the surface reacts with a newly adsorbed H atom. Due to the longer residence time of a D atom on the surface, the second channel is dominant. Therefore, the production ratio is approximately equal to the ratio between the population sizes on the surface. This amounts to an enhancement of the HD production by a factor of compared to the flux ratio, namely
| (20) |
The production rate of HD is thus enhanced with respect to that of H2 by a factor given by the ratio of the desorption rates of H and D atoms. Since the desorption rates depend exponentially on the activation energy barriers for desorption and , a small difference between these barriers can produce a large enhancement in HD production. The enhancement in D2 production is given by
| (21) |
giving rise to a similar enhancement compared to the expected production rate based on the ratio between the fluxes of D and H.
6 Simulations and results
To evaluate the production rates of H2, HD and D2 molecules we have used the master equation approach given by Eq. (4). The results presented in this paper were obtained by direct numerical integration of the set of differential equations until they reached steady state conditions. For a range of very small grains, namely , we also performed kinetic Monte Carlo simulations based on the master equation, and found perfect agreement between the two methods.
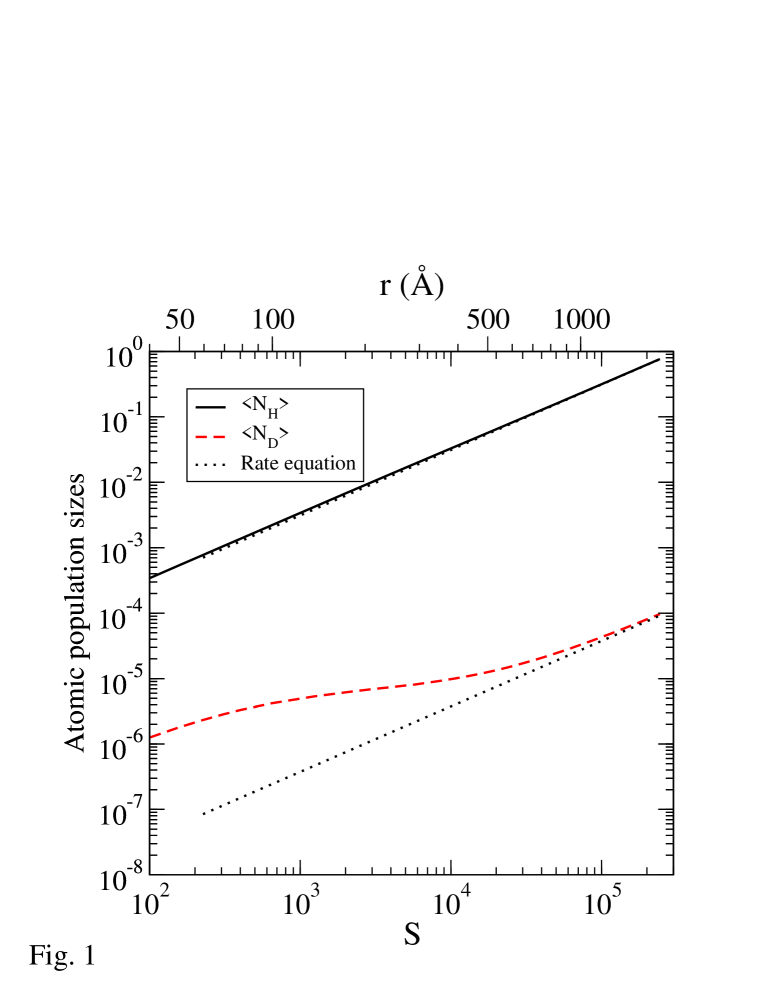
In Fig. 1 we show the average population sizes of the atomic species on the grain surface, (solid line) and (dashed line), as a function of the number of adsorption sites, , and grain radius, , under steady state conditions. The results are presented for a range of small grains on which the average number of H atoms is smaller than one while the average number of D atoms is of the order of and less. Under these conditions the master equation is required in order to evaluate the production rates correctly, although the rate equations (dotted lines) are progressively better as the size of the grain increases. Specifically, one can see that the rate equation approach appears to handle the average hydrogen abundance well for all grain sizes, while becoming much worse for the average deuterium abundance at small grain sizes. One should note that the actual production rate of molecules does not depend on and only [see Eq. (16)], so one cannot argue about the suitability of the rate equation method for the determination of production rates based on the results shown in Fig. 1.
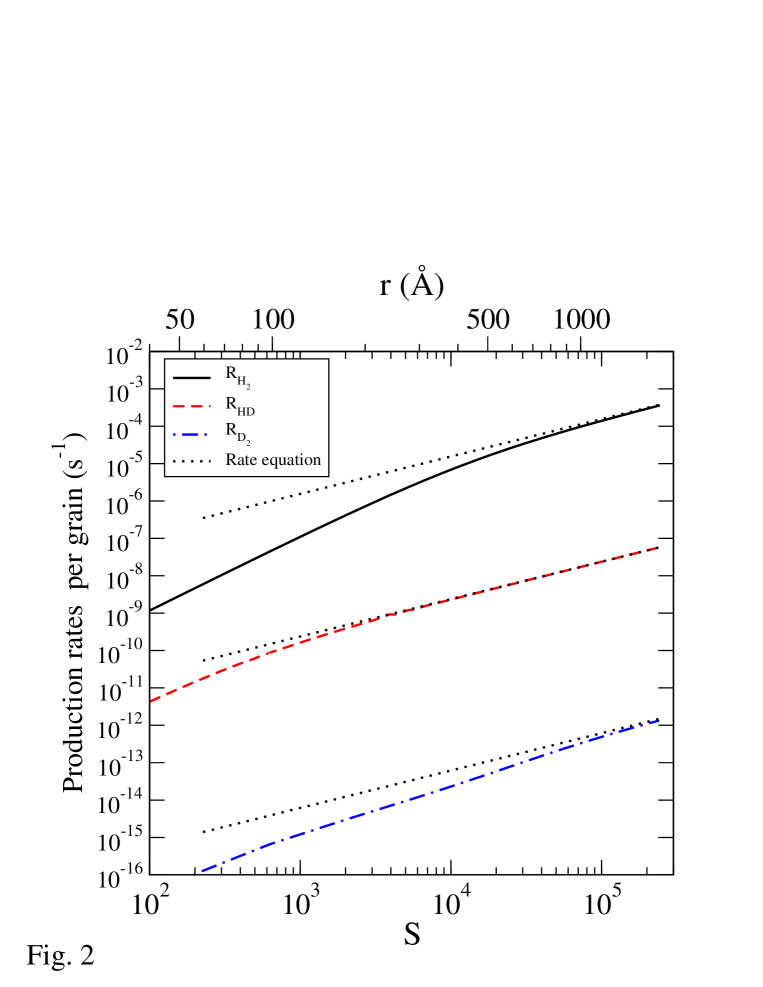
The production rates of H2, HD and D2, molecules per grain vs. and are shown in Fig. 2. Clearly, the production rates decrease as is reduced. For large grains that support sizable populations of H and D, and can be described by rate equations, the production rates per grain are proportional to the surface area, namely linear in . In the limit of diminishing grain sizes, the production rates become quadratic in , as can be seen by substitution of and into Eq. (19), which leads to a quadratic dependence on flux. The range of grain sizes presented in the simulation results reaches both the limit of large grains and the limit of small grains, covering the intermediate range between these two limits.
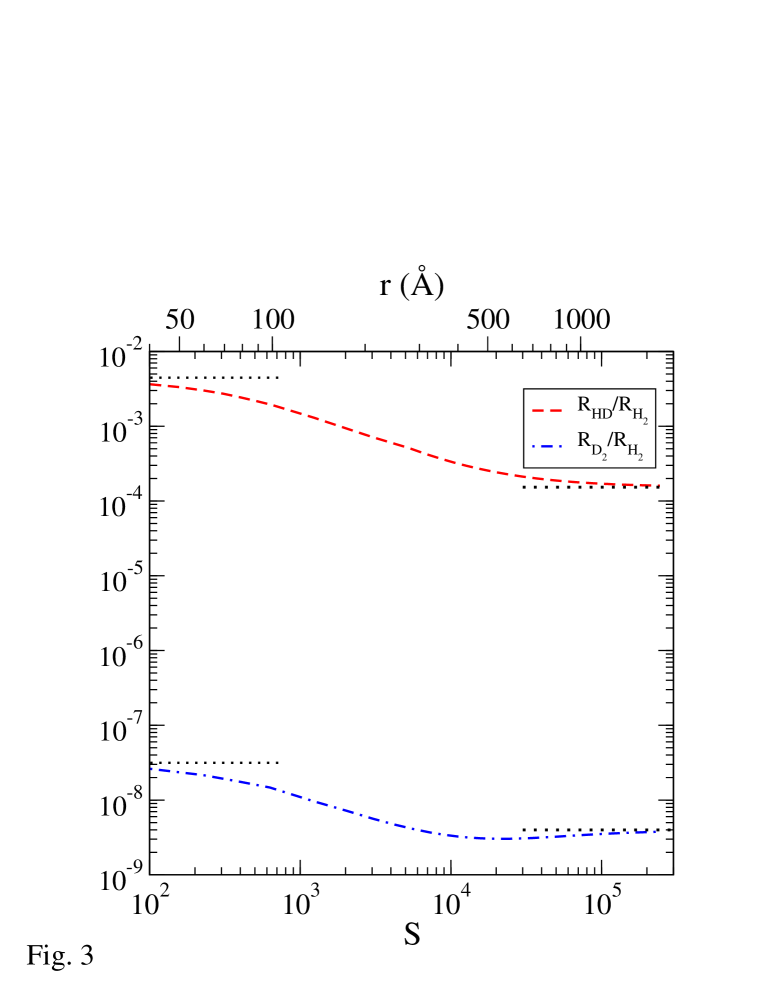
In order to quantify the relative enhancement in the formation rate of deuterated molecules vs. H2 we present in Fig. 3 the ratios and vs. and . It is observed that as decreases these production ratios increase by over a factor of 20. In the limit of large grains, the production ratio converges towards the results of the rate equations (dotted line on right-hand side). In the limit of very small grains it converges towards the results of the asymptotic analysis presented in Sec. 5 (dotted line on left-hand side).
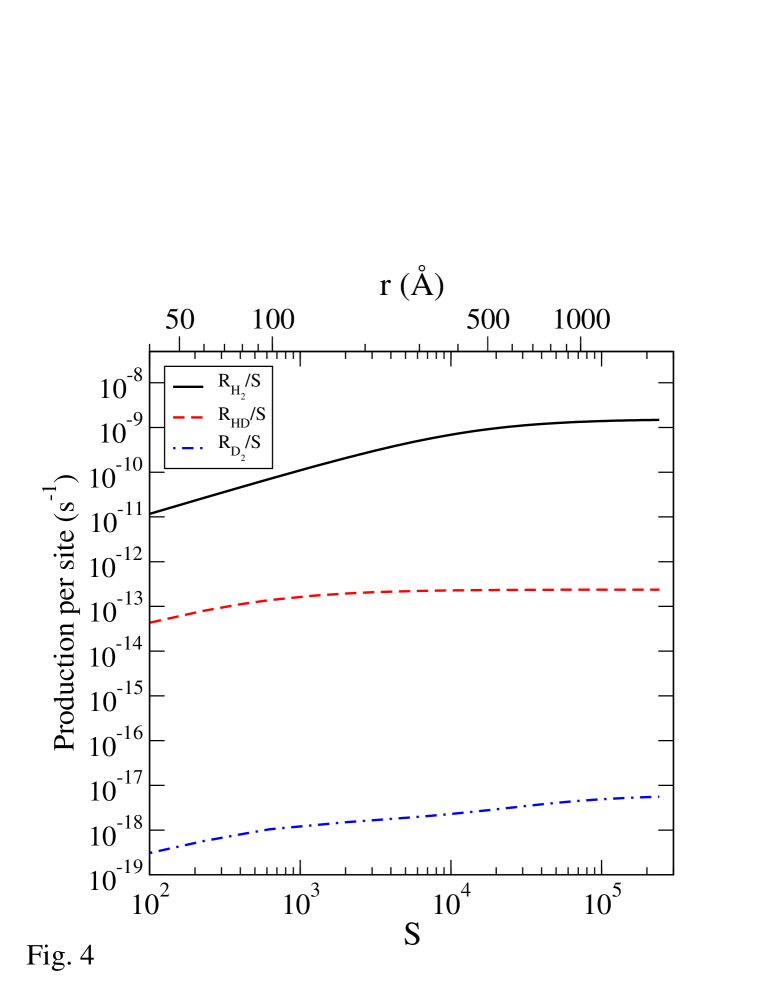
To examine the dependence of the efficiency of the molecular formation on the grain size we show in Fig. 4 the production rates per site of H2, HD and D2 on the grain as a function of and . In the limit of large grains this quantity saturates and does not depend on the grain size. However, as the grain size decreases, the production rate per site goes down. The production rate of H2 is reduced more quickly than that of the deuterated species. This gives rise to an enhancement in the relative production rate of HD and D2 vs. H2.
To account for the production rate of molecular hydrogen in interstellar clouds one should integrate over the entire distribution of grain sizes in the cloud (Mathis et al., 1977; Mathis, 1990, 1996; Draine & Lee, 1984; Draine & Anderson, 1985). Consider a cloud in which the grain size distribution is given by (cm-4) in the range , where and are the lower and upper cutoffs of the distribution [here (cm-3) is the number density of grains of sizes in the range (r,r+dr)]. The formation rates , and , (cm-3 s-1 ) in the cloud are given by
| (22) |
| (23) |
and
| (24) |
respectively, where , and are the production rates per grain for grains of radius .
Observations support the assumption that the grain size distribution takes the power-law form (Mathis et al., 1977; Weingartner, 2001)
| (25) |
in a range of sizes , where
| (26) |
and (cm-3) is the total density of grains, integrated over the whole range of grain sizes. To exemplify the role of the grain size distribution we analyze the case in which . This distribution has the special property that the mass of grains in the cloud is equally distributed within the range of grain sizes. The total surface area of all grains is distributed such that grains in the size range between have a total surface area proportional to . As a result, most of the surface area belongs to grains in the lower end of the size distribution. In the analysis we chose cm and cm. The parameter is chosen such that the density of large grains, of radii in the range cm, is . Integrating the grain size distribution over the entire range we obtain . The minimum grain size is chosen to be larger than PAH molecules so that the problem of stochastic heating and desorption by photons does not dominate normal thermal evaporation. According to the calculations of Draine & Li (2001) and Li & Draine (2001), however, grains of our minimum size may experience stochastic heating of temperatures up to 40 K at time intervals ( s-1) somewhat shorter than the D evaporation time at the grain temperature chosen. Such heating would effectively shorten the grain lifetime of D atoms and reduce the isotope effect. The time scale between heating events could be lengthened by extinction in the cloud.
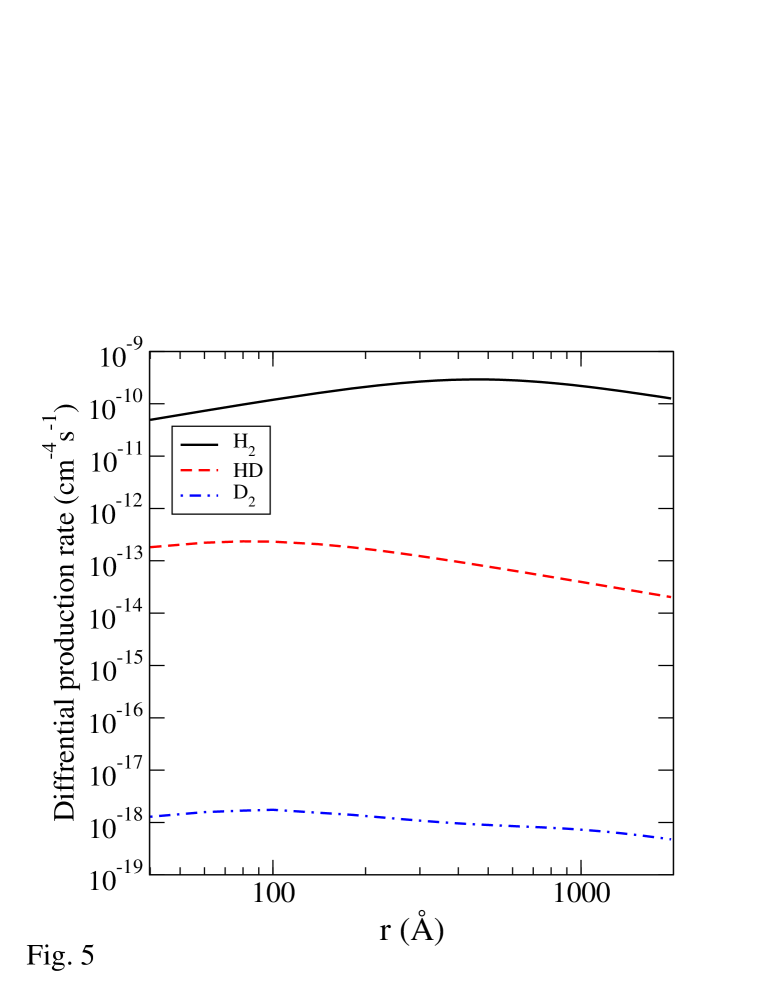
To examine the contribution of grains of different sizes to the total production rates of H2, HD and D2 we show in Fig. 5 the differential production rates given by the integrands of Eqs. (22) and (23) as a function of the grain radius . Two competing effects play a role in this process. The production efficiency of molecules on the grain decreases as the grain size is decreased. However, small grains account for most of the surface area and thus provide a large fraction of the molecules that are produced. The relative enhancement in the production of deuterated species arises because their production efficiency decreases more slowly than that of H2 as the grain size is reduced.
Integrating over the range of grain sizes we obtain that the production rates are cm-3 s-1, cm-3 s-1 and cm-3 s-1. Therefore, the ratio () is larger by about a factor of () than the expected value based on the ratio of the incoming fluxes, namely . Observations indicate that the exponent in Eq. (25) is (Weingartner, 2001). Therefore, the contribution of very small grains may be even more dominant, leading to a larger enhancement in the formation of HD and D2 vs. H2 than in the analysis shown here.
We will now compare our results with the standard rate law used for the production of molecular hydrogen in diffuse regions. This rate law assumes that all the grains are of radius cm and that their density is equal to . It is also assumed that the efficiency is , namely, all the atoms that collide with grains end up in molecules. Under these assumptions the production rate of H2 molecules is given by cm-3 s-1 (Hollenbach et al., 1971), or more conveniently, by
| (27) |
where is the density of H atoms and is the total density of H nuclei in all forms (although we assume here that all the hydrogen in the gas is in the atomic form, namely ). The parameter (cm3 s-1) is the effective rate coefficient given by
| (28) |
For the conditions considered here, cm3 s-1 and cm-3 s-1. This result is about an order of magnitude higher than our result, which is consistent with cm3 s-1. The reason for this apparent discrepancy is the low production efficiency of H2 molecules under these conditions, which on large grains is (given by the rate equations) and is even lower for small grains. The production rate of HD molecules (cm-3 s-1) can be expressed in a similar way, by
| (29) |
where (cm3 s-1) is the effective rate coefficient for this reaction. The values of the rate coefficients and under the conditions studied here, are shown in Table 1, for and and for several grain temperatures between 12 and 20 K.
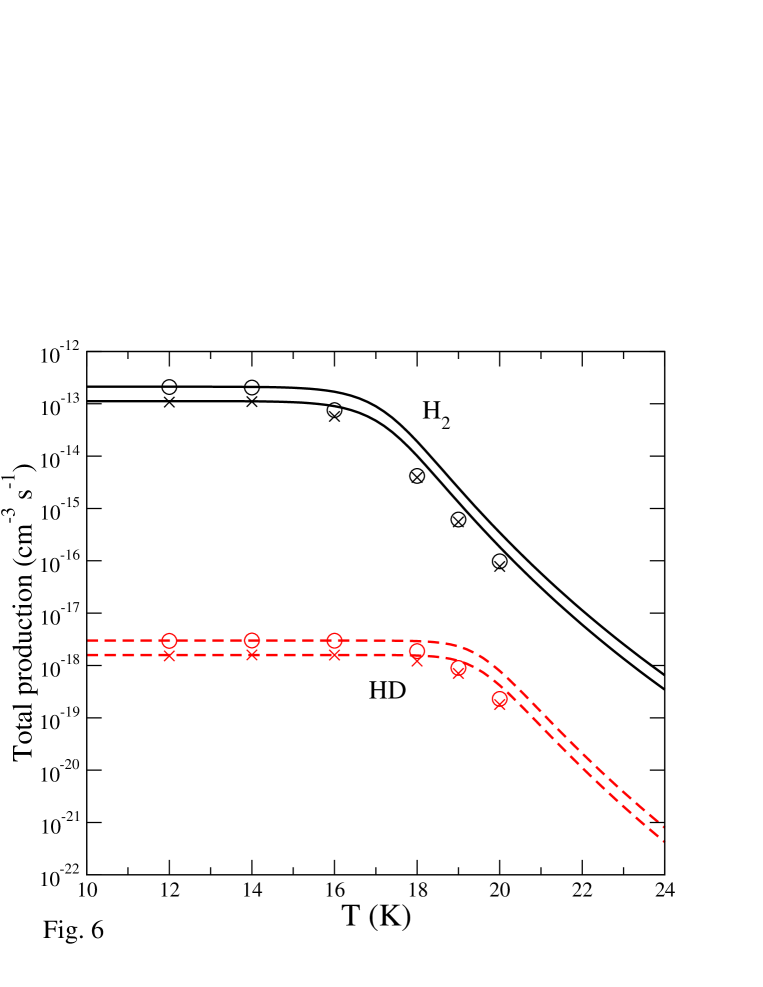
In Fig. 6 we present the temperature dependence of the production rates of H2 and HD molecules. The production rates , obtained from the rate equations, are shown by the solid lines for the case that the exponent of the grain size distribution is (upper solid line) and for (lower solid line). The master equation results for these two cases are also shown (by and , respectively). The production rates , obtained from the rate equations, are shown by the dashed lines, for (upper dashed line) and for (lower dashed line). The master equation results are also shown (by and , respectively). These graphs provide much insight on the enhancement of HD production. They show that for grain temperatures lower than about 16 K, the production efficiency is and the rate coefficient is consistent with Eq. (28). At this temperature range there is no enhancement in the production of HD molecules. The enhancement appears in a range of temperatures, roughly between 16 K and 20 K, where the H2 production rate quickly decreases as increases while the HD production rate remains steady. Above 20 K the production rates of both H2 and HD are diminished.
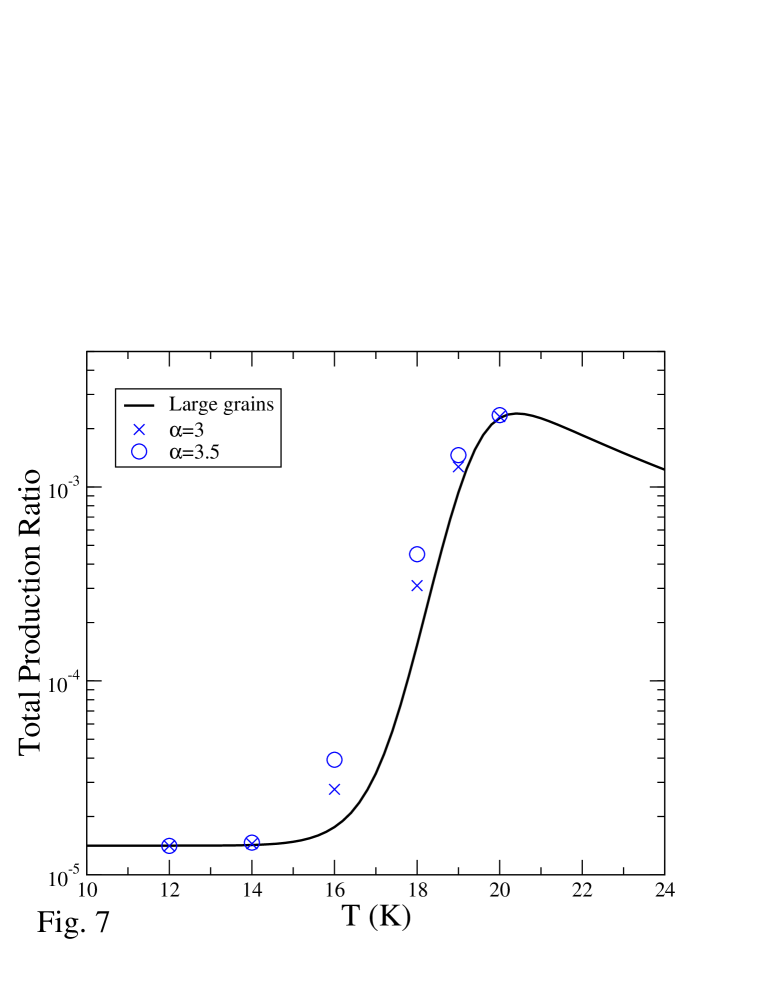
In Fig. 7 we present the ratio, , of the production rates of HD and H2 molecules as a function of the grain temperature, as obtained from the rate equations (solid line), and the master equation for () and (). The enhancement ratio increases sharply as the temperature is raised above 16 K and reaches a peak around 20 K. A significant enhancement is observed on large grains, for which the rate equation results apply. When the grain size distribution is taken into account, further enhancement is obtained due to the contribution of the small grains, on which the enhancement ratio is even larger.
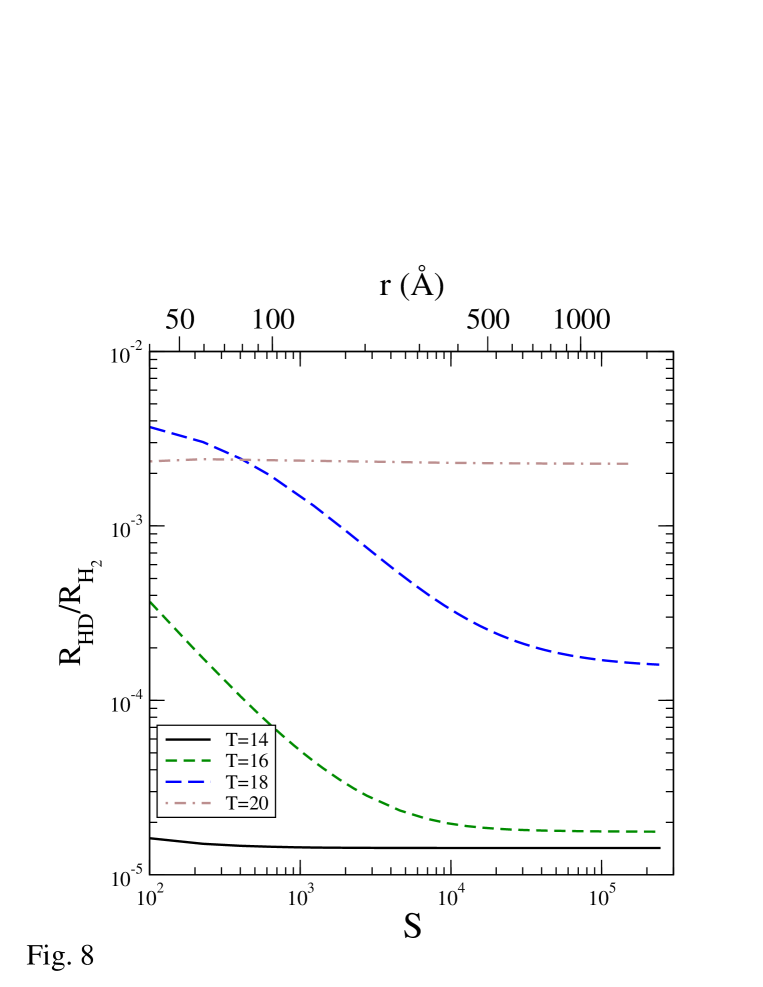
The dependence of the ratio of the production rates on the grain size and radius is shown in Fig. 8 for several grain temperatures. At 14 K there is no significant enhancement for any grain size. At 16 and 18 K the enhancement strongly depends on the grain size and increases sharply as the grain size decreases. At 20 K there is a large enhancement for grains of all sizes. However, at this temperature the total production of both H2 and HD is very small, thus making little contribution to the gas phase abundances.
7 Discussion
In this paper we have used a simple description of the grains as spherical objects. In practice the grains are expected to be amorphous with rough surfaces and may include pores. These features may increase the surface area of the grain and introduce a distribution of diffusion and desorption barriers. However, no solid data are available to quantify such effects. Moreover, the analysis of experimental results on molecular hydrogen production on olivine and amorphous carbon surfaces (Pirronello et al., 1997a, b, 1999) did not require more than one energy barrier for each process (Katz et al., 1999).
The analysis presented in this paper is restricted to the case in which the mobility of adsorbed atoms on the surface is due to thermal hopping. Tunneling of H and D atoms on the surface is not included since experimental results indicate that tunneling does not play a significant role in the formation of molecular hydrogen under astrophysically relevant conditions (Pirronello et al., 1997a, b, 1999). In a recent analysis of the results of these experiments, chemisorption processes were taken into account (Cazaux & Tielens, 2002). The study of chemisorption processes is motivated by observations of molecular hydrogen in photon-dominated regions in which the typical grain temperature is around 40 K, making the production of H2 molecules by physisorbed H atoms hopelessly inefficient.
The mechanism presented here for an enhanced production of HD and D2 molecules, vs. H2, takes place in a window of grain temperatures. For the surface parameters used here this temperature window is between 16 - 20 K. In this temperature range the production efficiency of H2 is reduced, while the efficiency of HD and D2 production remains steady. The effect is observed for grains of all sizes, but the relative enhancement is larger on small grains. It will be interesting to see if the enhancement plays a significant role in chemical models of diffuse and translucent clouds; relevant model calculations are planned by Le Petit and Roueff (private communication).
8 Summary
The formation of H2, HD and D2 molecules on dust grain surfaces was studied using the master equation approach. The production of these molecules was assumed to occur via the Langmuir-Hinshelwood (diffusive) mechanism. It was shown that for surface temperatures in excess of 15 K, the fractions of HD and D2 molecules in the population of hydrogen molecules that are produced are significantly enhanced compared with their expected ratio based on the gas phase abundances. The enhancement takes place on grains of all sizes, but is largest on the smallest grains considered until the temperature reaches 20 K. It arises because of the assumption that D atoms are bound slightly more strongly to grains than are H atoms. At a surface temperature of 18 K, with binding energies and rates of diffusion based on laboratory experiments, the enhancement is found to be a factor of 44.1 (78.3) for the production of HD (D2)with the assumption that the grain size distribution goes as . Although the enhancement is even larger at higher temperatures, the absolute rates of production for H2 and its isotopomers become too small to be of importance. Use of the master equation method can lead to somewhat greater enhancements (factor of a few) than the simple rate equation method.
While gas-phase mechanisms (Watson, 1973) may account for the observed abundance of HD, it is possible that surface mechanisms such as the one presented here also play a role in the production of deuterated molecules. Recent observations have uncovered a variety of multiply deuterated molecular species in the interstellar medium such as D2CO and ND3 (Ceccarelli et al., 2002; van der Tak et al., 2002). Gas phase reaction networks that lead to the formation of such multiply deuterated species have been studied and their efficiency examined (Charnley et al., 1997; Rodgers & Charnley, 2001; Roberts et al., 2002, 2003). The picture in pre-stellar cores is that gas-phase fractionation can explain much of what is observed, but the picture in protostellar cores, where grain mantles tend to be evaporated back into the gas, is that surface reactions play an important role in the fractionation leading to multi-deuterated species (Stantcheva et al., 2002). It will be interesting to see if the surface mechanism presented here may be extended to produce multiply deuterated species. Preliminary work on this matter has been undertaken by Caselli et al. (2002) and Stantcheva & Herbst (2003).
9 acknowledgments
This work was supported by the Adler Foundation for Space Research of the Israel Science Foundation. E. H. wishes to thank the National Science Foundation (U. S.) for support of his research programme in astrochemistry.
References
- (1) Aronowitz S., Chang S.B., 1985, ApJ. 293, 243
- (2) Biham O., Furman I., Pirronello, V., Vidali G., 2001, ApJ. 553, 595
- Biham & Lipshtat (2002) Biham O., Lipshtat A., 2002, Phys. Rev. E, 66, 056103
- Brackmann (1961) Brackmann R.T. , Fite, W. L., 1961, J. Chem Phys., 34, 1572
- Brown (1990) Brown P.D., 1990, MNRAS, 243, 65
- Brown & Charnley (1990) Brown P.D., Charnley S.B., 1990, MNRAS, 244, 432
- Caselli et al. (1993) Caselli, P., Hasegawa T.I., Herbst E., 1993, ApJ, 408, 548
- Caselli et al. (1998) Caselli, P., Hasegawa, T.I., & Herbst, E. 1998, ApJ, 495, 309
- Caselli et al. (2002) Caselli P., Stantcheva T., Shalbiea O., Shematovich V. I., Herbst E., 2002, Plan. Sp. Sci., 50, 1257
- Cazaux & Tielens (2002) Cazaux S., Tielens A. G. G. M., 2002, ApJ, 575, L29
- Ceccarelli et al. (2002) Ceccarelli C., et al., 2002, A&A, 381, L17
- Charnley (2001) Charnley S.B., 2001, ApJ, 562, L99
- Charnley et al. (1997) Charnley S.B., Tielens A.G.G.M., Rodgers S.D., 1997, ApJ, 482, L203
- Dalgarno et al. (1973) Dalgarno A., Black J. H., Weisheit J. C., 1973, Ap. Lett., 14, 77
- Draine & Lee (1984) Draine B.T., Lee H.M., 1984, ApJ, 285, 89
- Draine & Anderson (1985) Draine B.T., Anderson N., 1985, ApJ, 292, 494
- Draine & Li (2001) Draine B.T., Li A., 2001, ApJ, 551, 807
- Duley & Williams (1986) Duley W.W., Williams D.A., 1986, MNRAS 223, 177
- Gould & Salpeter (1963) Gould R.J., Salpeter E.E., 1963, ApJ, 138, 393
- (20) Green N.J.B., Toniazzo T., Pilling M.J. Ruffle, D.P. Bell, N., Hartquist T.W., 2001, A&A 375, 1111
- Hasegawa et al. (1992) Hasegawa T.I., Herbst E., Leung C.M., 1992, ApJS, 82, 167
- Hasegawa & Herbst (1993a) Hasegawa T.I., Herbst E., 1993a, MNRAS 261, 83
- Hasegawa & Herbst (1993b) Hasegawa T.I., Herbst E., 1993b, MNRAS 263, 589
- d’Hendecourt et al. (1985) d’Hendecourt L.B., Allamandola L.J., Greenberg J.M., 1985, A&A, 152, 130
- Hollenbach & Salpeter (1970) Hollenbach D., Salpeter E.E., 1970, J. Chem. Phys. 53, 79
- Hollenbach & Salpeter (1971) Hollenbach D., Salpeter E.E., 1971, ApJ 163, 155
- Hollenbach et al. (1971) Hollenbach D., Werner M.W., Salpeter E.E., 1971, ApJ 163, 165
- Hoogers et al. (1995) Hoogers G., Lsiak-Orlowska B., King D.A., 1995, 327, 47
- Katz et al. (1999) Katz N., Furman I., Biham O., Pirronello V., Vidali G., 1999, ApJ, 522, 305
- Koehler et al. (1988) Koehler B.G., Mak C.H., Arthur D.A., Coon P.A., George S.M., 1998, J. Chem. Phys., 89, 1709
- Landau & Lifshitz (1980) Landau L.D., Lifshitz E.M., 1980, Statistical Physics Part I (Pergamon Press, Oxford).
- Li & Draine (2001) Li A., Draine B.T., 2001, ApJ, 554, 778
- Manico et al. (2001) Manicò G., Ragunì G., Pirronello V., Roser J.E., Vidali G., 2001, ApJ 548, L253
- Mathis et al. (1977) Mathis J.S., Rumpl W., Nordsieck K.H., 1977, ApJ, 217, 425
- Mathis (1990) Mathis J.S., 1990, ARA&A, 28, 37
- Mathis (1996) Mathis J.S., 1996, ApJ, 472, 643
- Millar et al. (1989) Millar T. J., Bennett A., Herbst E., 1989, ApJ, 340, 906
- Montroll & Weiss (1965) Montroll E.W., Weiss G.H., 1965, J. Math. Phys. 6, 167
- Pickles & Williams (1977) Pickles J.B., Williams D.A., 1977, Ap&SS, 52, 433
- Pirronello & Avera (1988) Pirronello V., Averna D.. 1988, A&A, 201, 196
- Pirronello et al. (1997a) Pirronello V., Liu C., Shen L., Vidali G., 1997a, ApJ 475, L69
- Pirronello et al. (1997b) Pirronello V., Biham O., Liu C., Shen L., Vidali G., 1997b, ApJ 483, L131
- Pirronello et al. (1999) Pirronello V., Liu C., Roser J.E., Vidali G., 1999, A&A 344, 681
- Roberts et al. (2002) Roberts H., Herbst E., Millar T.J., 2002, MNRAS, 336, 283
- Roberts et al. (2003) Roberts H., Herbst E., Millar T.J., 2003, ApJ, 591, L41
- Roberts & Millar (2000a) Roberts H., Millar T. J., 2000a, A&A, 361, 388
- Roberts & Millar (2000b) Roberts H., Millar T. J., 2000b, A&A, 364, 780
- Rodgers & Charnley (2001) Rodgers S.D., Charnley S.B., 2001, ApJ, 553, 613
- Sandford & Allamandola (1993) Sandford S.A., Allamandola L.J., 1993, ApJ, 409, L65
- Schutte et al. (1976) Schutte A., Bassi D., Tommasini F., Turelli A., Scoles G., Hermans L.J.F., 1976, J. Chem Phys., 64, 4135
- Shalabiea & Greenberg (1994) Shalabiea O.M., Greenberg J.M., 1994, A&A, 290, 266
- Shalabiea et al. (1998) Shalabiea O.M., Caselli P., Herbst E., 1998, ApJ, 502, 652
- Smoluchowski (1981) Smoluchowski R., 1981, Ap&SS, 75, 353
- Smoluchowski (1983) Smoluchowski R., 1983, J. Chem. Phys., 87, 4229
- Stantcheva et al. (2001) Stantcheva T., Caselli P., Herbst E., 2001, A&A, 375, 673
- Stantcheva et al. (2002) Stantcheva T., Shematovich V.I., Herbst E., 2002, A&A, 391, 1069
- Stantcheva & Herbst (2003) Stantcheva T., Herbst, E., 2003, MNRAS, 340, 983
- Takahashi et al. (1999) Takahashi J., Masuda K., Nagaoka M., 1999, MNRAS 306, 22
- Tielens (1995) Tielens A.G.G.M., 1995, unpublished.
- Tielens & Hagen (1982) Tielens A. G. G. M., Hagen w., 1982, A&A, 114, 245
- van der Tak et al. (2002) van der Tak F.F.S., et al., 2002, A&A, 388, L53
- Watson (1973) Watson W.D., 1973, Apj, 182, L73
- Weingartner (2001) Weingartner J.C., Draine B.T., 2001, ApJ, 548, 296
- Willacy & Williams (1993) Willacy K., Williams D.A., 1993, MNRAS, 260, 635
- Williams (1968) Williams D.A., 1968, ApJ, 151, 935
| T | ||||
|---|---|---|---|---|
| 12 | ||||
| 14 | ||||
| 16 | ||||
| 18 | ||||
| 19 | ||||
| 20 | ||||
Appendix A Isotope effects in related experiments
Isotope effects resembling the type studied here were observed experimentally on various surfaces including metals (Hoogers et al., 1995) and silicon (Koehler et al., 1988). However, these experiments were done at much higher temperatures than those relevant for molecular hydrogen formation. Also, the surfaces on which isotope effects were studied are more ordered than the astrophysically relevant surfaces. Therefore, it may not be possible to draw conclusions from these experiments for astrophysically relevant surface processes.
A crucial feature in the recent experiments on molecular hydrogen formation is the use of two beams, of H and D atoms, and the measurement of the HD production rate (Pirronello et al., 1997a, b, 1999). The use of HD molecules improves the signal-to-noise ratio in the experiment and allows reliable measurement of the production rate. In the analysis of the experimental results it was assumed, for simplicity, that there is no isotope effect, namely, that the diffusion and desorption barriers for H and D atoms are identical (Katz et al., 1999). This assumption was made in order to limit the number of free parameters used in the fitting. Under the experimental conditions this assumption had little effect on the results of the analysis. To explain this issue, let us recall the experimental procedure. The experiment followed the standard temperature programmed desorption (TPD) procedure, which consists of two stages. In the first stage, the surface was irradiated by two beams: one of H atoms and the other of D atoms. The beams were of (approximately) equal fluxes and lasted for an equal irradiation time, giving rise to equal coverages of H and D atoms. In the second stage the surface temperature was raised at a constant rate and the production rate of HD molecules was recorded using a mass spectrometer.
The analysis of the experimental results was based on the fact that the surface was of macroscopic size, so that rate equations of the form (5) can account correctly for the atomic populations on the surface and for the production rates of molecules. In the first stage of the experiment the fluxes were , while the diffusion and desorption rates were practically zero, due to the low surface temperature. In the second stage the two beams were turned off, while the diffusion and desorption coefficients quickly increased due to the heating of the surface.
The isotope effect studied here gives rise to a small difference in the energy barriers for diffusion of H and D atoms, , and a larger difference in the desorption energies, where . We will now examine how these differences would affect the results of the TPD experiment. We first consider the effect of the difference in the diffusion barriers. The rate of formation of HD molecules is described by Eq. (9), where the diffusion rates of the H and D atoms sum up. It is thus clear that even if the D atoms are immobile, this gives rise only to about a factor of 2 in the production rate compared to the case in which . Such differences have little effect on the energy barrier for diffusion, , obtained from fitting the experimental TPD curve. This is because appears in the exponent of Eq. (4). Therefore, when the experimental TPD curves are fitted by a rate equation model that includes a single energy barrier for diffusion, , the result is very close to the lower diffusion barrier among the H and D, namely to .
Consider the case in which the desorption barrier of D atoms, , is larger than the desorption barrier of H atoms, . In this case, as the temperature is raised during a TPD experiment, D atoms desorb more slowly than H atoms. The formation rate of HD molecules is thus limited by the availability of H atoms. When the resulting TPD curves are fitted by a rate equation model that includes only a single energy barrier for desorption, , the fitted value turns out to be a very good approximation to .
It thus turns out that slower diffusion and desorption rates of D atoms vs. H atoms, have little effect on the TPD curves that describe the rate of formation of HD molecules. When these TPD curves are fitted by a rate equation model with a single diffusion barrier, , and a single desorption barrier, , these barriers provide good approximations to and . This conclusion is not limited to the case in which the experiment is done on a macroscopic surface. It is expected to be valid even if the experiment is done on a powder that consists of small grains.
The origin of the isotope effect on dust grains in the interstellar medium is the long residence time of D atoms on the grain compared with H atoms. As a result, an (H or D) atom that hits a grain is more likely to encounter a D atoms on the grain than expected based on the gas phase abundance ratio. In the TPD experiments all the H and D atoms are deposited on the surface at the initial stage of the experiment, when the surface temperature is low and the adsorbed atoms are immobile. During the heating stage, when the adsorbed atoms become mobile, the beams are turned off and there is no fresh supply of H or D atoms. Therefore, the D atoms that remain on the surface after most of the H atoms are desorbed tend to form D2 molecules. The isotope effect is thus expected to affect the TPD curve of D2 molecules. However, it does not affect the TPD curve of HD molecules, which is the one that was measured in the experiments.