Intergalactic HII Regions Discovered in SINGG
Abstract
A number of very small isolated H ii regions have been discovered at projected distances up to 30 kpc from their nearest galaxy. These H ii regions appear as tiny emission line objects in narrow band images obtained by the NOAO Survey for Ionization in Neutral Gas Galaxies (SINGG). We present spectroscopic confirmation of four isolated H ii regions in two systems, both systems have tidal H i features. The results are consistent with stars forming in interactive debris due to cloud-cloud collisions. The H luminosities of the isolated H ii regions are equivalent to the ionizing flux of only a few O stars each. They are most likely ionized by stars formed in situ, and represent atypical star formation in the low density environment of the outer parts of galaxies. A small but finite intergalactic star formation rate will enrich and ionize the surrounding medium. In one system, NGC 1533, we calculate a star formation rate of M⊙yr-1, resulting in a metal enrichment of solar for the continuous formation of stars. Such systems may have been more common in the past and a similar enrichment level is measured for the ‘metallicity floor’ in damped Lyman- absorption systems.
1 Introduction
H ii regions signifying the presence of highly ionizing OB stars are usually found in the luminous inner regions of galaxies (e.g. Martin & Kennicutt, 2001). H ii regions are also located in the faint outer arms of spirals (e.g. Ferguson et al., 1998b), and as single or multiple star forming knots in narrow emission line dwarfs (H ii galaxies). In each case, new stars are formed in the vicinity of an existing stellar population. However, recent observations by Gerhard et al. (2002) have spectroscopically confirmed an isolated compact H ii region on the extreme outskirts of a galaxy (NGC 4388) in the Virgo cluster. Several luminous H-emitting knots have also been discovered in a compact group in the A1367 cluster (Sakai et al., 2002). In these cases it appears that the H ii regions are due to newly formed stars where no stars existed previously, albeit in a galaxy cluster environment.
As they evolve, OB stars increase the metal abundance in their local environment. Absorption line studies show that the intergalactic medium (IGM) and galaxy halos, including our own, are enriched (e.g. Chen et al., 2001; Tripp et al., 2002; Collins et al., 2003). Isolated H ii regions provide a potential source for this enrichment. In situ star formation in the IGM offers an alternative to galactic wind models to explain metal enrichment hundreds of kilo-parsecs from the nearest galaxy.
Here we present a number of very small isolated H ii regions that have been discovered by their H emission in the narrow band images obtained by the NOAO Survey for Ionization in Neutral Gas Galaxies (SINGG). SINGG is an H survey of an H i-selected sample of nearby galaxies. The survey is composed of nearly 500 galaxies from the H i Parkes All-Sky Survey (HIPASS, Barnes et al. 2001; Meyer et al. 2003), of these about 300 have been observed in H. Since a gaseous reservoir is a prerequisite for star formation, SINGG measures a broad census of star formation in the local Universe. The H ii regions appear as tiny emission line objects at projected distances up to 30 kpc from the apparent host galaxy. H ii regions are defined as isolated when they are projected at least twice the 25 isophotal radius from the apparent host galaxy. This is typically much further than outer disk H ii regions in spiral galaxies (Ferguson et al., 1998b). In fact, for the systems discussed in detail here it is not totally clear whether the isolated H ii regions are even bound to the apparent host, hence we refer to them as “intergalactic”. Their high equivalent widths suggest they are due to newly formed stars where no stars existed previously.
In Section 2 spectra is presented for five isolated H ii regions candidates in three systems. These five candiates are referred to as the spectroscopically detected emission line objects or H ii region candidates. All but one source has H detected at a comparable recessional velocity to the nearest galaxy, two sources are also detected in [O iii] as further confirmation. These four objects are referred to as the spectroscopically confirmed isolated H ii regions. Optical spectra and H i distributions for all three systems are described in Sections 35. In Section 6 models of the underlying stellar population, scenarios for star formation, enrichment of the IGM, implications of the intergalactic star formation rate, and the possibility that isolated H ii regions are progenitors of tidal dwarf galaxies are discussed. H0=75 km s-1Mpc-1 is used throughout.
2 Observations
Continuum R-band and narrow band H images of local gas-rich galaxies were taken with the CTIO 1.5m telescope as part of SINGG. At least three images were taken in each band, with small () dithers between images. Each image was processed through overscan and bias subtraction, followed by division by a flatfield derived from both dome and twilight sky flats. The images in each band were aligned and combined. The R or narrow-band image with the better seeing was convolved to match the poorer seeing of the other image, and then the R image was scaled and subtracted from the narrow band image to produce a net H image. The final images have a pixel scale of 0.43′′ per pixel and subtend a field of view of nearly 15′. The properties of the SINGG images are given in Table 1. The Table includes the point source detection limit and the large scale surface brightness limit for both R & H images. The latter was determined from the rms variation in the mean background level determined in boxes 35 pixels on a side after iteratively clipping pixels that deviate by more than 5 times the pixel to pixel rms from each box. The box to box variation of the mean is less than 1% of the sky level in all cases.
The candidate isolated H ii regions were identified as unresolved high equivalent width (EW) sources outside the optical disk of each galaxy. Individual exposures were checked and candidates with sharp edges (likely due to cosmic ray residuals) or bright continua were rejected. Aperture photometry was performed on each of the isolated H ii regions in the flux calibrated SINGG images using idlastro routines in IDL yielding H and R fluxes. Since the H ii regions have high equivalent widths, the R count rates were corrected for H line emission using the formula
| (1) |
where is the corrected R count rate, and are the measured count rates in the R and net H image, and and are the throughputs of the filter evaluated at the wavelength of H. For the spectroscopically detected cases, was taken from the spectra; otherwise we assumed that SINGG was detecting net H emission redshifted by the H i heliocentric radial velocity. The results are given in Table 2. The spectroscopically detected isolated H ii regions have H fluxes in the range 6.9 to 11 erg s-1cm-2. Assuming the distance to each isolated H ii regions is the same as the host galaxy in each system, the H luminosities are to erg s-1. In most cases the isolated H ii regions are barely detected in continuum emission in the SINGG R images with a typical detection limit of around erg s-1cm-2Å-1 (see Tables 1 and 2). Isophotal radii at were measured for each galaxy using the ellipse task in IRAF. The galaxy-H ii region separations are given as a function of these radii in Table 3.
Spectra of 11 isolated H ii region candidates were obtained with the double beam spectrograph (DBS) on the RSAA 2.3m telescope in September 2002. Due to the very low continuum flux of the emission line objects, it was necessary to use a nearby star to align the slit on each H ii region candidate in the DBS auto-guider. Three 2000 second exposures were taken of each object. The spectra were reduced using standard procedures in IRAF. The dispersion of the red spectra (6000 - 7000 Å) was 0.55 Å per pixel, corresponding to a resolution of 1.1 Å per pixel or 50 km s-1. The dispersion of the blue spectra (3500 - 5400 Å) was 1.1 Å per pixel, corresponding to a resolution of 2.2 Å per pixel or 150 km s-1. An additional two exposures of the candidate H ii region near ESO 149-G003 were obtained in October 2003 using the same DBS set-up. These additional exposures have been combined with the first spectra to give the result in Figure 1.
Five of the 11 observed isolated H ii region candidates were detected. The non-detected candidates mostly have (with the exception of the candidate H ii region near NGC 1314) and have a range of continuum fluxes. In each case the DBS red spectrum fully covers the narrow band SINGG filter range. Since the spectra do not confirm the reality of these 6 isolated H ii region candidates, they will not be discussed further. Four of the 5 detected isolated H ii regions have confirmed emission lines within the narrow band filter’s passband close to the expected position of H (6563 Å) at recessional velocities close to that of their respective host galaxies (measured from HIPASS, see Table 3, column 2). The recessional velocity measured from each H line is given in Table 2. Some isolated H ii regions were also detected in [O iii] (5007 Å), confirming that the emission seen in the SINGG images is indeed H. The presence of both H and [O iii] lines in these cases places the isolated H ii regions at comparable recessional velocities to the galaxy (or galaxies) in each field, and rules out the possibility that they are background emission line systems. Spectra for the 5 detected isolated H ii regions are given in Figure 1. The H spectra (red arm) have been normalised by the continuum subtracted H fluxes from the SINGG images. The H line fluxes have not been corrected for [N ii] contamination. For the FWHM35Å filters used in this study we expect the combined [N ii] 6548+6583 contamination to be 10% if the line flux ratio [N ii] 6548/H= 0.35. The [O iii] line lies in the blue arm and the flux calibration of the spectra is uncertain. Details of the 3 systems, which include the 5 spectroscopically detected isolated H ii regions, are discussed in the next section.
In addition to the H images and spectra, Australia Telescope Compact Array (ATCA) H i maps are available for two systems, NGC 1533 and ESO 149-G003. The ATCA data reduction is detailed in Ryan-Weber et al. (2003b). The two datasets have a restored beam of and respectively. The velocity resolution is 3.3 km s-1 and the RMS noise is 3.7 mJy beam-1 per channel, corresponding to a 3 column density limit (over a line width of 40 km s-1) of 3.2 cm-2.
3 Three Systems with Detected Isolated H ii regions
3.1 NGC 1533
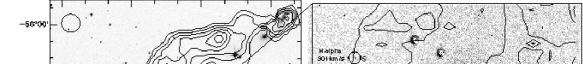
Figure 2 shows a DSS image of NGC 1533 overlaid with ATCA H i contours. The insert has the same contours overlaid on the H image with the isolated H ii regions labelled. The H i distribution around NGC 1533 consists of two major arcs, the NW cloud and the SE cloud. H i gas with column densities below the lowest contour close the H i in a ring. No obvious optical counterpart to this ring is seen in the DSS nor R SINGG image. The total H i mass of the system (based on the total flux density from HIPASS of 67.6 Jy beam-1km s-1) is 7 M⊙. The SE cloud contains of this total H i mass (2.4 M⊙). The projected distance between the H i arcs and the optical centre of NGC 1533 ranges from 2′ to 11.7′, corresponding to a projected physical length between 12 and 70 kpc.
NGC 1533 is an S0 galaxy located 1∘ from the center of the Dorado group. The two smaller galaxies in the NW corner of the image are IC 2039 (closest to NGC 1533, uncertain redshift, no H i detected) & IC 2038 (contains associated H i). The peculiar distribution of H i is thought to arise from the destruction of a galaxy to form a tidal remnant around NGC 1533. If the H i was stripped from IC2038/9, these galaxies would need to account for all the H i in the system and therefore have -to- ratios greater than 15, which is not very likely for their morphologies. The progenitor is more likely a low surface brightness (LSB) galaxy with a moderate H i mass, whose optical counterpart is now too diffuse to identify. N-body/SPH numerical simulations showing the orbital evolution of a LSB galaxy in NGC 1533’s gravitational potential support this hypothesis (Ryan-Weber et al., 2003a).
The velocities of the three confirmed isolated H ii regions (1, 2 and 5), 846, 831 and 901 km s-1, compare well with the velocity of NGC 1533 at 785 km s-1 and lie within the range of H i velocities in the SE cloud (883 km s-1 with a width at 50% peak, km s-1). Interestingly, the isolated H ii regions do not appear to be correlated with the densest regions of H i and are located in the SE cloud only. At this resolution (6 kpc) the densest region of H i is the central part of the NW cloud. The stellar concentrations of tidal dwarf galaxies are located in the densest regions of H i, mapped in 21-cm at similar resolutions ( 4kpc, e.g. Duc et al., 2000). Furthermore, the H i in the SE cloud has velocity dispersions up to 30 km s-1 and velocity gradients in the range 7-50 km s-1kpc-1, making it an unlikely site for star formation. Star formation usually requires the gas to have a low velocity dispersion in order to collapse gravitationally.
3.2 HCG 16
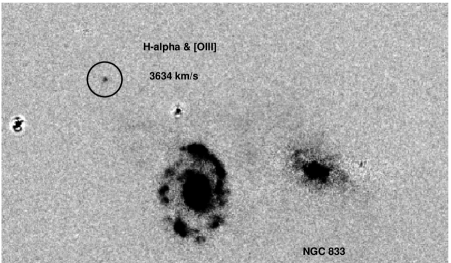
The isolated H ii region in the compact group HCG 16, shown in Figure 3, is near the two galaxies NGC 835 (SBab) and NGC 833 (Sa). The velocity of the isolated H ii region (3634 km s-1) sits on the lower edge of the H i emission measured by HIPASS (velocity = 3917 km s-1, 288 km s-1, 391 km s-1) and below the optical velocities of NGC 835 and NGC 833 (4073 and 3864 km s-1 respectively, from NASA/IPAC Extragalactic Database, NED). The 2D spectrum shows the H emission line from NGC 833 at 3864 km s-1 and diffuse emission decreasing in velocity to 3700 km s-1 half way along the line towards the isolated H ii region. Verdes-Montenegro et al. (2001) have published a VLA map of HCG 16, showing H i in NGC 835 and 833 with a large tidal feature to the NE (overlapping the isolated H ii region position) that joins other group members several arcminutes away to the east.
3.3 ESO 149-G003
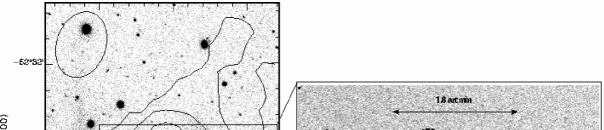
The velocity of the isolated H ii region candidate near the irregular galaxy ESO 149-G003 (949 km s-1) is quite offset from its apparent host galaxy (H i velocity of 576 km s-1 and km s-1). The long-slit spectrum of the H ii region candidate also includes the southern part of the galaxy, and the galaxy H emission line has a measured velocity of 628 km s-1. This 52 km s-1 deviation, just inside the quoted uncertainty, could be due to the slit being aligned along the southern part of the galaxy only, although the H i spectrum does not show a large velocity gradient. A velocity difference of 321 km s-1 is measured between the galaxy and H ii region candidate optical emission lines, assuming the single emission line is indeed H. The narrow H i profile shows no anomalous velocity gas. Follow-up ATCA observations show no H i emission at the velocity and position of the emission line object to MHI () M⊙ at a limit, and assuming a distance of 6.5 (12) Mpc. ESO 149-G003 seems quite isolated, and the nearest galaxy in both NED and HIPASS (Meyer et al. 2003) is ESO 149-G013 at 1500 km s-1, 1.6° (560 kpc) away. However, ESO 149-G003 does show signs of a flared or warped optical disk at the edges, suggesting an interaction has taken place (see Figure 4). A strong positive correlation between warping in late-type galaxies and environment (Reshetnikov & Combes, 1998) has been largely attributed to tidal interactions. However, since only one emission line (H) is detected in this case, the possibility that this candidate isolated H ii region is a background emission line source cannot be ruled out, for example H at z0.4 or [O iii] at z0.3.
4 Discussion
4.1 Underlying Stellar Population
The H luminosities of the detected isolated H ii regions ( to erg s-1) place them at the low luminosity end of the H ii region luminosity function (e.g. Oey & Clarke, 1998). The H-luminosity of an H ii region is proportional to the ionizing photon luminosity () above the Lyman limit (912 Å) from nearby stars. From equation 5.23 in Osterbrock (1989), , and using the ionizing luminosity of an O5V star (Vacca et al., 1996), each isolated H ii region is illuminated by the equivalent of O5V stars each. The least luminous detected isolated H ii region can be ionized by a single O9.5 star.
The underlying stellar population is very weak in most of the spectroscopically detected emission line objects, in two of the five cases it is undetected in the SINGG images. This makes it difficult to constrain whether the isolated H ii regions are ionized by a single isolated massive star, or whether the massive star or stars represent the ‘tip of the iceberg’ of a cluster. A single massive star could have formed spontaneously; examples of this exist in the disk of the Milky Way, where IR observations show an isolated massive star (Ballantyne et al., 2000). However, most massive stars form as part of a cluster (Clarke et al., 2000), with a characteristic Initial Mass Function (IMF). The very low continuum emission does rule out a significant underlying stellar population and suggests that isolated H ii regions are due to newly formed clusters where no stars existed previously. The low continuum emission also separates isolated H ii regions from H ii galaxies and tidal dwarf galaxies. Three of the four confirmed isolated H ii regions have EW(H)1000 Å. By comparison, H ii regions in the outer arms of spiral galaxies (beyond the B 25th-magnitude isophote) measured by Ferguson et al. (1998a) have an average EW(H)=364 Å. Furthermore, most of the group of star forming dwarf galaxies in A1367 have EW(H)100 Å (Sakai et al., 2002).
Upper limit estimates of the underlying stellar population can be obtained from star formation models, such as Starburst99 (Leitherer et al., 1999). The ratio of to the continuum luminosity, , can be used to find the age of the population. Since very little continuum emission is detected from the isolated H ii regions, the ratio is large, suggesting a very young age, in the range 3 to 7 years, for the parameters of the five detected H i regions. Indeed young ages are expected since we selected isolated H ii region candidates with high equivalent widths. Using the Starburst99 model with a Salpeter IMF, M⊙, and metallicity of 0.4 solar, a very young instantaneous burst is predicted to have a photon luminosity in the range log to 52.7 photons sec-1 for a system with 106 M⊙. The same model predicts 1.2 to 4.5 O stars (in the spectral range O3 to O9.5). Scaling with (H ii region) the number of O stars ionizing each isolated H ii region is in the range , corresponding to a total cluster mass of M⊙. The HCG 16 isolated H ii region is significantly more luminous in H, according to this model, it would consist of 23 O stars in a cluster of M⊙. The ESO 149-G003 isolated H ii region, unlike the others, does have considerable continuum emission in the R image (see Table 2). This suggests a slightly older population (7 years) with 1.4 O stars and cluster mass of 1.2 M⊙. These models account for the nebula emission in the continuum luminosity.
Continuous star formation models predict stellar population ages in the range 6 to 1.5 years for isolated H ii regions with the largest equivalent widths (HCG 16 1, NGC 1533 1 & 5). In these cases, the calculated ages are consistent with the instantaneous burst models, and confirm that the isolated H ii regions are due to newly formed clusters where no stars existed previously. A stellar age of 3 years is found for a continuous star formation model of NGC 1533 2. The low equivalent width of the candidate H ii region in the ESO 149-G003 field however cannot be reasonably fit by the continuous star formation models.
The calculations above assumes a simple scaling of the number of ionizing stars with total cluster mass. At small cluster masses, the differences between analytic and stochastic IMFs can be substantial, especially in the number of high mass stars. Statistical errors in stellar population models are discussed by Cerviño et al. (2002). Monte Carlo simulations can be used to investigate the effects of small initial masses on clusters. Garcia Vargas & Diaz (1994) found the probability of finding a small cluster with an M⊙ star is not zero, as suggested by the analytic IMF, but rises to 12%. Monte Carlo simulations by Cerviño & Mas-Hesse (1994) also obtain similar results. These simulations suggest that the total cluster mass calculated above could be overestimated.
4.2 Origins of Isolated H ii Regions
Since we have just two systems with confirmed isolated H ii regions it is difficult to draw any conclusions on a common formation scenario, if one exists. Evidence of interactions, however, feature in all systems. NGC 1533 and HCG 16 both display tidally disrupted H i outside the main optical region of the galaxies. Although the isolated H ii region projected to be near ESO 149-G003 could be a background object, if the two are associated, the warping in ESO 149-G003’s disk could indicate an interaction has occurred. The two systems that feature similar objects reported in the literature, NGC 4388 in the Virgo cluster (Vollmer & Huchtmeier, 2003; Gerhard et al., 2002) and A1367 (Sakai et al., 2002), also show disrupted H i. Vollmer & Huchtmeier (2003) use ram pressure stripping to explain the isolated H ii region near NGC 4388. Ram pressure stripping is less likely in our two systems, which occur in much less dense environments.
The projected separations between the isolated H ii regions and host galaxies (see Table 3) suggest the underlying massive stars have mostly likely formed in situ. Alternatively, the stars could have formed in the galaxy and then been ejected. Typical ejection velocities due to dynamical interactions do not exceed 200300 km s-1 (Leonard & Duncan, 1988). However the velocity required to travel 433 kpc in the lifetime of a massive star ( yrs) is 3903200 km s-1. The close match in velocity between the isolated H ii regions and galaxy, at least in the NGC 1533 system, suggest that the isolated H ii regions are not currently moving at a high relative speed.
Our own Galactic halo has interactive H i debris which appears to be forming stars. The Magellanic Bridge is an H i complex that joins the Large and Small Magellanic Clouds at 50 kpc and represents the interaction between these two galaxies (e.g. Putman et al., 2003). Simulations indicate the Bridge was formed 200 500 Myr ago (e.g. Gardiner & Noguchi, 1996), but the stars in the Bridge are between 10 25 Myr old (e.g. Demers & Battinelli, 1998), indicating that star formation is currently active within this gas-dominated tidal feature.
We have three confirmed isolated H ii regions with detailed H i information in the NGC 1533 system. The high velocity dispersions and gradients in the vicinity of the isolated H ii regions in this system suggest that star formation is not occurring via the usual gravitational collapse methods. Star formation could be shock-induced by clouds colliding (e.g. Zhang et al., 2001; Sato et al., 2000). Is it reasonable to expect collisions in the NGC 1533 system? Christodoulou et al. (1997) calculated the timescale for collisions in low density environments such as Galactic HVCs and the Magellanic Stream and Bridge. Following Christodoulou et al. (1997), a cloud on a random walk with velocity dispersion , has a characteristic time between collisions of , where the mean free path , that is the volume (V) divided by the number of clouds (N) with cross section . Considering all clouds in the volume, the characteristic time between any two collision is .
The H i ring around NGC 1533 appears to be clumped on scales of no greater than the resolution of the image (′), corresponding to a radius of 3 kpc at a distance of 21 Mpc. Of course, the gas is likely to be clumped on smaller scales too, so this radius is an upper limit. The density, , can be estimated from the surface density, , where = 1.8 g cm-3. The mass of each cloud is then given by MHI= 4 = 3.0 M⊙. Since the entire ring has an H i mass of 7 M⊙, it could be composed of 200 such clouds. The total ring surface area covered by H i with column densities greater than 2 cm-2 is 4 kpc2, assuming a thickness of at least a cloud diameter (6 kpc), gives a volume estimate of 24 kpc3. The velocity dispersion in the ring varies from 5 km s-1 in the NW part to 30 km s-1 in the SE. The timescale of a collision between any two clouds is therefore,
| (2) |
This timescale varies between yrs depending on (and is a lower limit for smaller cloud radii). The lifetime of an O star is only 1 yrs, so we would expect to see star formation events due to cloud collisions at any one time. This estimate agrees with the fact we see 5 isolated H ii regions in the NGC 1533 ring. This formation scenario is therefore plausible.
4.3 IGM Enrichment
Although the H luminosities are small, an estimate of the star formation rate can be obtained by the relation SFR (M⊙yr-1) = LHα/1.26 erg s-1 (Kennicutt, 1998). Summing the H luminosities from the 5 isolated H ii regions in the NGC 1533 system, the SFR M⊙yr-1. The other systems with only one isolated H ii region are lower still. A small, but finite intergalactic star formation rate will continually enrich and ionize the IGM. Maeder (1992) calculated the total yield (y) of metals expelled in winds and ejecta from supernova and planetary nebula. For a Salpeter IMF and a range of initial metallicities, they find 0.022y0.027. Therefore a SFR M⊙yr-1 will return 4 M⊙yr-1 of metals into the surrounding medium. Simulations of the dynamical evolution of H i gas around NGC 1533 show that it could last up to 1 Gyr (Ryan-Weber et al., 2003a). This is considered an upper limit since no consumption of gas due to the formation of stars in taken into account. If the SFR is maintained for 1 Gyr, metals will pollute the 2.4 M⊙ of H i in the SE cloud, resulting in a metallicity of solar. Alternatively if the SFR was not continuous and corresponded to a single population of stars only, the resulting metallicity would be negligible ( solar).
How does this compare to the abundances seen in Ly absorption line systems? H i in the vicinity of the NGC 1533 isolated H ii regions has cm-2, equivalent to a damped Ly absorption (DLA, cm-2) or sub-DLA system ( cm-2). The metallicity of DLA or sub-DLA gas at low redshift varies from 0.01 solar (e.g I Zw 18 Aloisi et al., 2003) to solar. Depending on the initial metallicity, the isolated H ii regions would enrich the NGC 1533 system by 10 percent at the most. At higher redshifts however, this increase in metallicity could be more significant. (Prochaska et al., 2003) find a DLA ‘metallicity floor’ at solar, over a redshift range from 0.5 to 5. Intergalactic star formation may have contributed to this. DLAs with larger velocity widths are found to have higher metallicities (Nestor et al., 2003), this trend is also hinted upon in the sub-DLA data (Peroux et al., 2003). Larger velocity widths may indicate interacting systems. In addition, since collisions and tidal disruptions of galaxies were more common at higher redshifts, the amount of high -gas outside galaxies was greater and therefore the intergalactic star formation rate could have been higher in the past.
4.4 Kinematics and the Tidal Dwarf Galaxy Connection
Comparing the velocity of isolated H ii regions to their apparent host galaxy and associated H i gas is useful in determining their dynamical connection. In Figure 5 the H i spectrum for each system is plotted with the velocity of the detected emission line objects, assuming the line is indeed H. For the NGC 1533 system, the total H i profile in a beam area centered on the isolated H ii region (or regions in the case of 1 and 2, since they are so close) is given. The velocity of all 3 NGC 1533 confirmed isolated H ii regions coincide well with H i gas which is bound to and rotating around NGC 1533 (Ryan-Weber et al., 2003a). Are these isolated H ii regions progenitors to tidal dwarf galaxies? Since the gas and isolated H ii regions are bound to the galaxy, it is likely that the stars formed will also remain bound in the tidal debris. There is certainly a reservoir of gas from which more stars could form, so it is possible in this case that a tidal dwarf galaxy could emerge.
For the other two systems the global H i spectrum is given, since we do not have a synthesis map of HCG 16 and there is no H i detected at the position and velocity of the isolated H ii region near ESO 149-G003. The galaxy escape velocity and velocity of the isolated H ii region are plotted on each spectrum to determine their kinematic connection. The escape velocity is estimated by sin(), where is the width of the global H i profile at 20% of its height and is the inclination of the galaxy. No inclination correction is made for HCG 16 since there is more than one galaxy embedded in the H i emission. In HCG 16 the velocity of the isolated H ii region sits just inside the escape velocity of the system. It is unclear whether the stars formed will remain bound or whether they will disperse into the intragroup medium. The large difference in velocity between ESO 149-G003 and its candidate isolated H ii region suggest the two are not bound. Of course to form a tidal dwarf galaxy, tidal gas is needed, the non-detection of high column density H i gas in the vicinity of this H ii region candidate rules out this possibility.
4.5 ESO 149-G003: A True Isolated H ii Region?
The emission line source near ESO 149-G003 could be a part of an associated extragalactic H i cloud (although technically H i clouds don’t have optical counterparts). Its H i mass upper limit of M⊙ has implications for the search for extragalactic H i clouds around other galaxies and in galaxy groups. For example, Zwaan (2001) searched analogues of the Local Group to a 4.5 limit of M⊙ and found no significant extragalactic H i clouds. This may motivate the search for lower H i mass extragalactic clouds. This isolated H ii region candidate is quite different from the others discussed in this paper. Only one emission line is detected (making the line identification ambiguous), the continuum flux is significantly higher and the apparent velocity difference between ESO 149-G003 and the H ii region candidate (assuming the detected emission line is in fact H, see Figure 5) places the it well outside the escape velocity of ESO 149-G003 (45 km s-1). This kinematic evidence suggests that the source is perhaps a distant emission line galaxy in the field, rather than being associated with ESO 149-G003. Whether the emission line is H at 995 km s-1 or another line at a higher redshift is uncertain. Indeed, we expect a contamination rate of background emission line systems of per SINGG image, based on number statistics from Boroson et al. (1993), Cowie & Hu (1998) and Rhoads et al. (2000). If the emission line is H, this object holds interesting implications for the census of intergalactic matter. Absorption lines along random lines-of-sight tell us that the IGM is generally clumped spatially and in velocity, and shows a range of densities and metallicities. In future studies isolated H ii regions could be used as beacons for star-forming regions of the IGM. This would complement absorption studies along random sight lines and low spatial resolution H i emission observations of the IGM.
5 Conclusion
The discovery of intergalactic H ii regions presented here and in other recent publications provides a small but finite source of enrichment and ionization of the IGM. In two cases the fact that these emission line objects are detected in both H and [O iii] rules out the possibility that they are background emitters. The H luminosities imply that each isolated H ii region is ionized by 47 O stars. If these stars have formed in situ they represent atypical star formation in a low density environment. The low level of continuum emission from three of four confirmed isolated H ii regions suggests the stellar populations are very young and have formed where no stars existed previously. If part of a normal IMF, the corresponding total cluster mass would be M⊙. In two out of three systems, isolated H ii regions are associated with tidal H i features, providing a reservoir of neutral gas. In one particular system, NGC 1533, the mass, distribution and velocity dispersion of the H i suggests the rate of star formation ( M⊙yr-1) could be sustained by the collision of clouds. This would result an increase in the metal abundance by solar. This is the same abundance level as seen in the DLA ‘metallicity floor’ (Prochaska et al., 2003). The amount of intergalactic high column density H i and rate of collision-triggered intergalactic star formation may have been higher in the past. On-going investigations into the metallicities and underlying stellar population of these and other isolated H ii regions in the SINGG images will shed more light on their nature and origin.
6 Acknowledgements
This research has made use of the NASA/IPAC Extragalactic Database (NED). Digitized Sky Survey (DSS) material (UKST/ROE/AAO/STScI) is acknowledged. ERW acknowledges support from an Australia Postgraduate Award. MEP acknowledges support by NASA through Hubble Fellowship grant HST-HF-01132.01 awarded by the Space Telescope Science Institute, which is operated by AURA Inc. under NASA contract NAS 5-26555. MSO acknowledges support from the National Science Foundation Grant AST-0204853. Helpful comments by the referee are gratefully acknowledged.
References
- Aloisi et al. (2003) Aloisi, A., Savaglio, S., Heckman, T. M., Hoopes, C. G., Leitherer, C., & Sembach, K. R. 2003, ApJ, 595, 760
- Ballantyne et al. (2000) Ballantyne, D. R., Kerton, C. R., & Martin, P. G. 2000, ApJ, 539, 283
- Barnes D. G., et al (2001) Barnes D. G., et al. 2001, MNRAS, 322, 486
- Boroson et al. (1993) Boroson, T. A., Salzer, J. J., & Trotter, A. 1993, ApJ, 412, 524
- Cerviño & Mas-Hesse (1994) Cerviño, M. & Mas-Hesse, J. M. 1994, A&A, 284, 749
- Cerviño et al. (2002) Cerviño, M., Valls-Gabaud, D., Luridiana, V., & Mas-Hesse, J. M. 2002, A&A, 381, 51
- Chen et al. (2001) Chen, H., Lanzetta, K. M., Webb, J. K., & Barcons, X. 2001, ApJ, 559, 654
- Christodoulou et al. (1997) Christodoulou, D. M., Tohline, J. E., & Keenan, F. P. 1997, ApJ, 486, 810
- Clarke et al. (2000) Clarke, C. J., Bonnell, I. A., & Hillenbrand, L. A. 2000, Protostars and Planets IV, 151
- Collins et al. (2003) Collins, J. A., Shull, J. M., & Giroux, M. L. 2003, ApJ, 585, 336
- Cowie & Hu (1998) Cowie, L. L. & Hu, E. M. 1998, AJ, 115, 1319
- Demers & Battinelli (1998) Demers, S. & Battinelli, P. 1998, AJ, 115, 154
- Duc et al. (2000) Duc, P.-A., Brinks, E., Springel, V., Pichardo, B., Weilbacher, P., & Mirabel, I. F. 2000, AJ, 120, 1238
- Ferguson et al. (1998a) Ferguson, A. M. N., Gallagher, J. S., & Wyse, R. F. G. 1998a, AJ, 116, 673
- Ferguson et al. (1998b) Ferguson, A. M. N., Wyse, R. F. G., Gallagher, J. S., & Hunter, D. A. 1998b, ApJL, 506, L19
- Garcia Vargas & Diaz (1994) Garcia Vargas, M. L. & Diaz, A. I. 1994, ApJS, 91, 553
- Gardiner & Noguchi (1996) Gardiner, L. T. & Noguchi, M. 1996, MNRAS, 278, 191
- Gerhard et al. (2002) Gerhard, O., Arnaboldi, M., Freeman, K. C., & Okamura, S. 2002, ApJ, 580, L121
- Kennicutt (1998) Kennicutt, R. C. 1998, ApJ, 498, 541
- Leitherer et al. (1999) Leitherer, C., Schaerer, D., Goldader, J. D., Delgado, R. M. G., Robert, C., Kune, D. F., de Mello, D. F., Devost, D., & Heckman, T. M. 1999, ApJS, 123, 3
- Leonard & Duncan (1988) Leonard, P. J. T. & Duncan, M. J. 1988, AJ, 96, 222
- Maeder (1992) Maeder, A. 1992, A&A, 264, 105
- Martin & Kennicutt (2001) Martin, C. L. & Kennicutt, R. C. 2001, ApJ, 555, 301
- Meyer M., et al (2003) Meyer M., et al. 2003, MNRAS, submitted
- Nestor et al. (2003) Nestor, D. B., Rao, S. M., Turnshek, D. A., & Berk, D. V. 2003, ApJL, accepted
- Oey & Clarke (1998) Oey, M. S. & Clarke, C. J. 1998, AJ, 115, 1543
- Osterbrock (1989) Osterbrock, D. E. 1989, Astrophysics of gaseous nebulae and active galactic nuclei (Mill Valley, University Science Books)
- Peroux et al. (2003) Peroux, C., Dessauges-Zavadsky, M., D’Odorico, S., Kim, T. S., & McMahon, R. G. 2003, MNRAS, accepted
- Prochaska et al. (2003) Prochaska, J. X., Gawiser, E., Wolfe, A. M., Castro, S., & Djorgovski, S. G. 2003, ApJ, 595, L9
- Putman et al. (2003) Putman, M. E., Staveley-Smith, L., Freeman, K. C., Gibson, B. K., & Barnes, D. G. 2003, ApJ, 586, 170
- Reshetnikov & Combes (1998) Reshetnikov, V. & Combes, F. 1998, A&A, 337, 9
- Rhoads et al. (2000) Rhoads, J. E., Malhotra, S., Dey, A., Stern, D., Spinrad, H., & Jannuzi, B. T. 2000, ApJ, 545, L85
- Ribeiro et al. (1998) Ribeiro, A. L. B., de Carvalho, R. R., Capelato, H. V., & Zepf, S. E. 1998, ApJ, 497, 72
- Ryan-Weber et al. (2003a) Ryan-Weber, E., Webster, R., & Bekki, K. 2003a, in ASSL Vol. 281: The IGM/Galaxy Connection. The Distribution of Barons at z=0, 223
- Ryan-Weber et al. (2003b) Ryan-Weber, E. V., Webster, R. L., & Staveley-Smith, L. 2003b, MNRAS, 343, 1195
- Sakai et al. (2002) Sakai, S., Kennicutt, R. C., van der Hulst, J. M., & Moss, C. 2002, ApJ, 578, 842
- Sato et al. (2000) Sato, F., Hasegawa, T., Whiteoak, J. B., & Miyawaki, R. 2000, ApJ, 535, 857
- Tonry et al. (2001) Tonry, J. L., Dressler, A., Blakeslee, J. P., Ajhar, E. A., Fletcher, A. B., Luppino, G. A., Metzger, M. R., & Moore, C. B. 2001, ApJ, 546, 681
- Tripp et al. (2002) Tripp, T. M., Jenkins, E. B., Williger, G. M., Heap, S. R., Bowers, C. W., Danks, A. C., Davé, R., Green, R. F., Gull, T. R., Joseph, C. L., Kaiser, M. E., Lindler, D., Weymann, R. J., & Woodgate, B. E. 2002, ApJ, 575, 697
- Vacca et al. (1996) Vacca, W. D., Garmany, C. D., & Shull, J. M. 1996, ApJ, 460, 914
- Verdes-Montenegro et al. (2001) Verdes-Montenegro, L., Yun, M. S., Williams, B. A., Huchtmeier, W. K., Del Olmo, A., & Perea, J. 2001, A&A, 377, 812
- Vollmer & Huchtmeier (2003) Vollmer, B. & Huchtmeier, W. 2003, A&A, 406, 427
- Zhang et al. (2001) Zhang, Q., Fall, S. M., & Whitmore, B. C. 2001, ApJ, 561, 727
- Zwaan (2001) Zwaan, M. A. 2001, MNRAS, 325, 1142

.

| Target | Time Exposure | Seeing | Detection Limit | Surface Brightness Limit | |||
|---|---|---|---|---|---|---|---|
| Name | R | H | R | H | R | H | |
| sec | sec | arcsec | erg s-1cm-2Å-1 | erg s-1cm-2 | erg s-1cm-2Å-1arcsec-2 | erg s-1cm-2arcsec-2 | |
| HCG 16 | 360 | 1800 | 1.7 | 1.08 | 1.48 | 1.33 | 1.51 |
| ESO 154-G023 | 360 | 1800 | 1.2 | 9.20 | 7.54 | 5.57 | 1.20 |
| NGC 1314 | 360 | 1800 | 1.5 | 9.46 | 1.19 | 1.05 | 9.29 |
| NGC 1533 | 480 | 1800 | 1.4 | 9.08 | 9.96 | 4.99 | 1.17 |
| IC 5052 | 360 | 1800 | 1.4 | 1.23 | 1.11 | 2.46 | 1.82 |
| ESO 238-G005 | 360 | 1800 | 1.3 | 1.01 | 1.04 | 9.38 | 1.20 |
| ESO 149-G003 | 360 | 1800 | 1.7 | 1.25 | 1.37 | 2.72 | 1.33 |
| Candidate H ii | mR | R Flux | H Flux | EW | H Lum. | Lines | Velocity |
|---|---|---|---|---|---|---|---|
| Region Name | AB mag | erg s-1cm-2Å-1 | erg s-1cm-2 | Å | erg s-1 | Detected | km s-1 |
| HCG 16 1 | 1.0(0.05) | 1764 | 3.5 | H, [O iii] | 3634(50) | ||
| ESO 154-G023 1 | 7.6( | 3.8(0.5) | 51 | 1.3 | none | … | |
| NGC 1314 1 | 4.6( | 1.6(0.05) | 431 | 5.2 | none | … | |
| NGC 1533 1 | 1.5( | 1.1(0.5) | 1113 | 5.8 | H, [O iii] | 846(50) | |
| NGC 1533 2 | 4.1( | 6.8(0.5) | 177 | 3.6 | H | 831(50) | |
| NGC 1533 3 | 2.3( | 6.4(0.5) | 331 | 3.4 | not obs. | … | |
| NGC 1533 4 | 2.5( | 5.8(0.5) | 262 | 3.1 | not obs. | … | |
| NGC 1533 5 | 5.0(0.5) | 1658 | 2.6 | H | 901(50) | ||
| IC 5052 1 | 2.4( | 3.2(0.4) | 143 | 1.3 | none | … | |
| IC 5052 2 | 1.34( | 4.0(0.4) | 31 | 1.7 | none | … | |
| ESO 238-G005 1 | 1.5( | 1.4(0.6) | 102 | 1.3 | none | … | |
| ESO 238-G005 2 | 2.0(0.6) | 1778 | 1.9 | none | … | ||
| ESO 149-G003 1 | 1.8( | 6.9(0.5) | 39 | 3.5 | H? | 949(50) |
| Host | Velocity | Distance | H ii Reg. | Separation | H ii Reg. Position | ||
|---|---|---|---|---|---|---|---|
| Galaxy | km s-1 | Mpc | No. | kpc, R25 | RA | Dec | cm-2 |
| HCG 16 | 3917 | 53 | 1 | 19, 2.0 | 02:09:28 | -10:07:16 | … |
| ESO 154-G023 | 574 | 5.3 | 1 | 6.0, 3.5 | 02:56:31 | -54:31:35 | 2.8 |
| NGC 1314 | 3936 | 52 | 1 | 131, 15.2 | 03:23:12 | -04:15:16 | … |
| NGC 1533 | 785 | 21 | 1 | 33, 4.0 | 04:10:13 | -56:11:37 | 2.4 |
| NGC 1533 | 785 | 21 | 2 | 33, 4.0 | 04:10:14 | -56:11:35 | 2.4 |
| NGC 1533 | 785 | 21 | 3 | 31, 3.8 | 04:10:17 | -56:10:46 | 9.8 |
| NGC 1533 | 785 | 21 | 4 | 16, 2.0 | 04:10:11 | -56:07:28 | 3.2 |
| NGC 1533 | 785 | 21 | 5 | 20, 2.5 | 04:10:15 | -56:06:15 | 1.5 |
| IC 5052 | 584 | 5.9 | 1 | 8.0, 1.4 | 20:52:59 | -69:12:27 | 3.2 |
| IC 5052 | 584 | 5.9 | 2 | 10, 1.7 | 20:52:53 | -69:16:22 | 3.2 |
| ESO 238-G005 | 706 | 8.9 | 1 | 3.9, 30 | 22:22:33 | -48:25:42 | 2.4 |
| ESO 238-G005 | 706 | 8.9 | 2 | 11, 84 | 22:22:42 | -48:27:53 | 3.2 |
| ESO 149-G003 | 576(628)111Velocity of the H line in the galaxy measured from the same long-slit spectrum as the isolated H ii region is 628 (50) km s-1. | 6.5 | 1 | 3.4, 5.2 | 23:51:51 | -52:34:34 | 3.2 |