Characteristics of Diffuse X-Ray Line Emission within 20 pc of the Galactic Center
Abstract
Over the last three years, the Galactic center region has been monitored with the Chandra X-Ray Observatory. Besides the X-ray emission from the target object, Sgr A*, diffuse X-ray emission was detected throughout most of the 17′ 17′ field of view. With 11 Chandra observations through 2002 June, the total effective exposure reaches 590 ks, providing significant photon statistics on much of the detailed structure within the faint, often filamentary, diffuse X-ray emission. The true-color X-ray image and the equivalent width images for the detected elemental species of the Galactic center region demonstrate that the diffuse X-ray features have a broad range of spatio-spectral properties. Enhancements of the low-ionization-state Fe line emission ( 6.4 keV) to the northeast of Sgr A* can be interpreted as fluorescence within the dense interstellar medium resulting from irradiation by hard, external X-ray sources. They may also be explained by emission induced by the bombardments by high energy particles on the ambient medium, such as may accompany unresolved supernova ejecta intruding into dense interstellar medium. The detection of molecular cloud counterparts to the 6.4 keV Fe line emitting features indicates that these Fe line features are associated with dense Galactic center clouds and/or active star-forming regions, which strongly supports the proposed origins of the X-ray reflection and/or supernova ejecta for the Fe line emission. We detect highly ionized S and Si lines which are generally coincident with the low-ionization-state Fe line emission and the dense molecular clouds in the northeast of Sgr A*. These hot plasmas are then most likely produced by massive star-forming activities and/or supernova remnants in the Galactic center. In contrast, we find that highly ionized He-like Fe line emission ( 6.7 keV) is primarily distributed along the plane instead of being concentrated in the northeast of Sgr A*. The implied high temperature and the relatively uniform, but, strong alignment along the plane are consistent with the magnetic confinement model, suggesting this hot gas component has been re-heated by the strong interstellar magnetic fields in the Galactic center to produce the observed He-like Fe line emission.
1 INTRODUCTION
The central 100 pc around the Galactic center is an extremely complex region containing a variety of astrophysical activities: i.e., cold and warm molecular clouds, star clusters/formation, supernova remnants (SNRs), and HII regions, to name a few. Earlier Galactic plane surveys with the Tenma and Ginga satellites have discovered the highly ionized Fe emission line at 6.7 keV, which is strongly enhanced toward the Galactic center region (Koyama et al. 1986a, ; Koyama et al., 1989). ASCA and BeppoSAX observations have confirmed the presence of the ionized Fe emission line as well as detecting emission lines from other highly ionized elemental species of Si, S, and Ar (Koyama et al., 1996; Sidoli & Mereghetti, 1999). These results suggested that the difuse X-ray emission in the plane and the Galactic center regions arises from thermal plasmas with multiple temperatures and ionization states, although the temperatures of the individual plasma components are inconclusive (e.g., Koyama et al. 1996; Kaneda et al. 1997; Valinia & Marshall 1998; Park & Ebisawa 2001). The origins of these hot plasmas have been suggested to be multiple supernova explosions and magnetic confinement of the interstellar medium (ISM) (e.g., Kaneda et al. 1997 and references therein).
Besides the apparent hot thermal components, the presence of giant molecular cloud complexes (e.g., Sanders et al. 1984), as well as a number of hard X-ray emitting point sources near the Galactic center (e.g., Skinner et al. 1987) has led to the prediction that fluorescent X-ray emission should arise where the cold, dense ISM is illuminated by external X-ray sources (Sunyaev et al., 1993). This proposed new class of X-ray sources has been discovered with ASCA by detecting low-ionization-state Fe line emission (FeI FeXVII) in the Galactic center region emerging at a characteristic energy of 6.4 keV (Koyama et al., 1996). A detailed analysis of this low ionization, or “neutral” 6.4 keV Fe line emission toward the Galactic giant molecular cloud Sgr B2 has successfully described this fluorescent X-ray emission from the molecular cloud in terms of an X-ray reflection nebula (XRN) model (Murakami et al., 2000). Strong past activity of the supermassive Galactic black hole candidate Sgr A* was proposed to be the primary external illuminating source to produce the observed neutral Fe line emission from Sgr B2. A similar XRN feature has also been detected in another Galactic center molecular cloud, Sgr C (Murakami et al. 2001a, ). Alternatively, such neutral Fe line emission may also be explained by the bombardment of energetic electrons on metal-rich SN ejecta fragments (Bykov, 2002). Massive stars appear to be forming at several sites in the central few hundred parsecs (Morris, 1993; Yusef-Zadeh et al., 2002), so the proposed unresolved SN ejecta scenario for the origin of the observed neutral Fe line emission is plausible as well.
The X-ray line emission from the hot/cold ISM is therefore a useful tool to probe the origins of the complex structure of the ISM in the Galactic center. The poor angular resolutions of previous detectors were, however, insufficient for such studies in complex regions of the Galactic center. With the superb sub-arcsecond angular resolution and good sensitivity in the 0.3 8 keV band, the Chandra X-Ray Observatory provides an excellent opportunity to investigate the nature of the diffuse X-ray emission in the Galactic center regions. Preliminary results from earlier Chandra observations showed that the diffuse X-ray emission features in the Galactic center appear to have a variety of spectral and morphological characteristics (Bamba et al., 2002). The interpretations of these diffuse X-ray features have however been highly speculative primarily due to the limited photon statistics with previous data. Recently, we have performed deep observations of the Galactic center with Chandra. The exposure has reached 600 ks, which is an order of magnitude deeper than previous observations, so that these deep Chandra observations represent an unprecedented wealth of X-ray data on the Galactic center. In fact, these Chandra data have resolved over 2300 point sources within 20 pc of the Galactic center (Muno et al. 2003a, ). Besides these point sources, including the target object Sgr A*, the Chandra data show a complex structure of the diffuse X-ray emission within the 17′ 17′ field of view (FOV). We here present the latest deep Chandra observations of the Galactic center. The high angular resolution Chandra data with decent photon statistics from the deep exposure allow us extensive imaging and spectral analysis of detected bright filamentary features. The observation is described in §2, and the X-ray image analysis is presented in §3 and §4. We present the results from spectral analysis for some selected emission features in §5, and compare these results with molecular line emission features in §6. Some implications are then discussed in §7. A summary is presented in §8.
2 OBSERVATIONS & DATA REDUCTION
For the last three years, the Galactic supermassive black hole candidate Sgr A* has been monitored, as part of Guaranteed Time Observation (GTO) and Guest Observer (GO) programs, with the Advanced CCD Imaging Spectrometer (ACIS) (Garmire et al., 2003) on board the Chandra X-Ray Observatory (Table 1). As of 2002 June, combining 11 Chandra/ACIS observations (except for ObsID 1561a, which was severely contaminated by a bright transient source within the FOV), the total exposure has reached 590 ks, which is the deepest ever observation of the Galactic center region in X-rays. We first applied the algorithm developed by Townsley et al. (2002a) to correct the spatial and spectral degradation of the ACIS data caused by radiation damage, known as charge transfer inefficiency (CTI; Townsley et al. [2000]). The expected effects of the CTI correction include an increase in the number of detected events and improved event energies and energy resolution (Townsley et al., 2000; Townsley et al. 2002a, ). We then screened the data by status, grade, and the flight timeline filter. We have also removed observation time intervals of strong flaring in the background. All individual event files were then reprojected to the tangent plane at the radio position of Sgr A* (RA[J2000] = 17h 45m 40s.0409, Dec[J2000] = 29∘ 00′ 28118) in order to generate the composite data. The detailed descriptions of these data reduction processes and the resulting broadband raw image from the composite data may be found in Muno et al. (2003a).
3 X-Ray Images
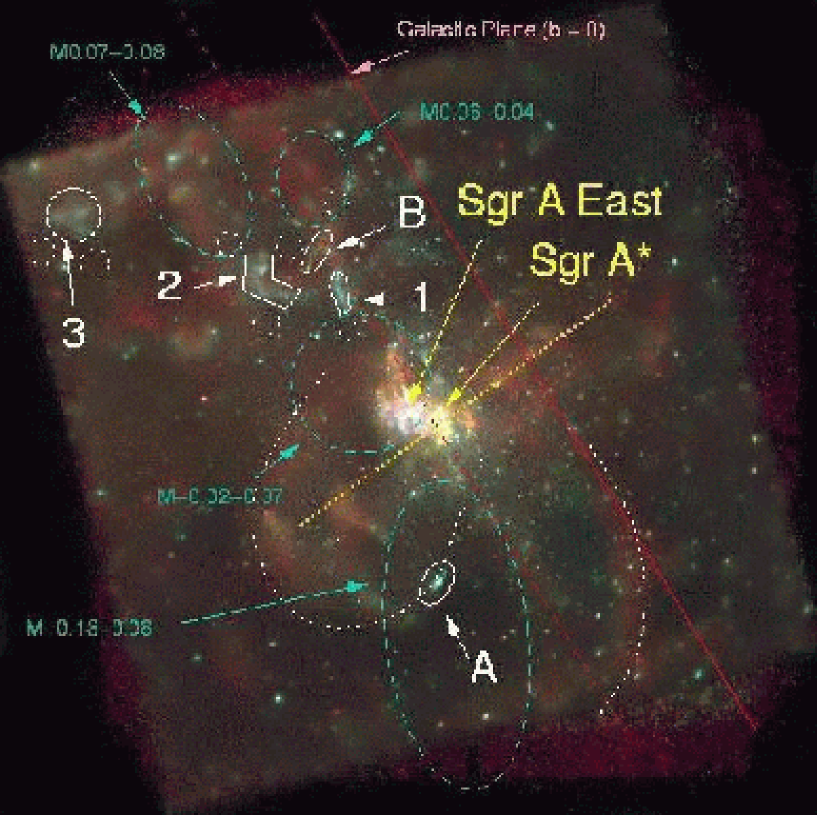
During the monitoring observations of Sgr A* (RA[J2000] = 17h 45m 40s.00, Dec[J2000] = 29∘ 00′ 280), the 17′ 17′ FOV of the ACIS-I array also imaged the interstellar surroundings of Sgr A*, which reveals the complex environment within 20 pc of the Galactic center with unprecedented detail in X-rays (Hereafter, we assume a distance of = 8 kpc to the Galactic center [Reid 1993]). A “true-color” X-ray image of the Galactic center region is presented in Figure 1. Each subband image has been exposure-corrected utilizing the exposure map produced by Muno et al. (2003a), and adaptively smoothed to achieve signal-to-noise (S/N) ratio of 4 by using the CIAO tool csmooth. While over 2000 point-like sources prevail over the FOV, the point source contribution to the observed X-ray flux is 10% and the bulk of the X-ray emission is truly diffuse (Muno et al. 2003a, ). Figure 1 indeed demonstrates the presence of diffuse extended X-ray emission features on a variety of angular scales.
The target object Sgr A* is located near the center of the image where the bright X-ray emission from a massive star cluster within the inner parsec of the Galactic center dominates. The bright diffuse X-ray emission to the immediate east of Sgr A* is the SNR Sgr A East (Maeda et al., 2002). Symmetric lobes of soft X-ray emission extended from Sgr A*, perpendicular to the Galactic plane, are indicated with the yellow dotted line in Figure 1. These features may represent a bipolar outflow from Sgr A*, which are extensively discussed by Baganoff et al. (2003) and Morris et al. (2003, in preparation).
Outside of these complex central regions are larger angular scale (a few arcmin) X-ray features, consisting of a few X-ray “loops” around Sgr A* (e.g., the white dotted curves in Figure 1). The soft nature of these loop-like features is typical of thermal shocks interacting with the Galactic ISM. Considering significant star-forming activities in the Galactic center regions, these red, soft X-ray features are perhaps caused by supernova blast waves or stellar winds/bubbles.
We also detect a few hard X-ray knots and filaments. The bright knot to the south of Sgr A* (region A in Figure 1) is the X-ray counterpart of the bright, nonthermal radio knot in the boundary shell of the SNR G359.920.09 (Ho et al., 1985). We have identified at least one more continuum dominated arc-like feature in the northeast of Sgr A* (region B in Figure 1), which shows a hard photon index. The detailed analysis of these continuum X-ray sources are presented elsewhere (Baganoff et al. 2003; Sakano et al. 2003; Morris et al. 2003, in preparation; Yusef-Zadeh et al. 2003, in preparation). In contrast, some other blue, hard filaments to the northeast of Sgr A* (regions 1, 2, and 3 in Figure 1) exhibit strong neutral Fe Kα line emission (Koyama et al., 1996; Bamba et al., 2002). The origin of these neutral Fe line sources has been elusive (Bamba et al., 2002), and we will discuss the detailed spectral characteristics of these neutral Fe line features in §5.
4 Equivalent Width Images
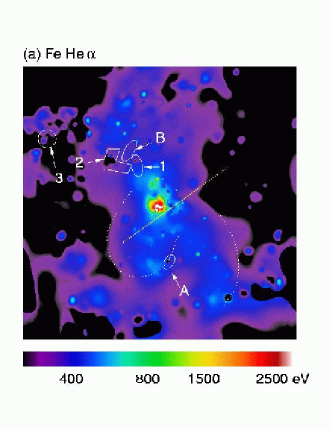
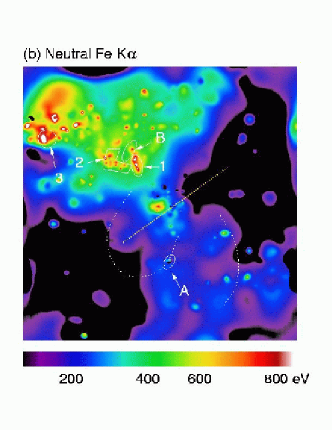
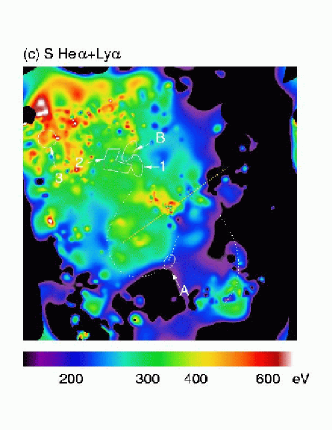
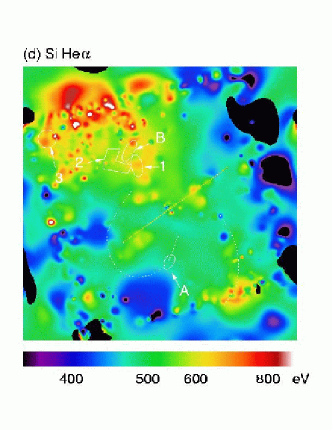
In order to examine the overall distributions of the diffuse emission line features around the Galactic center region, we construct equivalent width (EW) images for the detected atomic emission lines, following the method described by Park et al. (2002). After removing all detected point sources from the broadband image (see Muno et al. [2003a] for the details of the point source detection), subband images for the line and continuum bandpasses were extracted for each spectral line of interest (Table 2). These subband images were adaptively smoothed to achieve a S/N ratio of 3 4. The underlying continuum was calculated by logarithmically interpolating between images made from the higher and lower energy “shoulders” of each broad line. The estimated continuum flux was integrated over the selected line width and subtracted from the line emission. The continuum-subtracted line intensity was then divided by the estimated continuum on a pixel-by-pixel basis to generate the EW images for each element. In order to avoid noise in the EW maps caused by poor photon statistics near the CCD chip boundaries, we have set the EW values to zero where the estimated continuum flux is low. We also set the EW to zero where the integrated continuum flux is greater than the line flux. We present the EW images of the Fe He ( 6.7 keV), the neutral Fe Kα ( 6.4 keV), S He + Ly ( 2.5 keV) and Si He ( 1.8 keV) line emission (Figure 2). We note that cosmic X-ray background (CXB) and the particle background (PB), both of which have not been subtracted in the EW generation, could have contaminated our EW images to some extent. We found that the CXB contribution to the observed fluxes is negligible (1%; e.g., Muno et al. 2003b). The PB contamination appears to be more significant than the CXB and may contribute up to 20%30% of the estimated continuum emission where the surface brightness is low. The EW estimations are thus affected by the PB contamination by up to 20%. This embedded contamination is not however critical for our purposes of the EW images: i.e., we intended to utilize these EW images in order to qualitatively investigate overall variation and distribution of the bright X-ray line emission over the Galactic center region. We do not use the estimated absolute EW values unless the actual regional spectal analysis has been performed. The adaptive smoothing also introduces some systematic uncertainties for the small-scale, faint EW features which we do not rely on for the analysis. The large-scale (arcmin), relatively bright EW features are, on the other hand, consistent with the actual spectral analysis and are reliable in the context with previous observations (see the following discussions and sections). Despite the embedded uncertainties, these EW images are therefore useful as first-order information in order to investigate the overall variation of the X-ray line emission within the FOV and to qualitatively discuss some noticeable characteristics. We also note that the line flux maps as well as the EW maps might also be useful to understand the line emission distributions. Since the line flux maps show the same overall intensity variations as the EW maps, we do not explicitly present the line flux maps although our discussion on the line features is in parts based on the line flux distribution in addition to the EW variations.
The Fe He line EW is generally enhanced along the plane. The enhancements in the Fe He line EW of this Galactic plane component are marginal (roughly around 400 eV), which is consistent with the ASCA measurements of the hard Galactic ridge X-ray emission (GRXE) component ( 8 keV) (Kaneda et al., 1997). This marginal EW enhancements are also consistent with those from the detected point sources in the Galactic center (Muno et al. 2003a, ). A fraction of this Fe He EW should thus originate from unresolved point sources. The substantial EW variations on arcmin scales, however, suggest that a bulk of this hot Fe line emission has a diffuse origin arising from a hot ( 5 10 keV) plasma. Sgr A East is a strong Fe He line source (Maeda et al., 2002), and is immediately recognized as an extremely bright source with an 13 diameter in the center of the Fe He EW image (Figure 2a). The estimated Fe He line EW is 2500 eV 5000 eV within the central 30′′ diameter region of Sgr A East, which is consistent with the results from the spectral analysis by Maeda et al. (2002). This strong Fe EW appears to be from hot Fe-rich ejecta heated by the reverse shock of the SNR Sgr A East as posited by Maeda et al. (2002).
The neutral Fe EW is largely distributed along the plane, and, in contrast to the He-like Fe EW, is strongly enhanced in the northeast of Sgr A* (Figure 2b). The bright, hard Fe knots in the northeast of Sgr A* (regions 1, 2, and 3 in Figure 1) are featureless in the Fe He EW image (Figure 2a), but remarkably bright in the neutral Fe EW image (Figure 2b). The regions to the northeast of Sgr A* are also bright in the Si and S EW images (Figure 2c and Figure 2d). The Si and S maps represent high ionization states in hot thermal plasmas which are typically produced by SNR and/or star-forming activity. The extinction toward the hot S and Si emission in the northeast of Sgr A* is consistent with that of typical column density toward the Galactic center (see §5, also Muno et al. 2003b), which indicates the Galactic center origin of the hot gas rather than a nearby foreground component. It is interesting that these high-ionization-state hot S, Si material and the low-ionization-state cold Fe sources are in general coincident in the northeast of Sgr A*. On the other hand, albeit that the angular resolution and the positional accuracy of the EW images are significantly degraded due to the adaptive smoothing of faint diffuse emission, the one-to-one correlations between the bright S/Si EW and the neutral Fe EW enhancements appear to be weak: i.e., the locations of the strong enhancements of hot and cold gas are probably not “exactly” coincident. These cold, neutral Fe line emitting gas and the hot, ionized S/Si line emitting plasma also appear to have Galactic center molecular cloud counterparts (see §6). These features suggest that the high- and low-ionization-state line emission might be associated with the star-forming/SN activities nearby to the dense molecular cloud complexes in the northeast of Sgr A*. Both of S/Si and neutral Fe EWs are weak in the southwest of Sgr A*, which appears to be caused by intrinscally less activities there (for more discussion, see §6 and §7).
5 X-Ray Spectra
We perform a spectral analysis of a few diffuse emission features, particularly those with strong neutral Fe EWs. The individual ACIS observations comprising our images utilized different roll-angles: i.e., the first three observations have 270∘ roll-angles and the remainder 80∘. The Fe knots have thus been detected on either ACIS-I0 or ACIS-I3 chips depending on the roll-angle. About 85% of the total exposure was taken with roll-angles of 80∘, however, so the bulk of the photons from these Fe knots have been detected on the ACIS-I0 chip. We thus utilize the response matrices appropriate for ACIS-I0. The Fe knots 1, 2, and 3 contain 12000, 24000, and 11000 photons, respectively, and we bin the data to contain a minimum of 60 200 counts per channel for the spectral fitting. These emission features are fairly bright and have well-confined structures, and so we estimate the background contamination by extracting spectra from nearby source-free regions after removing all detected point-like sources from the data. For the spectral analysis of our CTI-corrected data, we utilize the response matrices appropriate for the spectral redistribution of the CCD, as generated by Townsley et al. (2002b). The low energy ( 1 keV) quantum efficiency (QE) of the ACIS has degraded because of the molecular contamination on the optical blocking filter. Although effects from this QE degradation on our heavily absorbed spectra are most likely negligible, we correct this time-dependent QE degradation by modifying the ancillary response function (ARF) for each extracted spectrum by utilizing the IDL ACISABS software111For the discussion on this instrumental issue, see http://cxc.harvard.edu/cal/Acis/Cal_prods/qeDeg/index.html. The software was developed by George Chartas and is available at http://www.astro.psu.edu/users/chartas/xcontdir/xcont.html..
The X-ray spectral characteristics of knots 1 and 2 are similar to each other: i.e., a strong 6.4 keV Fe emission line with underlying power-law continuum of photon index 2 3 (Figure 3a and Figure 3b). Both spectra are heavily absorbed ( 3.5 1023 cm-2) and the photon fluxes are insignificant below 4 keV. We thus present the best-fit parameters based on spectral fittings in the 4 8 keV band (Table 3). The measured EW of the Fe line is 1 keV for both features, which is consistent with that of the Sgr C cloud (Murakami et al. 2001a, ). We note that the knot 1 spectrum may also suggest the presence of an Fe Kβ line at 7 keV (Figure 3a). We have added another Gaussian line component in order to fit this weak feature, assuming a narrow line width. The best-fit Kβ line center energy is 7.02 keV with an EW of 200 eV. The measured Kβ to Kα line flux ratio is 0.140.03. This Kβ line feature is not apparent in the knot 2 spectrum, at least with the current data. We place an upper limit (2) on the Kβ line EW of 120 eV for knot 2.
The Fe knot 3 spectrum shows the same characteristics as the spectrum of the other two knots in the hard X-ray band ( 4 keV): i.e., a strong 6.4 keV Fe Kα line with underlying continuum of 1.8 (Figure 3c). The measured 6.4 keV Fe line EW is 1.3 keV. This spectrum also appears to show a weak Fe Kβ line feature as seen in the knot 1 spectrum. The best-fit line center energy of this weak feature, the measured EW, and the line flux ratio between Kβ to Kα lines are consistent with those of knot 1. The knot 3 spectrum, on the other hand, is less absorbed ( 1.5 1023 cm-2) than knots 1 and 2, revealing remarkably different features than knots 1 and 2 in the soft band ( 4 keV; Figure 3c). The soft band X-ray spectrum of knot 3 is dominated by thermal emission with a strong S He line. For comparison, a single power law model fit is relatively poor ( = 1.4) and the inclusion of an additional thermal plasma model improves the overall fit significantly based on an F-test. The strong S line emission from the soft component of the knot 3 spectrum indicates X-ray emission from a thermal plasma having an electron temperature of 0.3 keV. The metal abundance for the soft component appears to be high and is best-fitted with a few times solar, although unconstrained with the current data (e.g., a 2 lower limit is 0.5 solar). This soft thermal component appears to be associated with the Galactic center molecular clouds (§ 6), suggesting its location in the Galactic center instead of a nearby foreground origin. The spectral fit with a two-component absorption for knot 3 indeed indicates a significant foreground column (NH 1 1023 cm-2) even only for the soft thermal component. The nearby foreground origin for this soft thermal emission is therefore unlikely. The best-fit parameters for the knot 3 spectrum are presented based on the spectral fitting in the 2 8 keV band (Table 3).
6 Molecular Line Emission
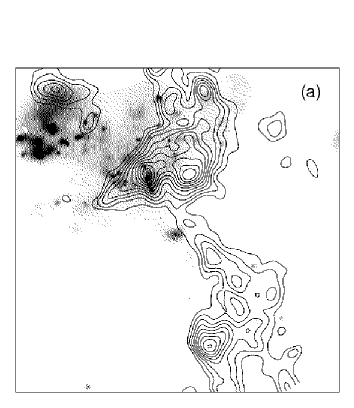
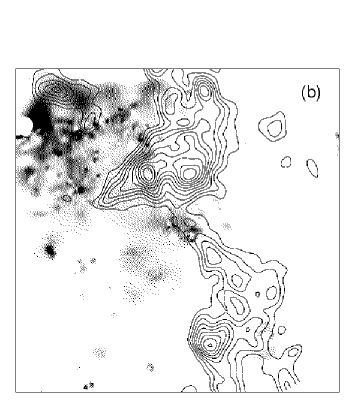
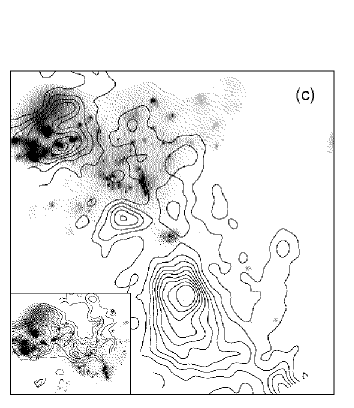
The spatial distribution and spectral X-ray characteristics revealed by the data suggest that some of the diffuse X-ray emission features in the Galactic center be associated with the cold, dense component of the ISM and/or active star-forming regions. We thus examine Galactic center molecular cloud maps in order to investigate correspondences between dense clouds and the detected X-ray emission features. Considering the high molecular densities in the Galactic center region, the CS molecule, with its relatively high critical density, (H2) 104 cm-3, is an appropriate tracer of dense molecular clouds there. The CS line maps are, unlike those of CO, expected to be nearly free of strong contamination by the Galactic disk and are more representative of the molecular column density rather than the surface temperatures of clouds (Tsuboi et al. 1999 and references therein). The CS data also provide an angular resolution of 30′′ (Tsuboi et al. 1999), allowing a meaningful cross-comparison with the high resolution Chandra image. We have thus searched for potential molecular cloud counterparts to X-ray features by investigating various velocity components of the 49 GHz CS (J = 10) line emission (Tsuboi et al., 1999).
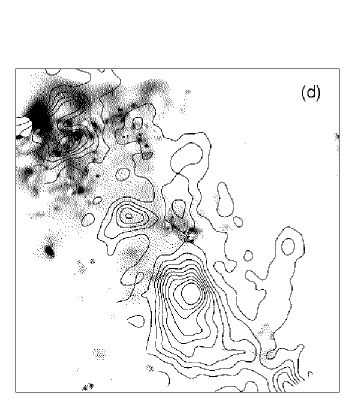
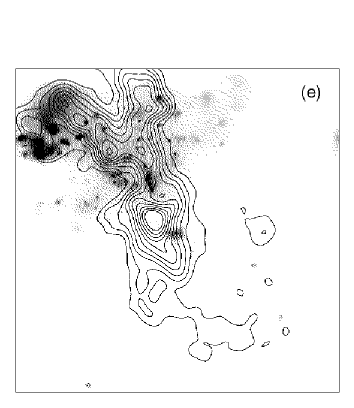
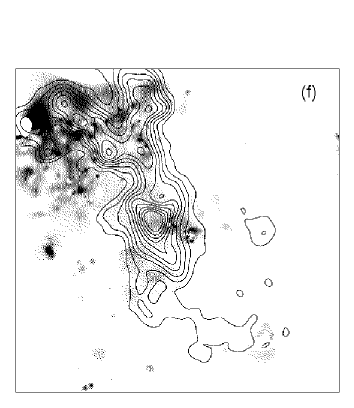
The overall distribution of dense molecular clouds in the velocity range = 25 to 50 km s-1 is along the Galactic plane, and we compare their distributions with our EW images of neutral Fe and highly ionized S line emission (Figure 4). The molecular cloud contours in the presented velocity ranges display a general correspondence with the X-ray emission-line EW distributions, particularly to the northeast of Sgr A*. The detailed comparisons indeed suggest an intimate relationship, but higher spatial resolution in the molecular line maps will be required to unambiguously demonstrate the nature and geometry of the physical relationship. The +40 to +50 km s-1 clouds, which, according to Vollmer et al. (2003), are located close to, but slightly in front (5 pc) of Sgr A*, are well correlated spatially with the S and the neutral Fe EW images throughout the region to the northeast of Sgr A* (Figure 4e and Figure 4f). The most prominent cloud at +10 to +30 km s-1 – the “20 km s-1 molecular cloud” located to the south of Sgr A* – is located substantially in front (20 50 pc) of Sgr A* (Zylka et al., 1990; Vollmer et al., 2003), and does not show an X-ray emission line counterpart. In this same velocity range, there is a smaller molecular cloud in the northeast corner of the FOV (Figure 4c and Figure 4d) which is adjacent to the radio Arc and may be interacting with the Arc (Tsuboi et al., 1997). This cloud also appears to be spatially correlated with the most prominent emission in the EW images, and with knot 3 in particular. This correlation may be best demonstrated by the high angular resolution 98 GHz CS (J=21) data (Tsuboi et al., 1997) overlaid with the neutral Fe line EW image (see the lower-left corner inset in Figure 4c). The line-of-sight locations of the negative velocity clouds remains undetermined. Except for knot 1 (see below), the molecular emission in the 25 to 5 km s-1 range appears to be anti-correlated with the S and neutral Fe EW maps in the northeast corner of the FOV (Figure 4a and 4b). Some of the bright, hard X-ray filaments have interesting spatial correspondences with CS clouds. Knot 1 falls upon a strong CS line peak at negative velocities (Figure 4a), although it also coincides with a prominent ridge in the +50 km s-1 cloud (Figure 4e). Knot 2 is superimposed on the edge of those same molecular clouds, so its relationship with those clouds, if any, is unclear. And, as mentioned above, Knot 3 has plausible molecular counterparts in the velocity ranges +10 to +30 km s-1 and +40 to +50 km s-1 (Figure 4c and Figure 4e).
Toward the south and the southwest of Sgr A*, the overall broadband surface brightness, as well as the Si and S line fluxes, are relatively low, and little correspondence with molecular gas is evident. The foreground “20 km s-1” cloud, as represented by the emission integrated from +10 to +30 km -1 in Figures 4c and 4d, is prominent in this region. This dense molecular cloud complex ( 2 104 cm-3) implies a significant column density ( 4 1023 cm-2) and a correspondingly large visual extinction, 400 mag (Zylka et al., 1990), so this cloud should be optically thick in the soft X-ray band. This possibly accounts for the observed low intensities in the broadband surface brightness and for the soft X-ray line fluxes to the south of Sgr A*. The relative lack of detected X-ray point sources toward this 20 km s-1 cloud (Muno et al. 2003a, ) is consistent with a strong absorption effect. We also note that the Si, S, and neutral Fe line fluxes and the EWs to the southwest of Sgr A* where the negative velocity cloud is present, but where the 20 km s-1 cloud is absent, are weak. This stands in contrast to the strong line emission in Si, S, and neutral Fe toward dense clouds in the northeast portion of the FOV. The low line fluxes in this southwest region cannot be caused by absorption in the 20 km s-1 cloud simply because of the absence of this cloud in this direction. It is also unlikely to be caused by absorption in the negative velocity cloud because there is no evidence for substantial obscuration of the X-ray point sources in this southwest region toward the negative velocity cloud (Muno et al. 2003a, ). Thus, the weak X-ray line features to the southwest of Sgr A*, where the 20 km s-1 cloud is absent, appear to be intrinsic: that is, this region is lack of supernova activity, or perhaps of energetic star-forming activity compared to the northeast regions.
Based on the spectral analysis presented in §5, we realize that the characteristics of the knot 3 spectrum are consistent with those of knot 1, except for the low absorbing column density which reveals the soft thermal component. The column density toward knot 3 ( 1.5 1023 cm-2) is consistent with typical columns to the Galactic center (Sakano et al., 1998). Knot 1 (and 2), on the other hand, has significantly higher column ( 3.5 1023 cm-2). We speculate that the larger column for knot 1 (and 2) might be attributable to the negative velocity molecular cloud in this direction. Consistent with this hypothesis is the fact that SgrA East, which has the same column as knot 3 (Maeda et al., 2002), is not coincident with emission in the 25 to 5 km s-1 CS map (Figure 4). The apparent angular size of the 25 to 5 km s-1 cloud to the northeast of Sgr A* is 6′, so the physical extent is 15 pc. If the bulk of the excess column toward knot 1 ( 2 1023 cm-2) is attributed to this cloud, a cloud density of 4 103 cm-3 is implied. Assuming a simple spherical geometry for the cloud, the total mass of the cloud is 2 105 . Albeit crude estimates, the derived density and mass of the cloud are not unreasonable compared with other giant molecular cloud complexes in the Galactic center. Based on these X-ray absorption features, we therefore propose that this cloud is in the “foreground” of Fe knot 1 (and 2), although some portions appear to be associated with knot 1 itself. The soft X-ray emission to the northeast of Sgr A*, as presented by the S EW images (Figure 4b), is apparently anti-correlated with the negative velocity CS emission, which can be accounted for by the presence of this absorbing foreground cloud.
7 DISCUSSION
7.1 Neutral Iron Line Emission
The bright, hard X-ray filaments to the northeast of Sgr A* stand out for having strong neutral Fe emission. The spectral characteristics of Knot 1, for example, are consistent with those of the Sgr B2 and Sgr C clouds, both of which have been plausibly described by an XRN model illuminated by past activity of Sgr A* (Murakami et al., 2000; Murakami et al. 2001a, ; Murakami et al. 2001b, ). Knot 1 has a cometary morphology, with the “head” in the north and extended south by 1′, along a minor ridge of the negative velocity CS cloud. The spectral features of the strong 6.4 keV Fe Kα line, a weak 7.02 keV Fe Kβ line, and the underlying continuum with 2 are typical for the proposed XRN model (Koyama et al., 1996; Murakami et al., 2000). While the Fe Kα EW of 1 keV is weaker than that from the Sgr B2 XRN (Murakami et al., 2000), it nonetheless suggests that the Fe line emission is dominated by irradiation from external sources (Sunyaev & Churazov 1998 and references therein). Since the Thomson cross-section is dependent on the scattering angle of the incident photon, while the fluorescent line emission is isotropic, the observed EW – the ratio of fluorescent line intensity to the scattered continuum – is inversely proportional to 1 + cos2, where is the angle subtended at the scatterer between the observer and the illuminating source. If we assume that Sgr A* was the primary external illuminating source for knot 1, the lower Fe EW for the knot 1 spectrum, relative to that of Sgr B2, therefore suggests that is near 0 or and thus that the primary reflecting cloud toward knot 1 is located in front of or behind the plane between Sgr A* and Sgr B2. (The EW may as well depend on other cloud parameters, such as the optical depth, abundances, and the ionization state. Extensive studies of the determinants of the EW characteristics may thus require detailed XRN simulations, which are beyond the scope of the current work.) The Fe Kβ to Kα line flux ratio, 0.15, is consistent with the laboratory prediction for the XRN model (Murakami et al. 2001b, ). The sharp absorption edge at 7.1 keV is also in good agreement with previously reported XRN interpretations (Murakami et al. 2001a, ; Murakami et al. 2001b, ). The strong neutral Fe line emission from Knot 1 is thus well described by the XRN model. Knot 2 shares the overall spectral characteristics of knot 1. However, the molecular counterpart is weak or absent for knot 2, and the apparent absence of the Fe Kβ line in the knot 2 spectrum is problematical for the XRN model. The identification of knot 2 as an XRN might thus be inconclusive.
The knot 3 spectrum shows similar features to the knot 1 spectrum in the hard band ( 4 keV), but reveals a substantial contribution from a thermal component in the soft band ( 4 keV). The implied electron temperature ( 0.3 keV) and likely high abundances might be suggestive of emission from SN ejecta heated by a blast wave reverse shock. This suggested contribution from SNR(s) to the observed knot 3 spectrum is not surprising because there are dense molecular cloud complexes in these regions of the Galactic center, which may contain active star-forming regions. In fact, the CS maps indicate associations of dense clouds with the X-ray emitting material at the position of knot 3 (Figures 4c,4d,4e, and 4f).
Based on the XRN model, a past state of dramatically enhanced activity of Sgr A*, with an X-ray luminosity of 1039 ergs s-1, has been proposed as the primary external illuminating source for the Sgr B2 and Sgr C clouds (Murakami et al., 2000; Murakami et al. 2001b, ). The overall large-scale geometry of the neutral Fe EW enhancements to the northeast of Sgr A* is consistent with the Fe emission lying predominantly within a conical region with an apex toward Sgr A* (Figure 2b). We thus consider that Sgr A* might have also been the external irradiating source for the detected neutral Fe knots. In the reflection models, the luminosity of the irradiating external source can be derived in terms of the observed 6.4 keV photon flux, the distance to the reflecting cloud from the source, and the apparent angular size of the cloud as viewed from the source position (Sunyaev & Churazov, 1998; Murakami et al., 2000). Assuming a solar abundance for Fe and a Thomson scattering depth T 0.1 ( 1023 cm-2), we derive an irradiating luminosity from Sgr A*, 1035 ergs s-1 for knot 1 and 1036 ergs s-1 for knot 3. These luminosities are 2 3 orders of magnitude higher than that of the quiescent state flux of Sgr A* (Baganoff et al., 2001), but only 0.1% of those which might have produced the XRNe in Sgr B2 and Sgr C clouds. The X-ray luminosity of Sgr A* from the recently detected 3 hr flaring event ( 1035 ergs s-1; Baganoff et al. [2001]) is comparable to the derived irradiating luminosity. Considering the physical sizes of these Fe knots (2 pc for the angular sizes of 1′ at = 8 kpc), however, the duration of the irradiating event must have been a few years or longer instead of on the order of hours. The inferred Sgr A* activity, if it was the irradiating source, should thus have been persistent much longer than the observed short flares.
The inferred irradiating luminosities might have also been generated by Galactic transient sources such as low mass X-ray binaries. There are likely a number of transient sources in active regions such as the Galactic center. In fact, several transient X-ray sources have been detected near the Galactic center with X-ray luminosities of 1035 1038 ergs s-1 (e.g., Branduardi et al. 1976; Maeda et al. 1996; Pavlinsky et al. 1994). Although durations of X-ray transient outbursts can be as long as a decade, typical burst periods are relatively short on the order of months. (e.g., Wijnands 2001). The nearby X-ray transient sources may thus not be completely ruled out as contributors to the observed neutral Fe line emission, but unlikely. In terms of continuous irradiation sources, it is noteworthy that the derived irradiating fluxes are consistent with the X-ray luminosity of Sgr A East (Maeda et al., 2002). The sky position of Sgr A East is between Sgr A* and the Fe knots, and so the steady emission from Sgr A East might have also contributed the reflected neutral Fe line emission at the positions of the observed Fe knots. The measured temperatures for Sgr A East, 2 keV with Chandra (Maeda et al., 2002) and 4 keV with XMM-Newton (Sakano et al., 2002), however, appear to be too soft to produce a strong Fe line at = 6.4 keV. Moreover, if Sgr A East is a steady illuminating source capable of producing the observed XRN features, a strong 6.4 keV Fe line feature would also have been expected from the nearby neutral ISM, for example, the circumnuclear disk of Sgr A* (e.g., Latkoski et al. 1999 and references therein), which is apparently not the case. Steady emission from Sgr A East is thus ruled out as a primary irradiating source.
Alternatively, the characteristic 6.4 keV Fe line emission may originate from unresolved SN ejecta. Fast nonthermal particles accelerated by the Fermi mechanism in collisionless magnetohydrodynamic shocks diffuse through cold, metal-rich ejecta knots, and produce low-ionization-state Kα line X-ray emission (Bykov, 2002). This is most effective when the ejecta knot is propagating through dense clouds ( 1000 cm-3) (Bykov, 2002). The model predicts an underlying, non-thermal bremsstrahlung continuum which is harder ( 1.5) than that expected from the XRN model ( 2). X-ray line broadenings caused by the fast-moving unresolved SN ejecta are also expected. The presence of the soft thermal component, particularly in knot 3, could be apparent evidence for such a contribution from unresolved SN ejecta. Although the observed continuum of knot 3 appears to be softer than the typical prediction from the SN ejecta model, the large uncertainties on the best-fit photon index of the observed underlying continuum still make the ejecta model a plausible candidate to describe the spectum. Although a soft thermal component is not detected from knot 1 and knot 2, the neutral Fe line characteristics are nearly identical for all of these knots. The absence of soft thermal component from knot 1 and knot 2 may thus be merely due to absorption, and then the supernova ejecta model cannot be ruled out as a source of knot 1 and knot 2 as well. The estimated Fe line luminosity ( 1033 ergs s-1) can be produced by fast-moving ejecta from a single SN explosion interacting with a dense molecular cloud (Bykov, 2002). We note that large-scale correlations between the neutral Fe line and the SiO (J=10) emission in the Galactic center regions have been observed (Martin-Pintado et al., 2000). This gas phase SiO emission due to grain processing by strong shocks, being spatially coincident with the 6.4 keV Fe line features, may support the SN ejecta origin of the neutral Fe line emission in the Galactic center.
One way to distinguish between the XRN and SN ejecta models is to make conclusive measurements of the Fe line broadenings. The detector position of knot 3 is close to the CCD readout (rows 256), so that the energy resolution is achieved down to the instrumental limit (150 eV FWHM) (Garmire et al., 2003). The measured line width of the 6.4 keV line is then = 10 eV for the fitted Gaussian line profile. This is only a weak detection of line width, yet suggests that the Fe line width might have been resolved, thus indicating a line broadening in this region. If confirmed (by follow-up observations), this line broadening would provide support for the contribution from unresolved SN ejecta to the observed neutral Fe line emission. Observations with instruments of good spectral resolution such as Astro-E2 should be helpful for this purpose. Better constraints on the photon index of the underlying continuum may also be helpful in order to understand the detailed nature of these features. Follow-up deep observations with XMM-Newton, by utilizing the high sensitivity compared to the Chandra/ACIS, would be useful for this purpose. The SN ejecta model also predicts strong infrared emission from the radiative shocks that accompany ejecta fragments (Bykov, 2002), and so infrared line observations would help to discriminate models as well. Although the SN ejecta contribution to the observed neutral Fe line emission appears to be plausible, we note a caveat that non-thermal radio emission features have not been reported in the northeast regions of Sgr A* within the ACIS FOV. This absence of the non-thermal radio features is thus admittedly a difficult problem in terms of the SNR interpretation.
7.2 Thermal X-Ray Emission
The presence of highly ionized elemental species, Si, S, and Fe indicates that thermal diffuse X-ray emission, as well as the nonthermal component, also prevails in the Galactic center. These emission lines from the He-like species over the wide range of photon energies ( 2 keV for Si/S and 7 keV for Fe) confirm the multiple-temperature origin for the diffuse thermal emission in the Galactic center/plane as indicated by the ASCA data (e.g., Kaneda et al. 1997). The thermal components are, with some exceptions of bright features near Sgr A*, relatively faint and large-scale features. The direct spectral analysis of this diffuse thermal emission thus requires substantially more careful treatment than the bright, well-confined, nonthermal neutral Fe line features. We will present the extensive spectral analysis of the Galactic center thermal diffuse X-ray emission in subsequent papers (Muno et al. 2003b; Morris et al. 2003, in preparation). We here qualitatively discuss the overall characteristics of the thermal emission based primarily on the image analysis.
The Si and S line EWs trace enhancements of the soft component of the thermal emission, which is enhanced to the northeast of Sgr A* (Figure 2c and Figure 2d). These regions are close to the radio Arc and the Arches cluster, where the formation of massive stars has taken place in at least two episodes over the past 5 million years (Figer et al. 1999; Yusef-Zadeh et al. 2002). Massive Galactic center molecular clouds are present in these regions (c.f., § 6), so the observed Si and S line emission most likely arises from the hot ISM heated by powerful stellar winds and/or supernova blast waves. As we have discussed in previous sections, the overall broadband X-ray surface brightness and the S/Si EWs are low in the southwest regions, which is uncorrelated with the absorption effect. This suggests that the active star forming processes are present only in the northeast of Sgr A* and that such activity is not manifested in the southwest. Knot 3 provides a sample spectrum of this soft thermal component. As presented in the previous section, this thermal spectrum shows characteristics typical of hot plasma produced by SNRs. The ASCA observations of the GRXE have successfully demonstrated that the soft component emission in the plane can be furnished by SNRs with a SN rate of one per century (Kaneda et al., 1997). For the case of knot 3, the angular size of the emission region (1′) corresponds to 2 pc at a distance of 8 kpc, which is typical for young Galactic SNRs, but might also be of a relatively older age in a dense environment such as the Galactic center.
The hard thermal component is representd by the He-like Fe line EW (Figure 2a). Except for the brightest central feature of Sgr A East, the highly ionized Fe line emission is primarily distributed along the plane. In contrast to the other EWs in Figure 2, this hot Fe emission shows no particular enhancements in the northeast of Sgr A*. The ASCA data suggested that this hot component might not be adequately described by the SNRs, because such a hot plasma may not be confined in the plane by the Galactic gravity and/or by typical interstellar pressure (Koyama et al. 1986a, ). In order to maintain this hot plasma in the plane, a high SN rate and a low ionization state of the plasma are required (Koyama et al. 1986b, ; Yamauchi & Koyama, 1995). The electron temperature of the plasma required to produce the observed strong 6.7 keV Fe line emission ( = 5 10 keV) is also unusually high for typical SNRs, although we do detect the 6.7 keV Fe line from metal-rich ejecta in young SNRs (e.g., Hughes et al. 2000; Lewis et al. 2003). This hot gas with 510 keV might rather have been produced when cooler plasma is confined and compressed by strong Galactic magnetic fields (Makishima, 1997). The required magnetic field strength to achieve this is = 2030 G. The interstellar magnetic field in the Galactic center ( 1 mG, e.g., Yusef-Zadeh & Morris 1987; Lang et al. 1999) is sufficiently high for this model. This magnetic confinement model might not require recent massive star-forming activity or SN explosions in order to produce the observed hot plasma. The relatively uniform distribution of the He-like Fe EW along the plane may also indicate this hot plasma’s association with the strong magnetic field in the Galactic center along the plane rather than with star-forming regions.
8 SUMMARY AND CONCLUSIONS
Deep Chandra/ACIS observations of the Galactic center reveal a complex spatial and spectral structure of diffuse X-ray emission with significant photon statistics. The thermal (e.g., hot Si and S) and nonthermal (e.g., neutral Fe) X-ray line emission is generally enhanced in a region lying to the northeast of Sgr A*, a region in which massive star-formation has been active over the past 5 million years (e.g., the Arches cluster), and in which dense Galactic center molecular clouds are currently present. The highly ionized line emission from Si and S in these regions is therefore most likely associated with the hot ISM heated by the shocks from SNe and/or massive stellar winds, while shocks interacting with dense, cold ISM may produce emission in the neutral Fe line. Curiously, we detect little or no enhancement of the emission lines to the south and southwest of Sgr A*. This weak line emission to the south is apparently the result of an absence of activity there, in contrast to the northeast regions, and it is owed in part to the substantial absorption by the foreground 20 km s-1 cloud. In contrast, the highly ionized He-like Fe line emission shows a more uniform distribution along the plane, with no apparent enhancements to the northeast of Sgr A*. This feature suggests that the young star-forming and/or SNe activities have less effect on the He-like Fe distribution than they do on the neutral Fe line emission. The hot Fe line emission might rather be caused by the hot ISM trapped and then heated by the strong Galactic center magnetic fields.
The spectral characteristics of the strong neutral Fe line emitting features to the northeast of Sgr A* are plausibly described by the XRN model. We identify dense molecular counterparts for these Fe knots, which is strong support for the hypothesized XRN origin. If past activity of Sgr A* is the primary external illuminating source, the required luminosities are 10351036 ergs s-1 with durations of at least a few years. Alternatively, nonthermally-accelerated electrons by SN shocks penetrating back into dense, cold supernova ejecta may also explain the observed neutral Fe line features. The presence of active star-forming regions and the dense molecular clouds near the neutral Fe features are supportive of this scenario. Unambiguous discriminations between these models are however difficult with the current data. Follow-up observations with the current and upcoming observatories may be helpful for a detailed understanding of the origins for these features.
References
- Baganoff et al. (2001) Baganoff, F. K., Bautz, M. W., Brandt, W. N., Chartas, G., Feigelson, E. D., Garmire, G. P., Maeda, Y., Morris, M., Ricker, G. R., Townsley, L. K., & Walter, F. 2001, Nature, 413, 45
- Baganoff et al. (2003) Baganoff, F. K., Maeda, Y., Morris, M., Bautz, M. W., Brandt, W. N., Cui, W., Doty, J. P., Feigelson, E. D., Garmire, G. P., Pravdo, S. H., Ricker, G. R., & Townsley, L. K. 2003, ApJ, 591, 891
- Bamba et al. (2002) Bamba, A., Murakami, H., Senda, A., Takaki, S., Yokogawa, J., & Koyama, K. 2002, Proceedings of the Symposium ”New Visions of the X-ray Universe in the XMM-Newton and Chandra era”, Noordwijk-NL, Nov. 2001 (astro-ph/0202010)
- Branduardi et al. (1976) Branduardi, G., Ives, J. C., Sanford, P. W., Brinkman, A. C., & Maraschi, L. 1976, MNRAS, 175, 47
- Bykov (2002) Bykov, A. M. 2002, A&A, 390, 327
- Figer et al. (1999) Figer, D. F., Kim, S. S., Morris, M., Serabyn, E., Rich, R. M. & McLean, I. S. 1999, ApJ, 525, 750
- Garmire et al. (2003) Garmire, G. P., Bautz, M. W., Ford, P. G., Nousek, J. A., & Ricker, Jr., G. R. 2003, “X-Ray and Gamma-Ray Telescopes and Instruments for Astronomy”, Proceedings of SPIE, ed., J. E. Trümper & H. D. Tananbaum, Vol. 4851, 28
- Ho et al. (1985) Ho, P. T., Jackson, J. M., Barrett, A. H., & Armstrong, T. 1985, ApJ, 288, 575
- Hughes et al. (2000) Hughes, J. P., Rakowski, C. E., Burrows, D. N., & Slane, P. O. 2000, ApJ, 528, L109
- Kaneda et al. (1997) Kaneda, H., Makishima, K., Yamauchi, S., Koyama, K., Matsuzaki, K., & Yamasaki, N. Y. 1997, ApJ, 491, 638
- (11) Koyama, K., Makishima, K., Tanaka, Y., & Tsunemi, H. 1986, PASJ, 38, 121
- (12) Koyama, K., Ikeuchi, S., & Tomisaka, K. 1986b, PASJ, 38, 503
- Koyama et al. (1989) Koyama, K., Awaki, H., Kunieda, H., Takano, S., Tawara, Y. 1989, Nature, 339, 603
- Koyama et al. (1996) Koyama, K., Maeda, Y., Sonobe, T., Takeshima, T., Tanaka, Y., & Yamauchi, S. 1996, PASJ, 48, 249
- Lang et al. (1999) Lang, C., Morris, M., & Echevarria, L. 1999, ApJ, 526, 727
- Latvakoski et al. (1999) Latvakoski, H. M., Stacey, G. J., Gull, G. E., & Hayward, T. L. 1999, ApJ, 511, 761
- Lewis et al. (2003) Lewis, K. T., Burrows, D. N., Hughes, J. P., Slane, P. O., Garmire, G. P., & Nousek, J. A. 2003, ApJ, 582, 770
- Maeda et al. (1996) Maeda, Y., Koyama, K., Sakano, M., Takeshima, T., & Yamauchi, S. 1996, PASJ, 48, 417
- Maeda et al. (2002) Maeda, Y., Baganoff, F. K., Feigelson, E. D., Morris, M., Bautz, M. W., Brandt, W. M., Burrows, D. N., Doty, J. P., Garmire, G. P., Pravdo, S. H., Ricker, G. R., & Townsley, L. K. 2002, ApJ, 570, 671
- Makishima (1997) Makishima, K. 1997, in X-ray Imaging and Spectroscopy of Cosmic Hot Plasmas, ed., F. Makino (Tokyo: Universal Academy Press), 137
- Martin-Pintado et al. (2000) Martin-Pintado, J., de Vicente, P., Rodriguez-Fernández, N. J., Fuente, A., & Planesas, P. 2000, A&A, 356, L5
- Morris (1993) Morris, M. 1993, ApJ, 408, 496
- (23) Muno, M. P., Baganoff, F. K., Bautz, M. W., Brandt, W. N., Broos, P. S., Feigelson, E. D., Garmire, G. P., Morris, M. R., Ricker, G. R., & Townsley, L. K. 2003a, ApJ, 589, 225
- (24) Muno, M. P., Baganoff, F. K., Bautz, M., Broos, P. S., Feigelson, E. D., Garmire, G. P., Morris, M. R., Park, S., Ricker, G. R., & Townsley, L. K. 2003b, ApJ, Submitted
- Murakami et al. (2000) Murakami, H., Koyama, K., Sakano, M., & Tsujimoto, M. 2000, ApJ, 534, 283
- (26) Murakami, H., Koyama, K., Tsujimoto, M., Maeda, Y., & Sakano, M. 2001a, ApJ, 550, 297
- (27) Murakami, H., Koyama, K., & Maeda, Y. 2001b, ApJ, 558, 687
- Park & Ebisawa (2001) Park, S., & Ebisawa, K., 2001, ApJ, 547, 777
- Park et al. (2002) Park, S., Roming, P. W. A., Hughes, J. P., Slane, P. O., Burrows, D. N., Garmire, G. P., & Nousek, J. A., 2002, ApJ, 564, L39
- Pavlinsky et al. (1994) Pavlinsky, M. N., Grebenev, S. A., & Sunyaev, R. A. 1994, ApJ, 425, 110
- Reid (1993) Reid, M. J. 1993, ARA&A, 31, 345
- Sakano et al. (1998) Sakano, M., Mishiuchi, M., Maeda, Y., Koyama, K., & Yokogawa, J. 1998, IAUS, “The Central Regions of the Galaxy and Galaxies”, ed., Y. Sofue (London: Kluwer), 184, 443
- Sakano et al. (2002) Sakano, M., Warwick, R. S., & Decourchelle, A. 2002, the proceedings of “Japan-Germany Workshop on Galaxies and Clusters of Galaxies”, Shuzenji, Japan, (astro-ph/0212464)
- Sakano et al. (2003) Sakano, M., Warwick, R. S., Decourchelle, A., & Predehl, P. 2003, MNRAS, 340, 747
- Sanders et al. (1984) Sanders, D. V., Solomon, P. M., & Scoville, N. Z. 1984, ApJ, 276, 182
- Sidoli & Mereghetti (1999) Sidoli, L., & Mereghetti, S. 1999, A&A, 349, L49
- Skinner et al. (1987) Skinner, G. K., Willmore, A. P., Eyles, C. J., Bertram, D., & Church, M. J. 1987, Nature, 330, 544
- Sunyaev et al. (1993) Sunyaev, R., Markevitch, M., & Pavlinsky, M. 1993, ApJ, 407, 606
- Sunyaev & Churazov (1998) Sunyaev, R., & Churazov, E. 1998, MNRAS, 297, 1279
- Townsley et al. (2000) Townsley, L. K., Broos, P. S., Garmire, G. P., & Nousek, J. A. 2000, ApJ, 534, L139
- (41) Townsley, L. K., Broos, P. S., Nousek, J. A., & Garmire, G. P. 2002a, Nuclear Instruments & Methods in Physics Research Section A, 486, 751
- (42) Townsley, L. K., Broos, P. S., Chartas, G., Moskalenko, E., Nousek, J. A., & Pavlov, G. G. 2002b, Nuclear Instruments & Methods in Physics Research Section A, 486, 716
- Tsuboi et al. (1997) Tsuboi, M., Ukita, N. & Handa, T. 1997, ApJ 481, 263
- Tsuboi et al. (1999) Tsuboi, M., Handa, T. & Ukita, N. 1999, ApJS, 120, 1
- Valinia & Marshall (1998) Valinia, A., & Marshall, F. E., 1998, ApJ, 505, 134
- Vollmer et al. (2003) Vollmer, B., Zylka, R., & Duschl, W. J. 2003, A&A, in press (astro-ph/0306200)
- Wijnands (2001) Wijnands, R. 2001, in proceedings of the 113th Meeting of the Astronomical Society of the Pacific, “The High Energy Universe at Sharp Focus: Chandra Science” (astro-ph/0107600)
- Yamauchi & Koyama (1995) Yamauchi, S., & Koyama, K. 1995, PASJ, 47, 439
- Yusef-Zadeh & Morris (1987) Yusef-Zadeh, F., & Morris, M. 1987, ApJ, 320, 545
- Yusef-Zadeh et al. (2002) Yusef-Zadeh, F., Law, C., Wardle, M., Wang, Q. D., Fruscione, A., Lang, C. C., & Cotera, A. 2002, ApJ, 570, 665
- Zylka et al. (1990) Zylka, R., Mezger, P. G., & Wink, J. E. 1990, A&A, 234, 133
| ObsID | Date | Exposure (ks) |
|---|---|---|
| 0242 | 1999-09-21 | 41 |
| 1561a | 2000-10-26 | 36 |
| 1561b | 2001-07-14 | 14 |
| 2943 | 2002-05-22 | 35 |
| 2951 | 2002-02-19 | 12 |
| 2952 | 2002-03-23 | 12 |
| 2953 | 2002-04-19 | 12 |
| 2954 | 2002-05-07 | 12 |
| 3392 | 2002-05-25 | 167 |
| 3393 | 2002-05-28 | 158 |
| 3663 | 2002-05-24 | 38 |
| 3665 | 2002-06-03 | 90 |
| Elements | Line | LowaaThe high and low energy bands around the selected line energies used to estimate the underlying continuum. | HighaaThe high and low energy bands around the selected line energies used to estimate the underlying continuum. |
|---|---|---|---|
| (eV) | (eV) | (eV) | |
| Si (He) | 1700 1900 | 1550 1640 | 2100 2150 |
| S (He + Ly) | 2350 2700 | 2100 2150 | 2730 2810 |
| Fe (neutral) | 6250 6500 | 5000 6100 | 7150 7300 |
| Fe (He) | 6550 6800 | 5000 6100 | 7150 7300 |
| Name | / | Fe Line | EW | FluxaaThe 2 10 keV band X-ray flux in the units of 10-13 ergs s-1 cm-2. | aaThe 2 10 keV band X-ray flux in the units of 10-13 ergs s-1 cm-2. | / | |
|---|---|---|---|---|---|---|---|
| - /(keV) | (1022 cm-2) | Center (keV) | (keV) | ||||
| 1 | 1.99/ - | 32.9 | 6.40 | 1.19 | 5.300.06 | 1.3 | 52.9/51 |
| 2 | 3.12/ - | 36.8 | 6.40 | 1.03 | 5.010.05 | 2.4 | 33.7/44 |
| 3 | 1.77/0.31 | 15.8 | 6.39 | 1.29 | 5.840.06 | 1.5 | 134.7/121 |