RAPID NH CHANGES IN NGC 4151
Abstract
We have analyzed two long BeppoSAX observations of the bright Seyfert galaxy NGC 4151, searching for short timescale (10-200 ksec) X-ray spectral variability. The light curve of a softness ratio, chosen as most sensitive to pinpoint changes of the column density of the absorbing gas along the line of sight, shows significant variations. We try to model these variations by performing a detailed, time resolved, spectral analysis. We find significant, large (factors of 1.5-6) variations of the absorber column densities on time scales of 40-200 ksec. These values are 10-100 times shorter than those found by Risaliti et al. 2002 in a sample of Seyfert 2 galaxies, and provide strong constraints on the geometry of the obscuring medium.
1 Introduction
The geometry of the obscuring matter in Active Galactic Nuclei, predicted by unified models [1], is still unclear. The study of variability of the absorbing column density (NH) in these objects, provides invaluable informations on the size and location of the absorber. Recently, Risaliti et al. [2] found NH variability on time scales from month to 5 years in nearly all the objects belonging to a sample of bright, Compton-thin Seyfert 2 galaxies with multiple X-ray observations. This variability suggests that the absorber could be much closer to the nucleus than usually assumed.
To further investigate this issue, we have analyzed two BeppoSAX long observations of the brightest Seyfert galaxy, NGC 4151, and present here some preliminary results.
2 Light curves analysis
The two BeppoSAX observations were performed on 2001 December, 18 and 1996 July, 6 with the Narrow Field Instruments: LECS (0.1-10 keV), MECS (1.3-10 keV), and PDS (13-200 keV).
The total absorbing column density measured in NGC4151 by HEAO1, EXOSAT, Ginga, ROSAT and ASCA [4, 5, 6, 7, 8, 9, 10] ranges from a few cm-2 to a few cm-2. Since the corresponding photoelectric cut-off lies in the 2-4 keV energy range, we have chosen to analyze the light curves of the count rate in the bands 2-4 keV (MECS), 6-10 keV (MECS) and of their softness ratio (see Figures 1 and 2), to investigate whether NH variations might have occurred within each observation. We also analyzed the light curve of the count rate in the 15-200 keV band (PDS) to monitor the continuum. From the analysis of these light curves we have selected some time intervals where we find indications that NH might have undergone significant changes. These intervals are shown and labelled in figures 1 and 2. To quantify the spectral variations we have then performed a detailed spectral analysis of these stretches of data.


3 Spectral analysis
Standard data reduction was performed using the SAXDAS software package version 2.0 following Fiore, Guainazzi & Grandi [11]. Spectral fits were performed using the XSPEC 11.2.0 software package and public response matrices as from the 1999 December release. The PDS data were reduced using the “variable risetime threshold” technique to reject particle background [11]. LECS and MECS spectra were rebinned following two criteria:a) to sample the energy resolution of the detectors with three channels at all energies whenever possible, and to obtain at least 20 counts per energy channel. Constant factors have been introduced in the fitting models in order to take into account the intercalibration systematics between the instruments [11]. The model adopted for the analysis has the following components:
-
1.
A power-law with an exponential high-energy cut-off;
-
2.
a neutral Compton reflection component (modelled with PEXRAV [3]);
-
3.
a narrow iron Kα emission line with energy set to 6.38 keV in the observer frame;
-
4.
two components for the soft excess emission: a thermal component, and a power law, reflection component.
- 5.
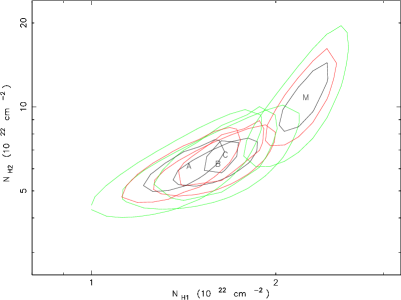
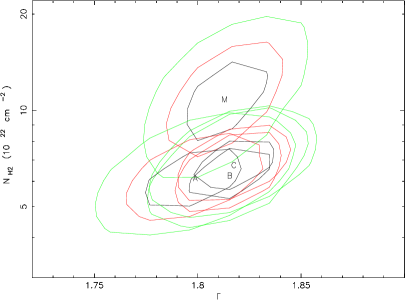
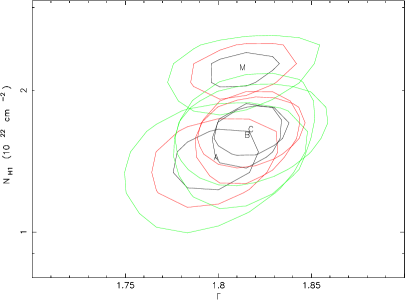
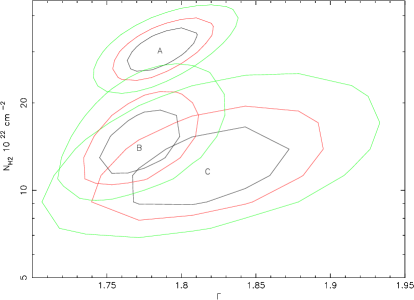
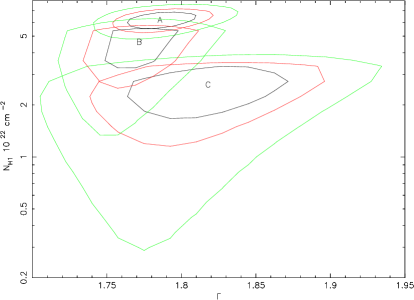
Figures 3 and 4 illustrate the results for the two observations. In the 2001 December, 18 observation, we find that from A to B to C, both absorbers and the photon index do not show statistically significative changes. From C to M the two absorbers N and N change at a confidence level by a factor of 2 and 3.3 respectively, while the photon index is constant at a confidence level . If the covering factor CV is kept constant throughout the fit the amplitude of the variations of N and N is reduced to a factor 1.4 and 2 respectively. The variations occur on a timescale of 100-150 ksec.
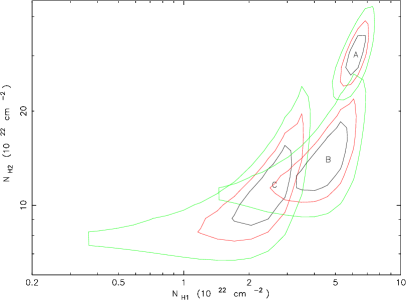
In the 1996 July, 6 observation, we find that from A to B both absorbers undergo changes at a confidence level , while from A to C the absorbers change at a confidence level . From A to B to C, the photon index is again statistically consistent with a constant. The amplitude of the variation of N and N is a factor 6 and 5 respectively. If the covering factor CV is kept constant throughout the fit the amplitude of the variations of N and N is reduced to a factor 4 and 3 respectively. The variations occur on a timescale of ksec from A to B and ksec from A to C.
4 Conclusion
We have performed a detailed time-resolved spectral study of two long BeppoSAX observations of the Seyfert galaxy NGC4151. We find strong evidences for spectral variability which we model in terms of variations of two absorbing screens. The timescales of these variations are between 40 ksec and 200 ksec, 10-100 times shorter than the typical timescales found by Risaliti et al.[2] in a sample of Compton thin Seyfert 2 galaxies. If we associate these timescales to a crossing time, the resulting linear size would be of about one light day, which is the size of the innermost part of the Broad Line Region, as inferred from reverberation mapping in NGC 4151. This interpretation is supported by the argument, used by Risaliti et al.[2], which assume that the absorbing medium might be made up of spherical clouds moving with Keplerian velocities around the central black hole. This requires that the cloud gas density is of the order of 109 cm-3, typical of Broad Line Region clouds [13].
References
- [1] Antonucci, R. 1993 ARA&A, 31, 47
- [2] Risaliti, G., Elvis, M., Nicastro, F. 2002 ApJ, 571, 234
- [3] Magdziarz, P. & Zdziarski, A. 1995, MNRAS, 273, 837
- [4] Holt, S. S., Mushotzky, R. F., Boldt, E. A. et al. 1980, ApJ, 241L, 13
- [5] Perola, G.C., Piro, L., Altamore, A. et al. 1986, ApJ, 306, 508
- [6] Fiore, F., Perola, G. C., Romano, M. 1990, MNRAS, 243, 522
- [7] Weaver, K.A., Yaqoob, T., Holt, S.S. et al. 1994ApJ,436L, 27
- [8] Piro, L., Nicastro, F., Feroci, M. 1998, axrs.symp, 481
- [9] Wang, J.-X., Zhou, Y.-Y., Wang, T.-G. 1999, ApJ, 523L, 129
- [10] Zdziarski, A., Leighly, K.M., Matsuoka, M. et al. 2002, ApJ, 573, 505
-
[11]
Fiore, F., Guainazzi, M. & Grandi, P. 1999,
Handbook for BeppoSAX NFI spectral analysis,
ftp://ftp.asdc.asi.it/pub/sax/doc/
software_docs/saxabc_v1.2.ps.gz
or
http://heasarc.gsfc.nasa.gov/docs/sax/abc/
saxabc/ - [12] Murphy, E.M., Lockman, F.J., Laor, A. et al. 1996 ApJS, 105, 369
- [13] Blandford, R., Netzer, A. and Woltjer, L. 1990: Active Galactic Nuclei, Springer-Verlag edt.