X-ray and radio prompt emission from a hypernova SN 2002ap
Abstract
Here we report on combined X-ray and radio observations of SN 2002ap with XMM-Newton ToO observation and GMRT observations aided with VLA published results. In deriving the X-ray flux of SN 2002ap we account for the contribution of a nearby source, found to be present in the pre-SN explosion images obtained with Chandra observatory. We also derive upper limits on mass loss rate from X-ray and radio data. We suggest that the prompt X-ray emission is non-thermal in nature and its is due to the repeated compton boosting of optical photons. We also compare SN’s early radiospheric properties with two other SNe at the same epoch.
1 INTRODUCTION
SN 2002ap was a type Ic SN discovered on Jan 29.4, 2002 in NGC 628. The explosion energy of the SN was larger than usual type Ic SNe (4-10 ergs). SN 2002ap was of great interest because it was one of the closest extragalactic SN (D=7.3 Mpc); secondly it was a Type Ic SN and GRB association of type Ic is found in SN 1998bw (with GRB 980425) and SN 2003dh (with GRB 030329). SN 2002ap has shown SN 1998bw like features like high velocity in early spectroscopy of optical data. Study of type Ic SNe is interesting because they are devoid of H and He core and hence can probe closer to the central engine.
2 OBSERVATIONS
2.1 X-ray Observations
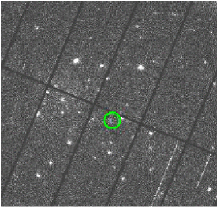
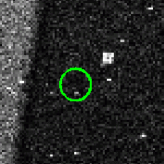
XMM-Newton observed SN 2002ap on Feb 2, 2002 for total 37.4 ksec with EPIC-PN and EPIC-MOS. We found that Chandra Observatory has observed this field on Jun 19 and on Oct 19, 2001. Inspection of pre-explosion Chandra image reveals the presence of a source 14.9” away from the SN. (See figure 1). A spectrum of the SN was extracted using circle of radius 40”. While deriving the flux of the SN, we subtracted the contribution of nearby Chandra source. Table 1 [7] gives results of different models fitted to the X-ray emission from the SN with a subtracted contribution due to Chandra source. Both power-law and thermal bremsstrahlung models fit well. However we cannot say which one is better due to sparse data.
| Model | |||||
| erg | |||||
| cm-2 | keV | /cm2/s | |||
| Power-law | 0.49 | – | 1.07 | ||
| 0.42 | – | 1.0 | |||
| Thermal | 0.49 | – | 0.81 | ||
| Brems. | |||||
| Raymond- | 0.49 | – | 1.04 | ||
| Smith | |||||
| Blackbody | 0.49 | – | 0.6 |
2.2 Radio Observations
The SN was observed with Giant Meterwave Radio telescope on Feb 5, 2002, at 610 MHz and on Apr 08, 2002, in 1420 MHz band. The SN was quite weak in radio bands and we did not detect it at such low frequencies. Table 2 gives upper limit on the fluxes of SN. The upper limits from GMRT at low frequencies combined with VLA detections at high freq. constrain models of early radio emission.
| Date in | Resolution | 2 Flux | RMS | |
|---|---|---|---|---|
| 2002 | (MHz) | (arcsec) | (mJy) | mJy |
| 5Feb | 610 | 9.5 x 6 | 0.17 | |
| 8Apr | 1420 | 8 x 3 | 0.09 |
3 LOCATION OF THE RADIOSPHERE
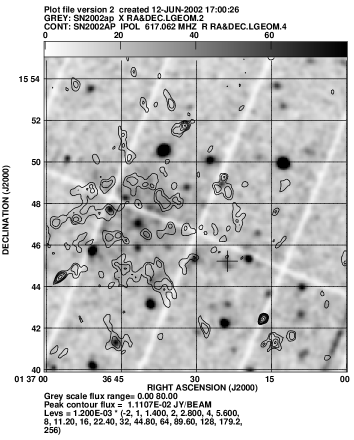
We combined the high frequency VLA published data with low frequency GMRT data on the day 8.96 after the explosion and determined the location of the radio photosphere using the synchrotron self absorption fits. (Fig. 2, Table 3).
| B | ||||
| GHz | Jy | cm. | G | |
| 0.8 | 2.45 | 397 | 0.29 |
XMM observed the SN in the UVW band with its on-board optical monitor system. The UVW1 flux for SN is of 7.667( 0.002) erg cm-2s-1A-1. Table 4 reports the location of optical photosphere, which we calculated based on Mazzali et al’s [6] bolometric and visual magnitudes on day 5. We find that the radiospheric velocity [1] (90,000 km s-1) is much higher than optical photosphere velocity (8000 km s-1) on the same day. This implies that the electrons responsible for the radio emission are much farther away than the optical photosphere.

| K | cm. | km/s | |||
| -17.4 | -16.5 | 11000 | 8000 |
3.1 Radio counterparts of X-ray sources
3.2 Mass Loss Rate from X-ray and radio
We derive the upper limits on the mass-loss rate of the supernova from both radio and X-ray datasets. For photons of energy EkeV , the time at which =1 is given as
Since XMM observed X-rays from the SN on day 5 after, the explosion i.e. on tx=5 the optical depth had reached 1. From this the upper limit on the mass loss rate from X-ray observations is for uw=≈580 km s-1 [5].
Assuming that the dominant opacity source for radio radiation is free-free opacity from fully ionised wind, the optical depth at radio frequency at time ts is
From the radio detection at 1.4 GHz on day 5 the upper limit on the mass loss rate is . Estimated from both radio and X-ray data are consistent with each other.
| Source | RA | Dec. | Radio | EPIC-PN |
|---|---|---|---|---|
| No. | Flux | count-rate | ||
| J2000 | J2000 | (mJy) | ct s-1 | |
| 1 | 01 36 47.2 | 15 47 45 | ||
| 2 | 01 36 46.1 | 15 41 17 | ||
| 3 | 01 36 24.9 | 15 48 58 | ||
| 4 | 01 36 30.5 | 15 45 17 |
4 MECHANISMS TO PRODUCE X-RAY EMISSION
In this section we evaluate for different possible mechanisms for the origin of the X-ray emission. We exclude the synchrotron origin of the X-rays because the direct extrapolation of the radio flux up to X-ray frequencies, even without a cooling break expected around optical band, leads to a flux of the order of few tens of picoJy, which is much smaller than the observed X-ray flux.
The observed X-ray flux could have been accounted by the thermal free-free emission but that predicts a flat tail up to energy of 100 keV which we don’t see in our results. Hence we rule out the possibility of thermal free-free emission.
X-rays can be generated by repeated compton scattering by hot electrons off optical photons from the photosphere. The 2 fluxes (Compton and optical) are related by [3],[2]
where the optical depth is
and the energy index is
The observed optical-UV flux and considerations of optical depth suggests that the above compton flux can account for the observed X-rays; hence we suggest that the early non-thermal X-ray flux is due to the compton scattering of the optical thermal photons.
Table 6 gives comptonizing plasma properties at t=5d for the two scenarios of the progenitor stars. The plasma has a maximum optical depth at twice the optical photosphere radius. The latter was taken as cm. Since most of the X-ray emission would take place at , the relevant plasma outflows with a velocity 16,000 km s-1. Both the progenitor scenarios can account for the observed optical depth and hence can be a potential candidate for the progenitor system of the SN.
| Scenario | ||||
|---|---|---|---|---|
| 10 km/s | K | |||
| Wolf-Rayet | 1.5 | 58 | ||
| 3 | 100 | |||
| Interacting | 10 | 58 | ||
| Binary | ||||
| Case-BBa | 10 | 10 |
a[4]
5 COMPARISON WITH OTHER SNE
We compare the spectrum of SN 2002ap with another type Ic SN 1998bw which had a GRB association and with a normal type IIb SN 1993J , on day 11 after the explosion. Figure 4 gives the comparison and Table 7 gives the best fit parameters. We observe that SN 1998bw is moving with largest speed whereas the peak in the spectrum for SN 2002ap comes at lowest frequency.
| SNe | ||||||
| GHz | mJy | as | erg | G | cm | |
| 2002ap | 2.45 | 0.48 | 39.0 | 0.69 | 0.47 | 4.80 |
| 1998bw | 5.5 | 50.4 | 112.4 | 3500 | 0.23 | 68.4 |
| 1993J | 30.5 | 22.3 | 17.6 | 0.50 | 3.54 | 1.08 |

6 DISCUSSION AND CONCLUSION
We suggest that repeated scattering of optical photons can account
for the prompt
X-ray emission from SN 2002ap. X-ray sphere (7 cm) lies
between optical (3.5)and the radio photosphere
(4 cm). Both Wolf-Rayet and
interacting binary case BB are capable of providing the adequate
optical depth
and are viable scenarios for the progenitor star. The properties of
different kind of SNe differ significantly from each other. In fact the
same type of SNe can show the significantly different properties.
Acknowledgment
We thank staff of XMM-Newton and GMRT (NCRA-TIFR) that made these
observations possible.
References
- [1] Berger,E , Kulkarni, S, Chevalier, R., ApJ, 177, L5 ,(2002).
- [2] Chevalier, R, Fransson, C, ApJ, 420, 268, (1994).
- [3] Fransson, C, A&A, 111, 140, (1982).
- [4] Habets, G, Ph.D. thesis, Univ. Amsterdam.
- [5] Leonard, D, Fillipenko, A, Chornock, R et al, astro-ph/0206368 (2002).
- [6] Mazzali, P et al, ApJ, 572, L61, (2002).
- [7] Sutaria, F, Chandra,P , Ray, A, Bhatnagar, S, A&A, 397, 1011,(2003).