Year-scale morphological variation of the X-ray Crab Nebula
Abstract
We present year-scale morphological variations of the Crab Nebula revealed by Chandra X-ray observatory. Observations have been performed about every 1.7 years over the 3 years from its launch. The variations are clearly recognized at two sites: the torus and the southern jet. The torus, which had been steadily expanding until 1.7 years ago, now appears to have shrunk in the latest observation. Additionally, the circular structures seen to the northeast of the torus have decayed into several arcs. On the other hand, the southern jet shows the growth of its overall kinked-structure. We discuss the nature of these variations in terms of the pulsar wind nebula (PWN) mechanism.
Department of Astronomy and Astrophysics, 525 Davey Laboratory, The Pennsylvania State University, University Park, PA 16802, U.S.A.
Department of Physics and Astronomy, Arizona State University, Tempe, AZ 85287-1504, U.S.A.
Department of Physics, Yamagata University, Yamagata 990-8560, JAPAN
Department of Earth and Space Science, Graduate School of Science, Osaka University, 1-1 Machikaneyama, Toyonaka, Osaka 560-0043 JAPAN
1. Introduction
The 5-month monitoring observations of Chandra and HST showed short-term (days to weeks) morphological variations of the Crab Nebula (Mori et al. 2002; Hester et al. 2002). A variable inner ring and wisps emerging from it visually revealed the existence of the termination shock of the pulsar wind and its downstream flow, respectively. In addition to such short-term, therefore more noticeable, variations, expansion of the outer torus on longer time scale (months) was also discovered. However, this seems to contradict with the fact that the angular extent of the torus is almost constant over 25 years (Mori et al. 2002); if the torus kept expanding at the observed rate, it would have become almost twice larger during this period. On the other hand, the southern jet did not show a strong variation of its overall structure. This differs from the highly variable jet of Vela (Pavlov et al. 2003), which is an another famous example of a variable PWN. Here we present long-term (years) morphological variations of the Crab Nebula which are newly discovered comparing Chandra observations over 3 years.
2. Observations
The Crab Nebula has been observed by several PIs with different objectives. The first observation was performed just after launch (Weisskopf et al. 2000) and the latest one was done 3.3 years after that to witness the transit of Titan, Saturn’s largest moon, across the Crab Nebula (Mori et al. 2003, in preparation). In this paper, we used those two observations as well as one of the monitoring observations which were performed almost at the midpoint of the first and latest ones. Hereafter, we call them 1st, 2nd, and 3rd epoch observations. They are roughly spaced at 1.7 years interval. Table 1 summarizes these observations.
| Notation | Date | Interval (year)a | Exposure (ksec) | Configurationb |
| 1st | 08/29/99 | - | 2.7 | ACIS(3.2)+HETG |
| 2nd | 04/06/01 | 1.7 | 2.6 | ACIS(0.2) |
| 3rd | 01/05/03 | 3.3 | 35 | ACIS(0.3)+HETG |
| aAn interval from the 1st observation | ||||
| bNumber in parenthesis indicates the frame time | ||||
3. Result and Discussion
In contrast with short-term variations are seen at inner regions, the long-term variations are prominent at outer regions: the torus and the southern jet. In the following sections, we will discuss these variations separately.
3.1. The northeast of the torus
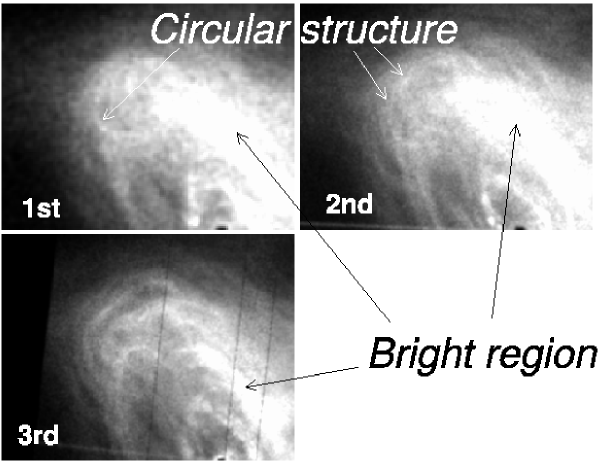
Figure 1 shows expanded views of the northeast of the torus. The brightness scales of these images are normalized to the bright region of the torus, not by exposure time, because of the differences of the observational configurations.
Images of the 1st and 2nd epoch observations are quite similar. The bright “thick” torus is encircled by circular structures at its northeastern end. As reported previously, these two structures appear to expand between the 1st and 2nd epoch observations (Mori et al. 2000; Mori 2002). In contrast with the similarity between the 1st and 2nd epoch images, the morphological transition from the 2nd to the 3rd epoch image is remarkable. The bright region of the torus appears to have became shrunken and “thin”, and the circular structures have decayed into several arcs.
Now it is clear that the torus is not steadily expanding; the overall extent is almost constant over decades, but the boundary of the torus varies with an angular scale of a few arcseconds and a time scale of years. It is as if we were seeing a top of a fountain. Greiveldinger & Aschenbach (1999) reported surface brightness variations of the Crab Nebula using HRI observations spanning 6 years. Although could not detect a morphological variation, they showed a monotonic increase of the surface brightness at the northeastern region of the torus. The brightness variation discovered by is most likely related to the morphological variation discovered by Chandra, suggesting that the time scale of the variation of the torus might be about a decade rather than a few years.
3.2. The southern jet
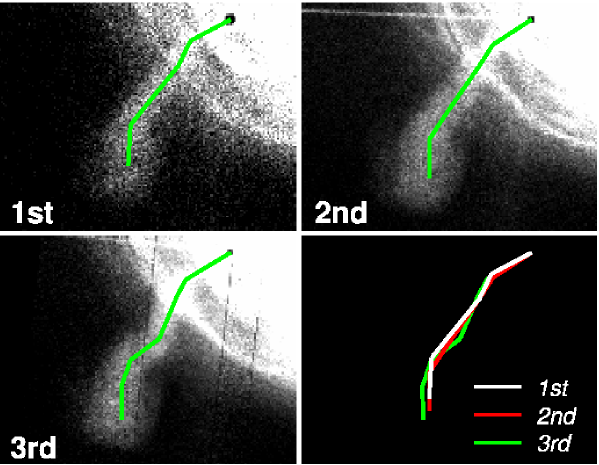
Figure 2 shows expanded views of the southern jet of the 1st, 2nd, and 3rd epoch observations. Although the displacement of the jet is quite small, the series of images clearly shows the growth of its overall kinked-structure. The variability of the jet is reminiscent of northern variable jet of Vela (Pavlov et al. 2003). Table 2 compares the time scale of the variability and the width between the Crab and Vela Jets. The Crab jet is 10 times larger and varies 10 times slower than the Vela jet. If these variations are due to MHD instability, the time scale is proportional to the Alven crossing time, , where is the width of the jet and is the Alven velocity (Begelman 1998). Considering that the Alven velocity in an ultrarelativistic plasma like the Crab and Vela PWN is more or less the same, above equation applies to both the Crab and Vela jet. Therefore, it is suggested that a common mechanism is responsible for the variability of the Crab and Vela jet.
| Time scale (day) | Width (cm) | |
|---|---|---|
| Crab | 150-500 | 2.9 1017 |
| Vela | 10-30 | 3 1016 |
References
Begelman, M. C. 1998, ApJ, 493, 291
Greiveldinger, C. & Aschenbach, B. 1999, ApJ, 510, 305
Hester, J. J. et al. 2002, ApJ, 577, 871
Kennel, C. F., & Coroniti, F. V. 1984, ApJ, 283, 694
Mori, K. et al. 2002, in Neutron Stars in Supernova Remnants, ed. P. O. Slane & B. M. Gaensler, p157
Mori, K. 2002, Ph. D. Thesis, Osaka University
Pavlov, G. G. et al. 2003, ApJ, 591, 1157
Weisskopf, M. et al. 2000, ApJ, 536, 81