Maps of the millimetre sky
from the BOOMERanG experiment
Abstract
In the 1998-99 flight, BOOMERanG has produced maps of of the sky at high Galactic latitudes, at frequencies of 90, 150, 240 and 410 GHz, with resolution . The faint structure of the Cosmic Microwave Background at horizon and sub-horizon scales is evident in these maps. These maps compare well to the maps recently obtained at lower frequencies by the WMAP experiment. Here we compare the amplitude and morphology of the structures observed in the two sets of maps. We also outline the polarization sensitive version of BOOMERanG, which was flown early this year to measure the linear polarization of the microwave sky at 150, 240 and 350 GHz.
1 Dipartimento di Fisica, Universita’ La Sapienza,
Roma, Italy
2 Dept. of Physics and Astronomy, Cardiff University, Wales, UK
3 Dipartimento di Fisica, Universita’ di Tor Vergata, Roma, Italy
4 Jet Propulsion Laboratory, Pasadena, CA, USA
5 CITA, University of Toronto, Canada
6 NERSC, LBNL, Berkeley, CA, USA
7 IFAC-CNR, Firenze, Italy
8 California Institute of Technology, Pasadena, CA, USA
9 CSU Dominguez Hills, Carson, CA, USA
10 Phys. Dept. University of Pennsylvanya, Philadelphia, PA, USA
11 IPAC, CalTech, Pasadena, CA, USA
12 Physics Department, CWRU, Cleveland, OH, USA
13 Astrophysics Group, Imperial College, London, UK
14 Depts. of Physics and Astronomy, University of Toronto, Canada
15 Physics Dept., University of Alberta, Alberta, Canada
16 Institut d’Astrophysique, Paris, France
17 Istituto Nazionale di Geofisica, Roma, Italy
1. Introduction
BOOMERanG is balloon-borne microwave telescope, sensitive at 90, 150, 240 and 410 GHz, with a resolution of . The instrument was equipped with very sensitive spider-web bolometers (Mauskopf et al. 1997). The image of the sky is obtained by slowly scanning the full payload in azimuth () at constant elevation. The scan center constantly tracks the azimuth of the lowest Galactic foreground region, situated in the southern hemisphere, in the Horologium constellation. Every day of the flight the instrument obtains a fully cross-linked map of about of the sky. The instrument was flown in a long duration circum-Antarctic flight from Dec.28, 1998 to Jan.8, 1999, and has been described in Piacentini et al. (2002) and in Crill et al. (2003). The main target of the experiment was the detection of anisotropy in the Cosmic Microwave Background. The maps produced by the experiment have been published in de Bernardis et al. (2000), Masi et al. (2001), Netterfield et al. (2002), Ruhl et al. (2003). Due to the limited size and to 1/f noise, these maps do not contain information for angular scales and have been filtered accordingly. The maps are calibrated to in gain and to in beam FWHM. In the 150 GHz map, the signal is well above the noise, and maps taken at different scan speeds and in different locations are perfectly consistent, demonstrating the low level of systematic effects. The level of the noise is of the order of 50 per pixel and of 20 per pixel. At 90, 150 and 240 GHz the rms signal has the spectrum of CMB anisotropy, and does not fit any reasonable spectrum of foreground emission. The temperature fluctuations detected in the high latitude part of the 150 GHz map are remarkably gaussian (Polenta et al. 2002, De Troia et al. 2003). The angular power spectrum of the 150 GHz map in the multipole range has been computed in Netterfield et al. (2002) and Ruhl et al. (2003). Three peaks have been detected in the power spectrum, at multipoles 210, 540, 845 (de Bernardis et al., 2002). Interstellar Dust contamination of the 150 GHz power spectrum has been shown to be less than 1% (Masi et al. 2001). These results fit the scenario of acoustic oscillations of the primeval plasma at horizon and subhorizon scales (Sunyaev and Zeldovich 1970, Peebles and Yu 1970). In the framework of adiabatic inflationary structure formation the cosmological parameters have been estimated from the measured power spectrum (Lange et al. 2001, Netterfield et al., 2002, de Bernardis et al. 2002, Ruhl et al. 2003). The three cosmological parameters best constrained by the BOOMERanG data are the curvature parameter (the universe is nearly flat), the spectral index of the primordial density perturbations (nearly scale invariant), the physical density of baryons (consistent with Big Bang Nucleosynthesis).
Here we compare the BOOMERanG maps to the maps recently obtained at similar frequency and resolution by the WMAP satellite (Bennett et al., 2003). Working from the advantage L2 point of the Sun-Earth system, in its first year of operation WMAP has produced full sky maps of the microwave sky at 22, 32, 41, 60, 94 GHz, with resolution of the order of and noise of per pixel in 28’ pixels. The maps are precisely calibrated (better than 1%). The power spectra obtained from these maps are fully consistent with the CMB power spectrum measured by BOOMERanG at 150 GHz, and with the adiabatic inflationary scenario: they allow the precise determination of most of the cosmological parameters; these estimates improve the precision of the BOOMERanG ones by a factor 2-3 for the parameters mentioned above; the full-sky coverage and polarization sensitivity allows the determination of previously poorly constrained parameters, like the reionization optical depth (Spergel et al. 2003).
The comparison of the BOOMERanG and WMAP maps is carried out with three targets:
Compare independent maps of the CMB with similar angular resolution, and confirm the detection of primordial structures in both experiments;
Improve the BOOMERanG calibration using the precise calibration of WMAP, and demonstrate that 1% gain calibration is possible for the new, polarization-sensitive BOOMERanG-B2K survey;
Infer the level and properties of foregorund contamination in forthcoming deep surveys of the CMB.
2. BOOMERanG vs WMAP
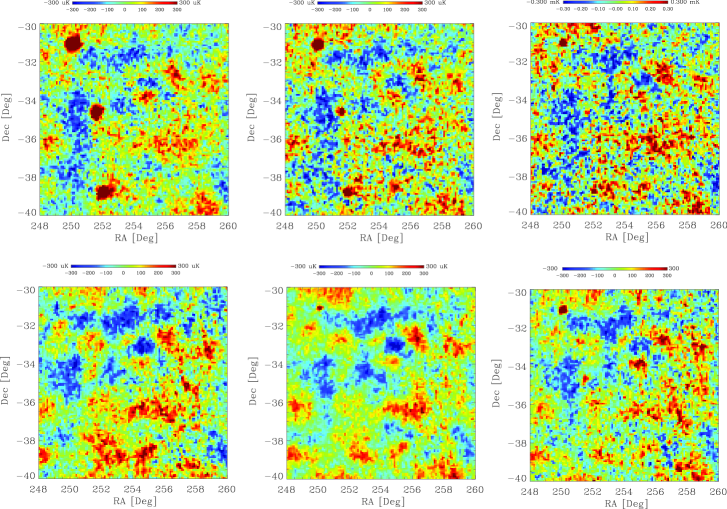
In fig. 1 we compare the maps of BOOMERanG at 90, 150, 240 GHz to the maps of WMAP at 41, 60, 94 GHz in the same high latitude region. The maps are Healpix (Gorski et al. 1998) representations with npix=512 (7’ per pixel). The region selected has the best coverage in the BOOMERanG 150 GHz channels. A high-pass has been applied to the WMAP maps to easy the comparison to the BOOMERanG maps, which are intrinsically insensitive to large angular scales.
The morphological agreement of the structures detected is evident. Significant differences are in the level of the noise and in the presence of important contamination by AGNs in the lower frequency channels. Once these sources are masked, the pixel-pixel correlation between the maps is quite good.
A quantitative analysis must take into account all important differences between the two datasets:
The beams of BOOMERanG and WMAP are different. The BOOMERanG beam at 150 GHz is closely fit by a 11’ gaussian down to 2% of the axial gain, while at lower levels is better fit by a 13’ gaussian. The WMAP beam at 94 GHz is fit by a 13’ gaussian down to 5% of the axial gain, and has wide ”shoulders” at lower levels. This difference is difficult to treat in pixel space, while its treatment is relatively simple in multipoles space. An example of this can be found in Abroe et al. (2003), comparing MAXIMA and WMAP maps of the CMB.
The BOOMERanG maps do not include structures larger than , while WMAP maps are accurate at all scales. Once again, this is easier to account for in multipoles space.
In this pixelization, the noise of the 150 GHz BOOMERanG map is around 50 per pixel, while the noise of the 94 GHz WMAP map is around 180 per pixel.
A full analysis taking into account all these details is described in Hivon et al. (2003): the main result is that the calibration of BOOMERanG-98 at 150 GHz is found to be consistent with the precise calibration of WMAP within 5%. Moreover, calibration of BOOMERanG is found to be reachable with this correlation method.
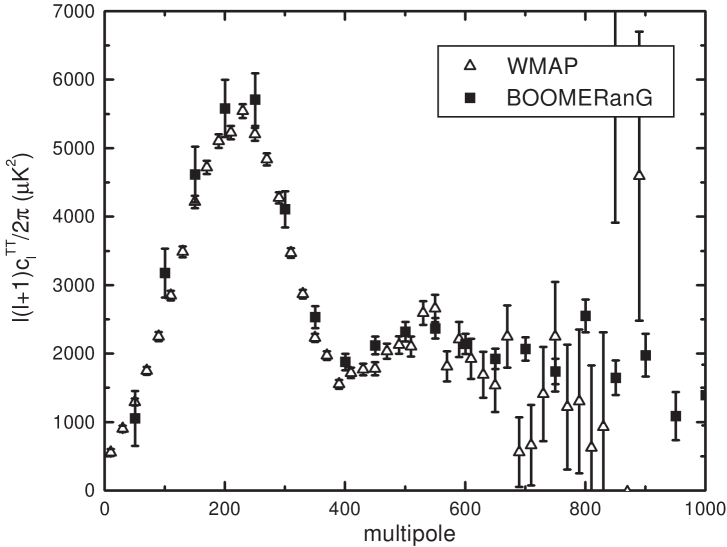
Given the close consistency of the maps of BOOMERanG and WMAP, the consistency of the angular power spectra measured by the two experiments is almost a trivial consequence. In fig.2 we compare the angular power spectra detected by the two instruments. The gain calibration error ( for WMAP and for BOOMERanG) is not included in the error bars, which account for random errors only. It is evident that the WMAP experiment has much higher sensitivity than BOOMERanG at multipoles : the WMAP measurement in this range is limited by cosmic variance, and the Power Spectrum can be considered definitive. In the region of the second peak the two experiments have similar sensitivity, while in the region of the third peak the BOOMERanG experiment has better sensitivity due to the smaller beam and the lower noise per pixel. For the determination of the cosmological parameters , , , in the adiabatic inflationary scenario, WMAP takes advantage of the accurate calibration, while the BOOMERanG is still competitive because of the wider multipoles coverage, including the third peak of the spectrum.
These results give only an idea of what can be expected from Planck-HFI (Lamarre et al. 2003), the satellite instrument developed to fully exploit the capabilities of cryogenic bolometers. This will work for about two years from the same deep space location as WMAP, using bolometric detectors at 0.1K, even more sensitive than the BOOMERanG ones.
3. The polarization-sensitive BOOMERanG: B2K
After the 1998-99 flight, BOOMERanG has been recovered and upgraded. Additional attitude sensors have been implemented (a day-time star camera developed in Toronto and a pointed star sensor developed in Rome), and the focal plane has been rebuild to accomodate polarization sensitive bolometers (PSB) developed in JPL/Caltech (Jones et al. 2003). The new focal plane is sketched in fig.3.
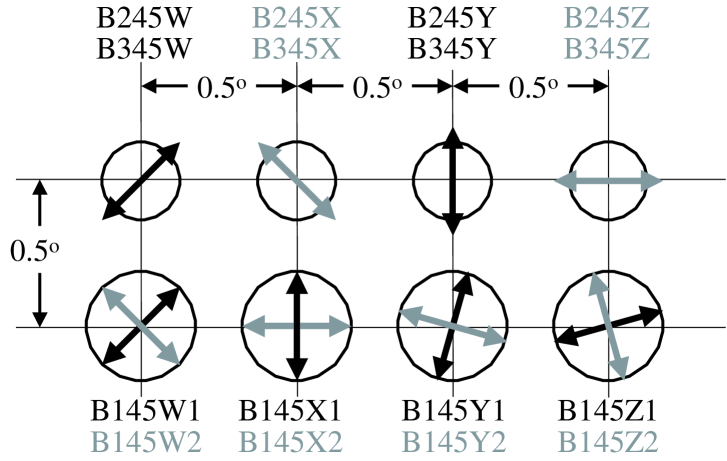
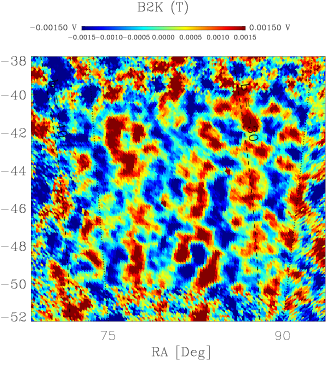
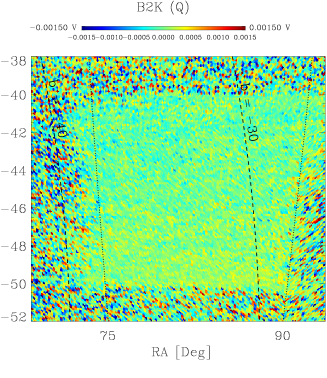
It has 8 pixels in two rows. The distance between pixels projected in the sky is 0.5o both in azimuth and in elevation. Each pixel of the bottom row is a 145 GHz PSB with two independent bolometers sensing the two orthogonal polarization directions (Jones et al. 2003); each pixel on the top row senses a single polarization direction in two frequencies (240 and 350 GHz). The 150 GHz beam is FWHM, while the 240 and 350 GHz beams are FWHM. More details on the instrument can be found in Montroy et al. (2003). The experiment has been designed to measure the E modes (gradient) in the CMB polarization pattern. This has been detected only by the DASI experiment, but the sensitivity was not enough to constrain cosmological models more than with anisotropy data. WMAP has published a detection of the TE cross correlation from the first year of operation, consistent with the adiabatic model inferred by the anisotropy measurement. B2K should be able to measure the TE and EE power spectra at frequencies higher than the DASI and WMAP ones (30 to 94 GHz), thus facing different polarized foregrounds and nicely complementing them. The B2K payload has been flown from the McMurdo base on Jan.7, 2003, for a total of 11 days of operation in the stratosphere. In fig.4 we plot preliminary maps from B2K obtained from the PSBs at 145 GHz. We plan to re-fly B2K with an upgraded focal plane, to go after the polarized foreground from cirrus dust and AGNs. This information is essential for all the planned B-modes experiments (e.g. BICEP, Dome-C etc.) and is very difficult to measure from ground. The BOOMERanG optics can host an array of PSB at GHz, providing a deep, high resolution survey of polarized foreground emission at frequencies close to the ones used for CMB polarization research.
The BOOMERanG experiment is supported in Italy by Agenzia Spaziale Italiana, Programma Nazionale Ricerche in Antartide, Universita’ di Roma La Sapienza; by PPARC in the UK, by NASA, NSF OPP and NERSC in the U.S.A., and by CIAR and NSERC in Canada.
Abroe, E., et al., 2003, submitted to Ap.J,astro-ph/0308355
Bennett, C., et al., 2003, Ap.J., in press,astro-ph/0302207
Crill, B., et al. 2003, Ap.J.S., 148, 527
de Bernardis, P., et al., 2000, Nature, 404, 955
de Bernardis, P., et al., 2002, Ap.J., 564, 559
De Troia, G., et al., 2003, MNRAS, 343, 284
Gorski, K. M., Hivon, E. and Wandelt, B.D., 1998, inAnalysis Issues for Large CMB Data Sets, A. J. Banday,R. K. Sheth and L. Da Costa eds., ESO, Ipskamp, NL,pgg. 37-42, see alsohttp://www.eso.org/science/healpix/
Hivon, E., et al., 2003, in preparation
Jones, W.C., et al., 2002,astro-ph/0209132
Lamarre, J.M., et al., 2003,astro-ph/0308075
Lange, A.E., et al., 2001, Phys.Rev., D63, 042001
Masi, S., et al., 2001, et al., Ap.J, 553, L93
Mauskopf, P., et al. 1997, Applied Optics, 36, 765
Montroy, T., et al., 2003,astro-ph/0305593
Netterfield, B., et al., 2002, Ap.J., 571, 604
Piacentini, F., et al. 2002, Ap.J.Suppl., 138, 315
Polenta, G., et al., 2002, Ap.J., 572, L27
Peebles, P.J.E, and Yu, J.T., 1970, Ap.J., 162, 815
Ruhl, J., et al., 2003, Ap.J. in press( astro-ph/0212229 )
Spergel, D.N., et al., 2003, Ap.J., in press,astro-ph/0302209Sunyaev, R.A. & Zeldovich, Ya.B., 1970, Astr.SpaceSci., 7, 3