The XMM- project : II. Cosmological implications from the high redshift relation of X-ray clusters
The evolution with redshift of the temperature-luminosity relation of X-ray galaxy clusters is a key ingredient to break degeneracies in the interpretation of X-ray clusters redshift number counts. We therefore take advantage of the recent measurements of the temperature-luminosity relation of distant clusters observed with XMM-Newton and Chandra satellites to examine theoretical number counts expected for different available X-rays cluster samples, namely the RDCS, EMSS, SHARC, 160deg2 and the MACS at redshift greater than 0.3. We derive these counts without any adjustment, using models previously normalized to the local () temperature distribution function (TDF) and to the high- () TDF. We find that these models having in the range [0.85-1.] predict counts in remarkable agreement with the observed counts in the different samples. We illustrate that this conclusion is weakly sensitive to the various ingredients of the modeling. Therefore number counts provide a robust evidence of an evolving population. A realistic flat low density model (), normalized to the local abundance of clusters is found to overproduce cluster abundance at high redshift (above ) by nearly an order of magnitude. This result is in conflict with the popular concordance model. The conflict could indicate a deviation from the expected scaling of the relation with redshift.
Key Words.:
Cosmology – cosmological parameters – dark matter – Galaxies: clusters : general1 Introduction
The evolution of the temperature distribution function (TDF) of X-ray clusters is known to be a powerful cosmological test of the density parameter of the Universe (Oukbir & Blanchard 1992). Indeed, the evolution with redshift of the mass function, on cluster scales, once normalized to present day, appears to be a robust cosmological test, with an exponential sensitivity to through the gravitational growth rate of perturbations (Blanchard & Bartlett 1998). The high sensitivity of this test has allowed its first direct application from a sample of ten (revised to 9) clusters at redshift 0.3 with measured temperature (Henry 1997). However, several authors have inferred somewhat different values from this single sample (Eke et al. 1998; Viana & Liddle 1999; Blanchard et al. 2000, hereafter B00). This might not be so surprising given the small size of the sample as well as the limited range of redshift. An alternative approach to track the evolution of the abundance of clusters is from their redshift distribution in X-ray samples for which the selection function is known. This procedure, reducing the time telescope investment, has been applied to the EMSS sample (Oukbir & Blanchard 1997; Reichart et al. 1999) and to the RDCS sample (Borgani et al. 1999, 2001) but the conclusion on depends on the possible evolution of the relation (Sadat et al. 1998, hereafter SBO98; Borgani et al. 1999, Novicki et al. 2002). The various ingredients used in this modeling were not necessary accurately known, most noticeably the temperature mass () relation, and the luminosity-temperature () relation and its possible evolution with redshift. Therefore doubts have been raised up on the applicability of this test given these uncertainties (Colafrancesco et al. 1997; Rosati et al. 2002).
The XMM- project was conducted in order to provide an accurate estimation of the possible evolution of the luminosity temperature relation at high redshift for clusters of medium luminosity which constitute the bulk of X-ray selected samples, allowing to remove a major source of degeneracy in the determination of (Bartlett et al. 2001). To maintain a better control on the resulting it is clearly preferable to use clusters homogeneously obtained from X-ray selected samples. Therefore, the choice of the SHARC surveys in the XMM- project provides several advantages: large angular coverage with the Bright SHARC (Nichol et al. 1999; Romer et al. 2000), deepness of the sample with the South SHARC (Burke et al. 1997), still keeping the number of clusters to a realistic size for comprehensive X-ray investigations.
The purpose of this letter is to examine the expected number counts in comparison with the observed counts in two different cosmological models, namely a concordance model and a high matter density flat universe, and to examine the amplitude of the major sources of uncertainties: the statistical dispersion on the value of from the finite local sample, the systematic uncertainties in the and the relations at high redshift. In this modeling we take advantage of the accurate knowledge of the relation provided by the first results from the XMM- project (Lumb et al. 2003, hereafter L03) and from recent Chandra measurements of distant clusters (Vikhlinin et al. 2002).
| T15 | Cosmological model | |||
|---|---|---|---|---|
| (keV) | and ingredients | |||
| 4 | 1. | 0.55 | 0.12 | A: best model+BN98+SMT |
| 6.5 | 0.85 | 0.455 | 0.1 | A: best model+M98+SMT |
| 4 | 0.3 | 1. | 0.2 | B: Low +BN98+SMT |
| 6.5 | 0.3 | 0.725 | 0.2 | B: Low +M98+SMT |
2 Modeling the temperature distribution function and number counts
Although a full likelihood is possible in order to determine the best parameters and their final uncertainty taking into account all the possible sources of uncertainties, we find enlightening to illustrate the differences in the counts predicted in the two following specific models: the first model (hereafter model A) is the best flat model obtained as in B00 by fitting the local TDF and the high redshift TDF from the Henry (1997) sample, assuming a CDM–like spectrum. The second model (hereafter model B) we use is the so-called concordance model i.e. a flat CDM model with , in agreement with the recent WMAP results (Spergel et al. 2003). In this model, only the local TDF was then fitted. The parameters used are summarized in Table 1. The samples we used for comparison are EMSS (Gioia et al. 1990; Henry et al. 1992), RDCS (Rosati et al. 1995, 1998), 160deg2 (Vikhlinin et al. 1998, 2002), Bright SHARC (Nichol et al. 1999; Romer et al. 2000) and MACS (Ebeling et al. 2001) for which the selection criteria are believed to be well known, generally given as sky coverage versus flux limit. These catalogs provide us with a sample of 274 (non necessarily independent) clusters with redshift between 0.3 and up to more than 1 and luminosities between and erg/s.
In our modeling we follow a procedure close to the one used by Oukbir & Blanchard (1997), Reichart et al. (1999) and Borgani et al. (1999). In the first step, models are normalized using the local TDF, which request two fundamental ingredients: the mass function and the relation, assumed to follow a standard scaling law (Kaiser 1986). Intensive numerical simulations have allowed to provide accurate analytical fits to the mass function (Sheth, Mo & Tormen 2001, hereafter SMT; Jenkins et al. 2001; White 2002). Here we use the expression from SMT:
| (1) |
with , and and .
2.1 The relation
It has been shown that the normalization of the relation based on numerical simulations is significantly different from the normalization inferred from hydrostatic equation (Roussel et al. 2000). In this work we use two different normalizations so as to cover the whole range of possibilities: we use on one side the calibration based on the numerical simulations of Bryan and Norman (1998, BN98 hereafter) and on the other side we use a relation derived from the hydrostatic equation (Markevitch 1998, M98 hereafter) which produces a lower normalization of the matter power spectrum (Seljak 2002; Reiprich & Böhringer 2002). The relation is written to be:
| (2) |
where is the contrast density with respect to the density of the Universe for virialized objects (hereafter ). The subscript 15 means that masses are taken in unit of solar masses. BN98 found keV, while M98 concluded to a higher normalization : keV.
The mass function can then be normalized from the observed TDF (a possible dispersion of 15% is included as done in B00). The availability of bright ROSAT clusters samples has allowed reasonably accurate estimations of the local TDF (M98; B00; Pierpaoli et al. 2001; Ikebe et al. 2002), even if the agreement is partly due to the fact that the samples used in these previous works contain nearly the same clusters.
In the present work, we use the local TDF based on an updated version of the local X-ray clusters sample used in B00 in which clusters were selected with fluxes erg/s/cm2 in the ROSAT [0.1-2.4] keV and galactic coordinates . This revised TDF is essentially identical to B00 and other recent measurements.
2.2 Evolution of the relation
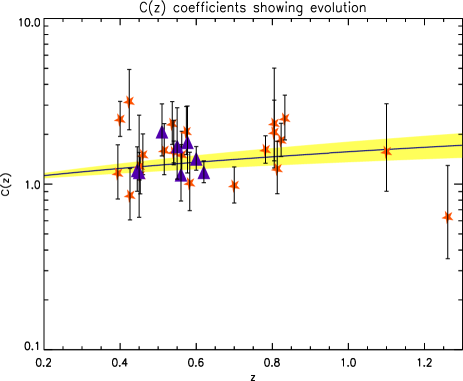
In a second step we use the relation and its evolution to compute the luminosity function at different redshifts. Using the observed local relation, models fitting the observed local TDF automatically provide a luminosity function matching the data (Oukbir, Bartlett & Blanchard, 1997). The local relation is estimated from the sample described above (Vauclair et al. 2003 in preparation). We obtained erg/s assuming We then estimated the evolution of this relation using our XMM data of high- clusters obtained in the XMM- project (L03). Following SBO98 we compute for each cluster:
| (3) |
and fit these by a power-law evolution law:
| (4) |
the best-fit parameter was obtained by a standard fitting (See figure 1) in good agreement with what was found previously (SBO98) and fully consistent with the Chandra results (Vikhlinin et al. 2002).
2.3 Number counts
In order to compute number counts, one can notice that the observations actually provide and (rather than the actual and ). For a flux limited sample with a sky coverage area and a flux limit one has therefore to compute the following:
| (5) |
where is the temperature threshold corresponding to the flux as given by the observations, being therefore independent of the cosmological model. We then compute the theoretical number counts in redshift bins for the various clusters samples mentioned above accordingly to their respective selection function. In order to compare the same cluster population at different redshifts, we have excluded from the faint ROSAT samples number counts at redshift smaller than for which clusters have too low luminosity compared to those used to measure the evolution in this project. In addition at clusters become significantly more extended than the detection cell in the EMSS sample, and are not considered as reliable in MACS, a further reason for restricting our comparison to higher redshifts.
2.4 Comparison with observations
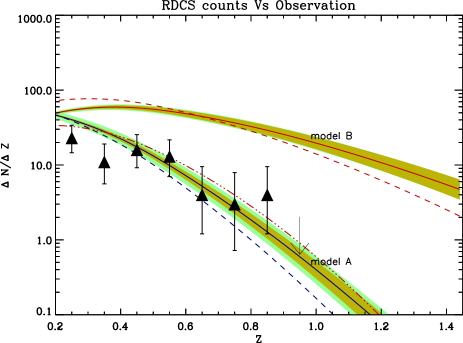
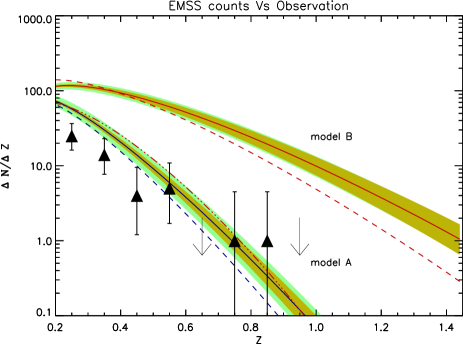
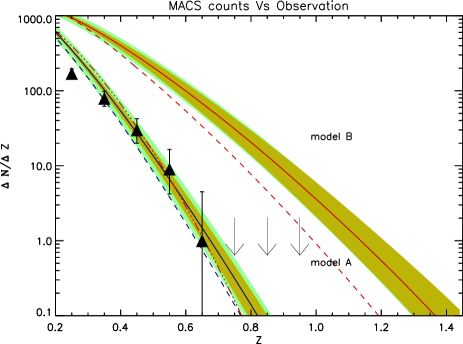
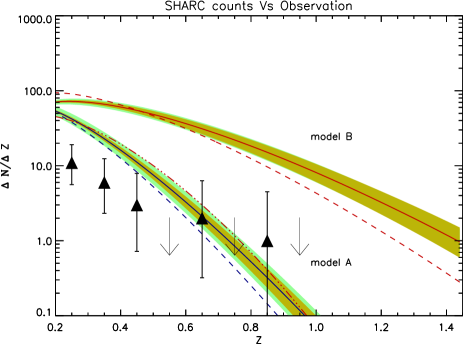
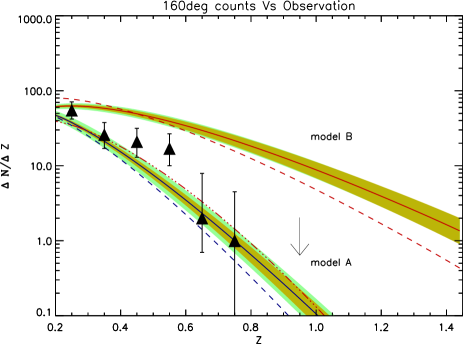
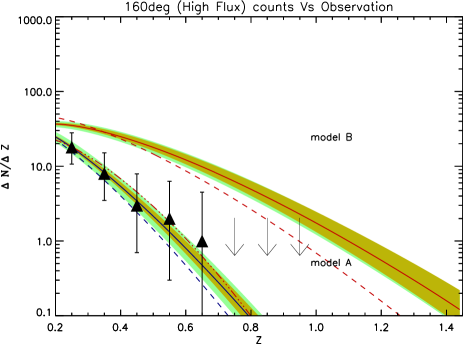
The final number counts for the different samples are presented in figure 2 for models A and B. As one can see the predicted counts in model A are in remarkable agreement with the observed number counts given the fact that no adjustment was performed, while the predicted number counts in the concordance model reveals a strong disagreement with the data. The overproduction of clusters at high redshift is impressively large, reaching a factor of nearly ten at redshift greater than 0.5. Two factors are responsible for this difference: the primary effect comes from the evolution in the number of clusters which is quite different in the two models and the second effect comes from the increase of the volume element in the dominated universe. The uncertainties in the value of , in the relation and in the relation represent similar uncertainties in the predicted counts, in the range of 30% to 70 %, but are far below the difference between the two models which is between 5 and 10. We also checked that changing the slope and the normalization of the local does not affect our results. One may worry whether the selection procedure of the samples has introduced more bias than usually assumed. A systematic bias in the flux of the order of 2 to 3 for the different surveys would eliminate most of the discrepancy between the predictions of concordance model and the observed counts. Such a possibility seems very unlikely: different flux inter-comparisons exist, including those of L03 between ROSAT SHARC and XMM fluxes and those of Vikhlinin et al. (2003) between ROSAT and Chandra fluxes, and do not provide any evidence for such a large bias.
3 Discussion
As we have seen a model which is normalized to the local as well as to the high redshift TDF, reproduces impressively well the redshift distribution of all the surveys we have investigated, without any adjustment and with little uncertainties arising from the modeling. In contrast, we have checked that relaxing the request of matching the local abundance a concordance model fitting the redshift distribution leads to a local abundance of X-ray clusters nearly 5 times lower than actually observed. This is a strong indication that existing samples of clusters (namely the Henry sample, the RDCS, the EMSS, the Bright SHARC, the 160deg2 and the MACS sample) draw the same picture, consistently pointing out toward the fact that the cluster abundance is significantly evolving with redshift, perhaps closing a long term controversy on this question (Henry et al. 1992). Furthermore, in standard hierarchical picture of structure formation such evolution points toward a high matter density universe with in the range [0.85-1.], the precise value depending on the normalization. This conclusion is clearly conflicting with the currently popular concordance model. However, it should be emphasized that this is entirely consistent with all previous existing analyzes performed on the redshift distribution of X-ray selected samples of clusters performed with the same methodology: our conclusion corroborates previous analyzes of the EMSS clusters redshift distribution: SBO98 found , Reichart et al. (1999) found as well as the RDCS redshift distribution for models normalized to the present-day X-ray clusters abundance. Indeed, from Eq. (14) in Borgani et al. (1999), we derive from our . Note that high models are also consistent with WMAP (Blanchard et al. 2003). A possible loophole could be a large systematic bias flux, but we have argued that this seems very unlikely. An other possibility would be that the scaling in the redshift of the relation (Eq. 1) is completely wrong, violating the basic scaling scheme. Voit (2000) has investigated such a possibility, but concluded to a moderate effect. In Fig. 2, we have plotted the predicted counts in a concordance model, assuming
| (6) |
instead of Eq. 2. As one can see, such a modification reestablishes agreement of the concordance model with observations. It is well known that the relation cannot be explained from simple scaling arguments. One may therefore argue that the redshift evolution of the relation may suffer from more dramatic effect than usually assumed, although – to our knowledge – such a possibility has never been advocated and it is probably not obvious to find physical motivation leading to gas thermal energy in distant clusters () to be reduced by a factor of two compared to clusters in the local universe. We therefore conclude that the redshift distributions of present–day available X-ray clusters surveys, as well as the recent results on the relation of high redshift clusters, favor a high matter density universe unless the standard paradigm on clusters gas physics has to be deeply revised.
Acknowledgements.
The authors would like to thank M. Arnaud, J. Peebles and K. Romer for fruitful comments during this work, H. Ebeling and S. Borgani for providing us number counts of MACS and RDCS respectively. This research has made use of the Clusters Database BAX which is operated by the LAOMP under contract with the Centre National d’Etudes Spatiales (CNES).References
- omegaP (2000) Bartlett, J., Aghanim, N., Arnaud, M. et al. 2001, proceedings of the XXI rencontre de Moriond, astro-ph/0106098
- Blanchard2 (2000) Blanchard, A., Sadat, R., Bartlett, J. G., & Le Dour, M. 2000, A&A 362, 809
- (3) Blanchard, A., Douspis, M., Rowan-Robinson, M., & Sarkar, S. 2003, A&A in press, astro-ph/0304237
- (4) Borgani, S., Rosati, P., Tozzi, P., & Norman, C. 1999, ApJ, 517, 40
- (5) Borgani, S., Rosati, P., Tozzi, P. et al. 2001, ApJ, 561, 13
- Bryan (1998) Bryan, G. L., & Norman, M. L. 1998, ApJ 495, 80
- Burke at al, (1997) Burke, D. J., Collins, C. A., Sharples, R. M. et al. 1997, ApJ, 488, L83
- (8) Colafrancesco, S., Mazzotta, P., & Vittorio, N. 1997, ApJ, 488, 566
- (9) Ebeling, H., Edge, A. C., & Henry, J. P. 2001, ApJ, 553, 668
- Eke et al. (1998) Eke, V. R., Cole, S., Frenk, C., & Henry, J. P. 1998, MNRAS 298, 1145
- Gioia et al., (1990) Gioia, I. M., Maccacaro, T., & Schild, R. E. 1990, ApJS, 72, 567
- Henry (1992) Henry, J. P., Gioia, I. M., Maccacaro, T. et al. 1992, ApJ 386, 408
- Henry (1997) Henry, J. P. 1997, ApJ 489, L1
- Henry , (2000) Henry, J. P. 2000 ApJ., 534, 565
- Ikebe et al., (2001) Ikebe, Y., Reiprich, T. H., Böhringer, H., Tanaka, Y., & Kitayama, T. 2002, A&A, 383,773
- Jenkins et al. (2001) Jenkins, A., Frenk, C. S., White, S. D. M. et al. 2001, MNRAS, 321, 372
- (17) Kaiser, N. 1986, MNRAS 222, 323
- Lumb (2003) Lumb, D., Bartlett, J. G., Romer, A. K. et al. 2003, A&A, in preparation.
- (19) Markevitch, A. 1998, ApJ 504, 27
- Nichol et al., (1999) Nichol, R. C., Romer, A. K., Holden, B. P. et al. 1999, ApJ 521, L21
- (21) Novicki, M. C., Sornig, M., Henry, J. P. 2002, AJ 124, 2413
- Oukbir (1992) Oukbir, J., & Blanchard, A. 1992, A&A 262, L21
- Oukbir (1997) Oukbir, J., & Blanchard, A. 1997, A&A 317, 10
- Oukbir, Bartlett, & Blanchard (1997) Oukbir, J., Bartlett, J. G., & Blanchard, A. 1997, A&A 320, 365
- Pierpaoli, Scott, & White (2001) Pierpaoli, E., Scott, D., & White, M. 2001, MNRAS, 325, 77
- Reichart et al. (1999) Reichart, D. E., Nichol, R. C., Castander, F. J. et al. 1999, ApJ 518, 521
- Reiprich (2002) Reiprich, T. H., & Böhringer, H. 2002, ApJ 567, 716
- Rosati et al. (1998) Rosati, P., Della Ceca R., Norman, C., & Giacconi R. 1998, ApJL 492, 21
- Rosati, Borgani, & Norman (2002) Rosati, P., Borgani, S., & Norman, C. 2002, ARAA 40, 539
- Rosati (1995) Rosati, P., della Ceca, R., Burg, R., Norman, C., & Giacconi, R. 1995, ApJL 445, L11
- Romer et al., (2000) Romer, A. K., Nichol, R. C., & Holden, B. P. et al. 2000, ApJS 126, 209
- Roussel et al. (2000) Roussel, H., Sadat, R., & Blanchard, A. 2000, A&A 361, 429
- Sadat (1996) Sadat, R., Blanchard, A. & Oukbir, J. 1998, A&A 329, 21
- (34) Seljak, U. 2002, MNRAS, 337, 769
- (35) Sheth, R. K., Mo, H. J., & Tormen, G. 2001, MNRAS, 323 1
- (36) Spergel, D. N., Verde, L., Peiris, H. V. et al. (WMAP collab.) 2003, ApJS 148, 175
- Vauclair (2003) Vauclair, S. et al. 2003, in preparation.
- Viana (1999) Viana, T. P. & Liddle, A. R. 1999, MNRAS, 303, 535
- Vikhlinin et al. (1998) Vikhlinin, A., McNamara, B. R., Forman, W. et al. 1998, ApJ, 502, 558
- Vikhlinin et al. (2002) Vikhlinin, A., VanSpeybroeck, L., Markevitch, M., Forman, W.R., & Grego, L. 2002, ApJL, 578, 107
- Voit (2003) Voit, M. 2000, ApJ, 543, 113
- White (2002) White, M. 2002, ApJS, 143, 241