The Discovery of Quasisoft and Supersoft Sources in External Galaxies
Abstract
We apply a uniform procedure to select very soft sources from point sources observed by Chandra in galaxies. This sample includes one elliptical galaxy (NGC 4967), face-on spirals (M101 and M83), and an interacting galaxy (M51). We report on some intriguing results, including the following.
(1) We have found very soft X-ray sources (VSSs) in every galaxy. Some of these fit the criteria for canonical supersoft sources (SSSs), while others are somewhat harder. These latter have characteristic values of eV; we refer to them as quasisoft sources (QSSs). We found a combined total of VSSs in the galaxies we considered; 77 were SSSs and 72 were QSSs.
(2) The data are consistent with the existence of a large VSS population, most of whose members we cannot observe due to the effects of distance and obscuration. The total VSS population of sources with erg s-1 in each galaxy could be on the order of .
(3) Whereas in M31 only of all X-ray sources detected by Chandra are VSSs, more than of all detectable X-ray sources in the face-on galaxy M101 fit the phenomenological definition of VSSs. This difference may be due to differences in between typical lines of sight to sources in each galaxy.
(4) SSSs can be super-Eddington for Chandrasekhar mass objects.
(5) We find evidence for SSSs and QSSs with luminosities erg s erg s-1. These sources have luminosities lower than those of the soft sources used to establish the class of SSSs.
(6) In the spiral galaxies M101, M83 and M51, a large fraction of the SSSs and QSSs appear to be associated with the spiral arms. This may indicate that some SSSs are young systems, possibly younger than years.
(7) In addition to finding hot white dwarfs and soft X-ray binaries, our method should also be efficient at selecting supernova remnants (SNRs). A small fraction of the VSSs in the spiral arms of M101 appear to be associated with SNRs.
1 Introduction
Chandra and XMM observations make it possible to systematically discover and study very soft X-ray sources (VSSs) in external galaxies. Until now, the canonical examples of VSSs were luminous supersoft X-ray sources (SSS). The SSSs that established the class lie in the Magellanic Clouds and in the Milky Way; they have in the range of tens of eV and luminosities between roughly erg s-1 and a few times erg s-1. Chandra and XMM surveys in other galaxies are important, since gas obscures more than 99% of the Milky Way’s SSSs, so that direct studies of the size and characterics of galactic populations of SSSs can be carried out only in other galaxies.
This paper is the third is a series on the selection of VSSs in external galaxies. In paper 1 (Di Stefano & Kong 2003a), we presented a set of strict hardness ratio conditions (the “HR conditions) to select only the softest sources. Sources selected by the HR conditions are likely to have spectra very similar to those of the SSSs observed in the Galaxy and Magellanic Clouds. Also in paper 1 we tested the HR conditions by applying them to Chandra data from galaxies. In paper 2 (Di Stefano & Kong 2003b), we presented an algorithm that starts with the HR conditions, but which then proceeds to progressively relax them. Each set of relaxed conditions chooses sources that deviate from the expected broadband spectra of SSSs in some way. For example, the conditions select sources that may be as soft as SSS-HRs, but which provide too few photons to satisfy the stronger HR conditions. Any source satisfying either the HR or conditions is called a classical supersoft source, or simply an SSS (SSS-HR or SSS-). In addition, there is a set of conditions which can select either highly absorbed SSSs, or sources that are genuinely harder than the SSSs studied in the Galaxy and Magellanic Clouds. We refer to any source which satisfies one of these weaker conditions as a quasisoft source (QSS). For example, the “NOH” conditions can select quasisoft sources (QSS-NOH) located behind large gas columns. Other conditions (e.g., the “” conditions) select sources (QSS-) which may have a dominant component as soft as SSSs, but which also include a small hard component. All sources selected by the algorithm, whether they are supersoft or quasisoft, are referred to as very soft sources (VSSs).
In this paper, we apply the full algorithm to data from the same galaxies considered in paper 1: M101, M83, M51, and NGC 4472. Because the HR conditions have already been applied, we could have left SSS-HR sources out of this analysis. We decided however, to include them, because it is useful to explicitly compare their properties with those of the other soft sources identified by higher steps in the algorithm.
2 Data Analysis
For M101 and M51, we generated our own source lists with the CIAO tool WAVDETECT. For M83 we used a source list provided Soria & Wu (2003), and for NGC 4697 we used the source list of Sarazin et al. (2001). For M101 and M51, we set the input parameters for WAVDETECT to cover the energy range 0.1–7 keV. For galaxies in which the lower energy limit used by WAVDETECT was greater than 0.1 keV, we carried out a visual inspection to search for any sources with reliable detections but with few photons detected above 0.3 keV. Source counts in each energy band were determined via aperture photometry. The radius of the aperture was varied with off-axis angle in order to match the 90% encircled energy function. Background was chosen from an annulus region centered on each source. We note that, while the calibration at the lowest energies ( keV) will need to be refined for spectral fits, source detection algorithms should include photons with energies as low as keV if all SSSs and QSSs are to be detected. In of the galaxies, photons with energies between keV and keV have helped to detect a small number of SSSs and QSSs. Because visual inspection of each source must be carried out anyway, any spurious sources detected because of background effects at low energy can be easily eliminated.
In addition to estimates of the number of background objects based on the Chandra Deep Field data (see the references in each of the galaxies below), we also used the ChaMP (Chandra Multiwavelength Project 111http://hea-www.harvard.edu/CHAMP) archives (P. Green, private communication) to estimate the contamination from soft X-ray sources in the foreground (X-ray active stars) and background (e.g., soft AGN). In 5 ACIS-S observations with durations of ks, only 3 sources were found to be QSSs; no SSSs were identified. We therefore believe that the background contribution of soft sources is small compared with the large population of SSSs in our sample galaxies.
2.1 The Sources
2.1.1 M101
M101 (= NGC5457) is a face-on nearby (5.4–6.7 Mpc) spiral and was observed by Chandra ACIS-S for about 100ks on 2000 March 26-27. Detailed results of the observations have been reported by Pence et al. (2001). We generated our own source list here with CIAO task WAVDETECT instead of CELLDETECT used by Pence et al. (2001). We also used different energy bands covering 0.1–7 keV, instead of 0.125–8 keV in Pence et al. (2001). Pence et al. (2001) estimated that 27 sources are possible background AGN. While the source lists agree with each other generally, we found 8 additional sources (118 in total) in the S3 chip. The list of SSSs and QSSs is shown in Table 2. We found a total of 53 VSSs; 32 were SSSs and 21 were QSSs.
2.1.2 M83
M83 (= NGC5236) is a barred spiral galaxy with low inclination angle (); it has a starburst nucleus and the estimated distance ranges from 3.7 Mpc to 8.9 Mpc. A Chandra ACIS-S observation was taken on 2000 April 29 for about 50ks. The X-ray point source properties and the nuclear region were discussed by Soria and Wu (2002,2003). One hundred and twenty seven point sources were found in the S3 chip (0.3–8 keV) and approximately 10 sources are likely to be background AGN. We used this source list for our analysis. In addition, visual inspection from a 0.1–1 keV image discovered 1 new SSS. Table 3 lists M83’s SSSs and QSSs. We found a total of 54 VSSs; 28 were SSSs and 26 were QSSs.
2.1.3 M51
M51 (= NGC5194) is a nearby (7.7–8.4 Mpc) interacting spiral galaxy with moderate inclination (). A Chandra ACIS-S observation was performed on 2000 June 20 for about 15ks. A detailed analysis of the data is given by Terashima & Wilson (2003). We generated our own source list with the CIAO task WAVDETECT. A total of 72 sources (in 0.3–7 keV) were found in the S3 chip. About 10 of the sources are expected to be background objects. All SSSs and QSSs are listed in Table 4. We found a total of 23 VSSs; 13 were SSSs and 10 were QSSs.
2.1.4 NGC4697
NGC4697 is an elliptical galaxy at a distance of 11.7–23.3 Mpc. It was observed by Chandra ACIS-S on 2000 January 15-16 for about 40ks. Ninety point sources were detected in the S3 chip (0.3–10 keV; Sarazin, Irwin, & Bregman 2001); about 10–15 background objects are expected in the observation. The complete source list and results from this observation can be found in Sarazin et al. (2001). We also inspected an image from 0.1–1 keV and found 1 new uncatelogued SSS. Table 5 lists the SSSs and QSSs found with our selection procedure. We found a total of 19 VSSs; 4 were SSSs and 15 were QSSs.
2.2 Spectra of Very Soft Sources
2.2.1 The Spectra
Individual Sources: To determine whether our algorithm selects sources that are genuinely soft, we have extracted the energy spectra of all very soft sources that provided more than counts. Background counts were extracted in annulus regions centered on each source. There are such sources. We have also considered the spectra of sources with more than counts, although the uncertainties in spectral parameters are large. A representative spectrum of a QSS- source is shown in Figure 1. The spectral fits are list in Table 6.
Composite Spectra: Because many VSSs are faint, fits of individual spectra are not possible. If, therefore, we found a number of sources that (1) had been identified by the same criteria, and which (2) displayed similar broadband spectra and (3) provided a total of approximately counts, we extracted the composite energy spectra (see e.g., Figure 1).
Because the response matrices vary across the detector, a weighted RMF and ARF was generated following the thread recommended by the Chandra X-ray Center222http://asc.harvard.edu/ciao/threads/wresp_multiple_sources. Results are presented together with the individual spectra in Table 6.
The analysis of Chandra spectra of VSSs is fraught with uncertainties because the low-energy ( keV) calibration of ACIS-S is not yet well understood 333 We have, e.g., data on all of the nearby SSSs, and find anomalous behavior at low energies that appears to be related to the difficulties encountered so far with the low-energy calibration. Some of these anomalies would be less obvious in the distant sources we discuss here, because the total number of counts is generally relatively small; calibration uncertainties may nevertheless affect the derived values of spectral parameters. . It is therefore important to keep in mind that the spectral fits of SSSs, especially those that peak at energies near or below keV are not on the same footing as the spectral fits of higher-energy sources, and may need to be reanalyzed once the low-energy calibration has been better studied.
We also note that the quantum efficiency degradation of ACIS at low energies is important for SSSs and QSSs. The degradation has been shown to be a function of time and is most severe at low energies444see http://asc.harvard.edu/cal/Links/Acis/acis/Cal_prods/qeDeg/. For a source with blackbody temperature of 100 eV and cm-2, the ACIS-S counts below 2 keV had dropped by about 30% one year after the launch and by almost 50% after two years (P. Plucinsky, private communication). Fortunately this problem has been well studied and it is possible to take the effect into account. We therefore applied corrections using the ACISABS absorption model in XSPEC 555http://www.astro.psu.edu/users/chartas/xcontdir/xcont.html. This model allows us to correct the response by inputting the number of days between Chandra’s launch and the observation. We find that, for very soft sources, the degradation mainly affects the best fit value of the uncorrected model tends to over-estimate the value (see also Kong et al. 2002).
For each spectral fit, we selected photons within a circular region centered on the source. Only keV data were used. We first fit the spectra with simple one-component models including absorbed power-law, blackbody and Raymond-Smith (RS) models. In all but three cases, an absorbed blackbody model can provide a good fit. For the three exceptional spectra, we added an additional power-law component or fit with a RS model in order to derive an acceptable result.
Table 6 shows that, as expected, sources satisfying the HR conditions are generally the softest. While the other sources tend to be harder, all but 1 satify the conditions used to define VSSs (Di Stefano & Kong 2003a); M51-10 appears to be marginally harder. We note one unusual feature. This is that, in each galaxy, typical values of associated with the fits of QSSs are significantly higher than the minimum value of along the direction to the galaxy. If, however, internal absorption is not a significant factor for most SSSs and QSSs, the distribution of should mirror the spatial distribution of SSSs along the line of sight within the galaxy. That is, since SSSs and QSSs are generally expected to be evenly distributed along the line of sight, values of should range from approximately the Galactic value along that line of sight to a high of where is the scale height of the galaxy (in pc) and is the angle between the normal to the galactic plane and the line of sight. (We have assumed that, within the galaxy, there is on average one hydrogen atom per cubic cm.) For the galaxies we have studied, this generally means that should range from a few times cm-2 to a few times cm Because absorption interferes with very soft source detection, we expect a bias toward values of on the lower end of this range. Yet, the values of associated with the QSS fits summarized in Table 6 tend toward the high end. This could imply that internal absorption is generally high in QSSs. We note however that it is also possible that there is a systematic bias in the fits, perhaps due to an overestimate of the efficiency with which ACIS is detecting soft X-ray photons. (See also §5.3.2.) Improvements in the low-energy calibration are required to resolve this issue.
2.2.2 Special Cases
M101-102 is an ultraluminous SSS ( erg s-1). No one-component model provides an acceptable fit. We therefore fit the spectrum with an absorbed blackbody plus RS model. We found that the 91 eV blackbody component contribute 85% of the X-ray emission in 0.3-7 keV. This source has recently been studied by Mukai et al. (2002), Di Stefano & Kong (2003a) and Kong & Di Stefano (2004).
In other cases, blackbody models did not provide acceptable fits. M101-53, a QSS, found by applying the “” condition, can be fit by a RS model with keV. A composite of QSS-SNOH sources in M101 requires a two-component model (RS plus power-law). The RS temperature is 0.25 keV and the photon index of power-law is 2.4; the thermal component contributes about 22% of X-ray emission. We suspect that M101-53 and one or more of the SNOH sources comprising the composite may be supernova remnants.
Four QSS candidates in M83 (M83-116, M83-117, M83-119 and M83-120) are near the nucleus where the diffuse emission contaminates the source spectra. Moreover, M83-116, M83-117 and M83-119 are near () to each other while M83-120 has a nearby bright X-ray source. These circumstances make the spectral analyses difficult, and we therefore took special steps to fit the spectra of these sources. In each case, in addition to the source spectrum, we also extracted a spectrum from a source-free region in an adjacent area with diffuse emission. We used this latter as background. After background (diffuse emission) subtraction, we fit the spectra with single-component models and the results are listed in Table 6. Blackbody models with temperatures of eV gave acceptable fits to M83-116 and M83-119. For M83-117 and M83-120, the background appeared to be over-subtracted and no single- or two-component model provided a good fit. We therefore considered the source spectrum without background subtraction and fit a two-component model (MEKAL + blackbody). The MEKAL component represents the contribution of the diffuse emission (see Soria & Wu 2002) while the blackbody component corresponds to the spectrum of the point source. Table 6 lists the best-fit results. The MEKAL plasma temperature is roughly consistent with the value for the diffuse emission found previously (Soria & Wu 2002) while the blackbody temperature is about 60 eV. The flux contribution of the blackbody component is 82% and 43% for M83-117 and M83-120, respectively.
2.2.3 Tests of the Selection Algorithm
SSSs: The spectral fits allow us to determine what sorts of sources are selected by our algorithm. As expected, the HR conditions are the most stringent. When applied to M101, M83, M51, and NGC 4697, they identified sources that have eV. Even for the ultraluminous source in M101 (M101-102), which required a two-component fit, fewer than of the energy was emitted in the form of photons with energies above keV. In addition, the values of among the HR-identified sources are distributed more-or-less uniformly between a few cm-2 and a few cm roughly consistent with the expected distribution of obscuring gas. Thus, the HR conditions seem to identify sources with the spectral characteristics expected of classical SSSs.
The SSS category encompasses both SSS-HRs and SSS-s. The SSS- category should consist of very soft sources with count rates too low to allow the straight HR conditions to be satisfied. In the 4 galaxies, no SSS- provided enough enough photons to allow a spectral fit. To carry out a fit we therefore considered a composite of 7 SSS- sources. Although this composite spectrum appears to be significantly harder than the SSS-HRs, both the formal and systematic uncertainties (the latter largely associated with creating the composite spectrum) are large. We therefore note that our results on SSSs are dominated by the bright SSS-HRs in our sample.
QSS: We were able to derive fits for QSSs and QSScomposites identified by using other conditions. As is to be expected, the photon statistics were generally not quite as good for sources identified via the other conditions, and the uncertainties in the spectral parameters are greater.666There were a relatively large number of photons associated with each of the sources near the center of M83, but the effects of the diffuse emission introduce additional uncertainties. The fits of two of these spectra (M101-53, and the SNOH composite in M101) seem compatible with what we might expect for SNRs. For the other spectra, the best-fit temperatures are generally higher than for sources in the HR category. Nevertheless, with just one exception, eV.
Comparison:
The QSS spectra are generally harder and the values of
appear to be systematically higher.
In fact of the fits yield values of larger than the
largest value derived for HR-identified sources. In at least
cases, internal absorption would have to be very significant,
or the gas would have to be associated with a high-gas-density
region, in order for the derived values of to be physical.
This could be a genuine selection effect, since some of these
categories were especially designed to allow us to identify SSSs
located behind large gas columns, which could be associated with the system or which
could be spread out along the line of sight.
2.3 Luminosity
2.3.1 Luminosities
When spectral fits are possible for only a small fraction of sources in an external galaxy, the luminosity function is usually computed by assuming that a single factor can convert the count rate of each source into an estimated source luminosity. The uncertainties can be estimated by using a set of spectral models (perhaps drawn from those that fit the high count-rate sources) to compute independent conversion factors, and using them to derive a range of physically plausible LFs. For VSSs, however, the conversion from count rate to luminosity depends critically on both the source temperature and the value of To gain insight into the distribution of luminosities we can therefore rely only on the sources for which we have spectral fits. In table we list the computed luminosities for each source and composite for which we derived spectral fits. For each source we list both a low value of the luminosity (assuming that the galaxy’s distance from us is the minimum listed in Table 1) and a high value (assuming that the galaxy’s distance from us is the maximum listed in Table 1). We have used these values to compute LF for the associated VSSs using the lower distance estimate. For those sources that are composites, we have assumed that the spectra of the sources contributing to the composite are similar. We have therefore assigned to each source a fraction of the total luminosity that is equal to the fraction of the total counts contributed by that source. In total, sources contribute to our LF: single sources and sources whose luminosities were determined by studying the spectrum of a composite to which they contributed. The results are shown in Figure 2.
While the function shown in Figure 2 displays some interesting-looking features, it is not possible to compare it directly to the LFs of galactic populations of harder sources. Perhaps the largest uncertainty is that we do not know how well our assumed distribution of luminosities for sources comprising composites reflects reality. In addition, for some of the composites, the temperatures and luminosities are not very well constrained. Finally, we do not know how well this distribution reflects the characteristics of the dimmer sources in our sample. Nevertheless there are a few noteworthy features. Among the sources in this sample, about have ergs s-1 and 27% of the sources have ergs s-1 .
Referring to Table 6, we find that the low-luminosity sources ( ergs s-1) tend to have high temperatures, between and eV. The high temperature of the low-luminosity sources is a selection effect–we simply would not have detected these sources had their temperatures been well under eV. It is, however, interesting that there are low-luminosity sources with such high temperatures. One of the predictions of nuclear-burning WD models is that the luminosities and temperatures are larger for WDs of higher mass. Low-L/high-T sources do not seem to fit this pattern. Given the uncertainties in the spectral parameters, and the assumptions made about the composite spectra, it may be too early to conclude that the apparent low-L/high-T sources are not nuclear-burning white dwarfs (NBWDs). But the data do suggest that these systems may be described by a different physical model.
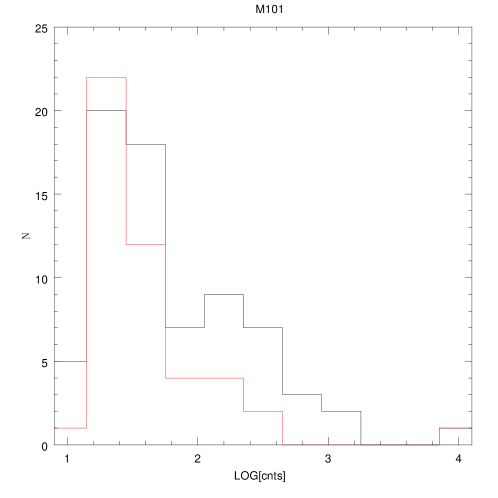
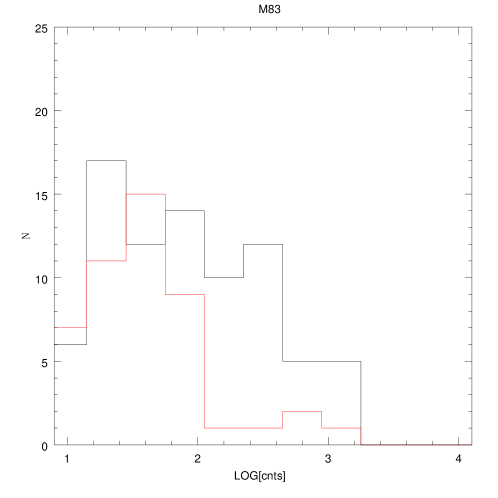
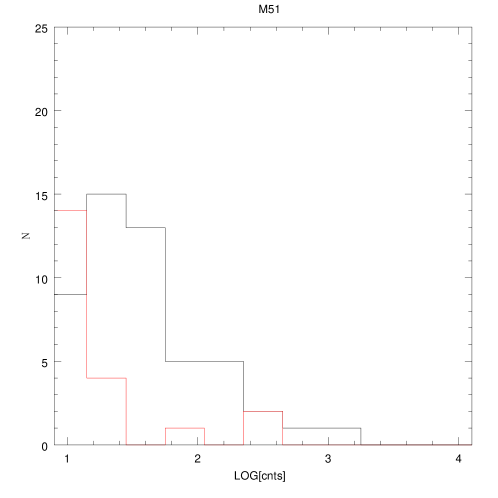
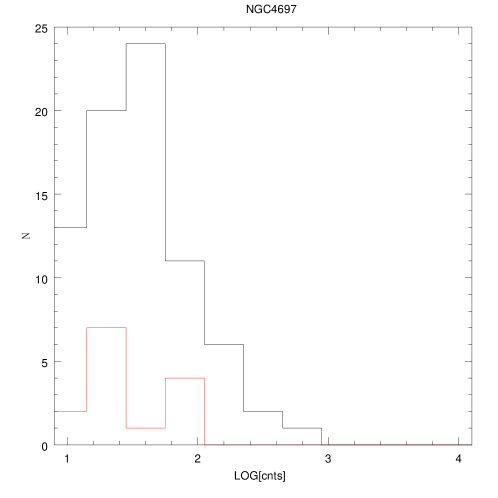
2.3.2 Count Rates
Figure 3 shows, for each galaxy, the distribution of count rates for VSSs (red) and for all other sources (black). There are no obvious breaks in the distributions as we approach lower count rates. This indicates that, if we had longer and/or more sensitive observations, we would detect both VSSs and other sources that are even dimmer than the sources discovered so far.
In general, there are fewer VSSs than non-VSSs in each galaxy. This is especially true for NGC 4697 and M51. There is nevertheless some preliminary evidence that count-rate distribution for VSSs in each galaxy is more sparsely populated at high-count-rates. This makes the few high-count-rates SSSs particularly interesting.
2.3.3 Ultraluminous SSSs
One of the VSSs is clearly an ultraluminous X-ray source (ULX). With a luminosity that appears to be larger than ergs s-1, M101-102 (a HR source) is clearly super-Eddington for a neutron star. It cannot be explained by a NBWD model. Three of the sources in NGC 4697 are also particularly luminous. The sources comprising the HR composite in NGC 4697 are roughly equally bright. The luminosities of the individual sources would therefore be ergs s-1 if the distance to NGC 4697 is Mpc, but they could be as high as ergs s-1 if the distance to NGC 4697 is Mpc. If the true luminosities are sub-Eddington for a object, then these systems could include NBWDs that are both hot and bright because they are approaching the Chandrasekhar limit. Since super-Eddington luminosities can occur during short-lived states (e.g., in Nova LMC 1990#1; see Vanlandingham et al. 1999), it will be important to study the time variability properties of such luminous soft sources.
2.4 Location
Identifying very soft sources in external galaxies allows us to determine their locations relative to galaxy populations of young and old stars and also relative to the nucleus, spiral arms, and other galactic structures. This information can in turn, provide valuable clues to the natures of the sources.
2.4.1 Near the Galaxy Centers
It is impossible to detect the soft X-radiation from any SSSs/QSSs that may be near the center of the Milky Way. Furthermore, because the nature(s) of the sources are not well understood, there were no predictions about whether we should find SSSs/QSSs near galaxy centers. In M51, we excluded the inner because of possible contamination from the central AGN. In each of the other galaxies, we would have discovered any SSSs located near the center. Only M83 has SSSs/QSSs within pc of the galaxy center. The sources identified by the conditions, M83-116, M83-117, and M83-120 are within of the nucleus. Because of possible contamination from the diffuse emission, it will require further study to determine if these are genuine point sources.
All of the galaxies in our sample have VSSs within 1 kpc of the center. The significance of the value of 1 kpc is that this is the distance a source moving at an average speed of 200 km s-1 could travel in 5 million years. If a very soft sources is the stripped core of a tidally disrupted giant, then its maximum lifetime as a soft source should be approximately years (Di Stefano et al. 2001).
M101: There are SSSs and QSSs within 1 kpc; of these were selected by the HR conditions, by HR1, and one by There are additional X-ray sources within kpc.
M83: There are SSSs and QSSs within 1 kpc; HR, source, sources, and, HR1. That same region contains a total of X-ray sources. We note however, that the only sources within pc of the center are very soft sources, suggesting that it is important to to verify or falsify the point-like nature of these diffuse-emission-contaminated sources.
M51: There is just one (QSS-) source within kpc of the center of M51, while there is a total of X-ray sources in this region.
NGC 4697: SSS and QSSs ( HR, SNOH, and HR1) are located within kpc of the galaxy center. Only of all of NGC 4697’s X-ray sources are located within kpc of the center.
These results are summarized in Table 7, where we also compute a central concentration factor for both very soft sources and all X-ray sources. Let () represent the fraction of very soft sources (all X-ray sources) found within kpc of the galaxy’s center. In addition, let be the fraction of the galaxy’s total surface area comprised by a kpc disk. The concentration factor for SSSs, is computed as follows.
| (1) |
Table demonstrates that X-ray sources are centrally concentrated in all galaxies. It also demonstrates significant differences among the galaxies, with relatively mild central concentration () in M101, moderate concentration () in M83 and M51, and heavy concentration concentration () in NGC 4697. Only in NGC 4697 are the SSSs significantly more centrally concentrated than other X-ray sources. These results suggest that a more complete study is warranted. More galaxies need to be included and the fall off of optical light versus X-ray source density should be studied. Since the central regions are dense in sources of optical light, comparing the X-ray source distribution to that of optical light could provide insight into the mechanisms by which the X-ray sources are produced.
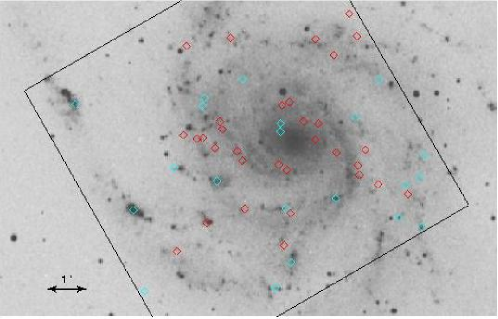
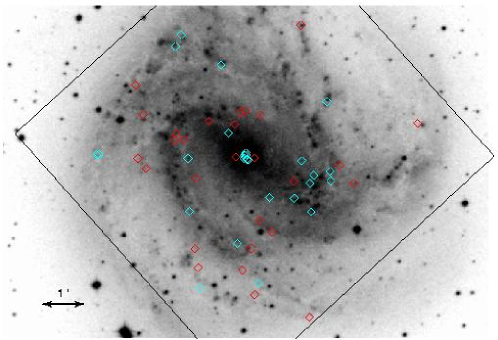
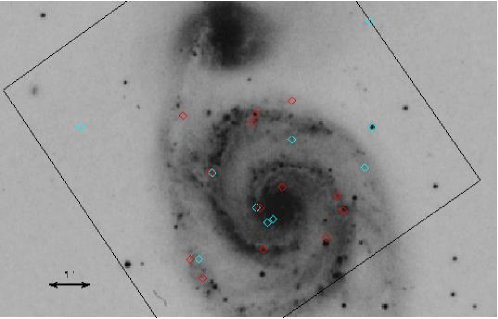
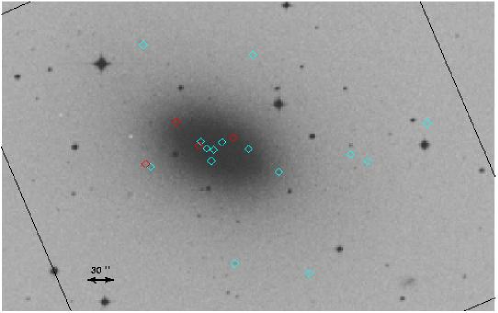
2.4.2 In the Spiral Arms
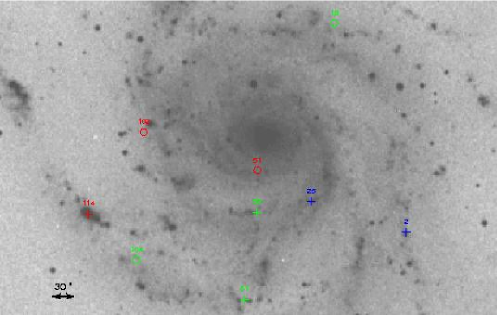
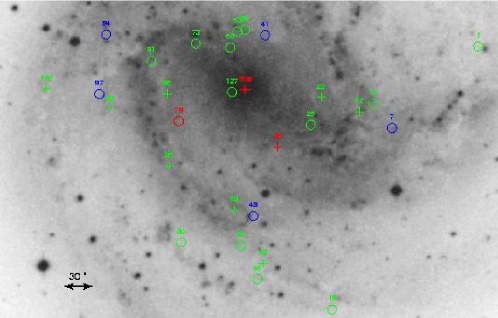
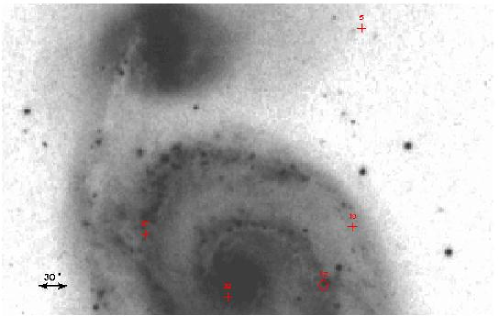
Superposing the positions of the SSSs and QSSs on optical images of each of the spiral galaxies produces an impression that a large fraction of the SSSs and QSSs are in the spiral arms. (See Figure 4 for all of the sources and Figure 5 for those sources with spectral fits.) In most cases, populations found in the spiral arms are young populations, with ages on the order of years. If, therefore, SSSs are primarily associated with WDs orbiting low-mass () companions, we would not expect them to be a spiral arm population, but to be spread across the face of the galaxies in a manner that resembles the distributions of planetary nebulae (PNe) or recent novae. (Indeed, we expect some SSSs to be central stars of PNe or to be recent novae.)
Old populations or intermediate age populations (with current ages greater than a few times years), should not be primarily associated with spiral arms. Certainly we expect some of the systems we have observed as SSSs to be old. Novae, for example, should be scattered throughout the body of each galaxy. In addition, because the donors in symbiotics are giants with masses typically below (Kenyon 1986), they should also be older than years. of Galactic SSSs with optical IDs are either novae or symbiotics, as is of SMC SSSs with optical IDs, and of LMC SSSs with optical IDs. One SSS and QSS in M31 are tentatively identified with symbiotics (Di Stefano et al. 2003), as is nova (Nedialkov et al. 2002); these constitute the only optical IDs of SSSs in M31. Of the remaining SSSs with optical IDs in the Magellanic Clouds and Galaxy, are candidates for the close-binary supersoft source (CBSS) model. The donors in CBSSs are thought to main sequence or slightly evolved stars with below approximately Whether the donor is slightly evolved or on the main sequence, the ages of the systems at the time mass transfer begins the SSS phase is typically larger than years. Thus, although detailed population synthesis compuations are needed to quanitfy the relationship between location, level of activity, and age, it seems clear that most WD SSSs (with the possible exceptions of very hot central stars of planetary nebulae descended from massive stars, or accretors of heavy winds from massive companions) should not be part of young populations.
More convincing than a visual impression of an association between the locations of VSSs and the spiral arms, would be a meaningful statistical correlation between the positions of the VSSs and the positions of markers of young populations, such as SNRs, OB associations, and HII regions. Work is underway to study these correlations in M101. Below we mention some specific cases in which SSSs are close to optical markers in M101. The results of a statistical analysis will be reported elsewhere.
Nine of the VSSs (7 SSSs and 2 QSSs) are within ( pc, at the distance to M101) of supernova remnants (SNR; Matonick & Fesen 1997). While at this point we cannot make a convincing identification between the VSSs and the nearest SNR to each, it is likely that a subset of these VSSs may in fact be associated with SNRs, especially since all of the SSSs are within ( pc) of an SNR. Astrometric study is underway to assess the likelihood of genuine identifications. Because all sources have relatively low count rates, we do not have spectra.
In addition, distinct VSSs (11 SSSs and 8 QSSs) are within of an HII region (Scowen et al. 1992), with one SSS located near HII regions, and VSSs (1 SSS and 1 QSS) each located near distinct HII regions. We have spectra for of these sources. M101-104 and M101-51, each identified through the strong HR conditions, are among the softest sources in our sample, with of eV and eV, respectively. M101-114 was identified through the MNOH condition, and is well fit by a eV model; the uncertainties in the fit yield a maximum value of of eV. We have conjectured that M101-53, identified through the condition, may be an SNR, since the best-fit model was an RS model with keV. Furthermore, QSS is within of a PN (Feldmeier et al. 1997).
If indeed we can establish a spatial correlation between VSSs and markers of young stellar populations, and if this correlation is significantly larger than the correlations between PNe (and novae) and markers of young stellar populations, then we will be forced to conclude that a substantial fraction of VSSs are members of relatively young stellar populations.
We must then consider whether the VSSs we are identifying are dominated by SNRs. It should be possible to distinguish SNRs from VSSs which are X-ray binaries by taking multiple X-ray images; SNRs, whose emission emanates from regions extending over several parsecs, should not be variable on time scales of months to a few years, while most other VSSs are highly variable over these time scales (Kong & DiStefano 2003a; Di Stefano & Kong 2003b; Di Stefano et al. 2003; Fabbiano et al. 2003). We note that some SSSs which are X-ray binaries are expected to be associated with ionization nebulae. If the nebulae are not too dim or too diffuse, VSSs of medium (likely to be SNRs) and VSSs of lower-T (more similar to SSSs in the Milky Way and Magellanic Clouds) may be distinguished by various sets of line ratios (see, e.g., Rappaport et al. 1994, Di Stefano, Paerels & Rappaport 1995, Chiang & Rappaport 1996).
Even before such follow-up observations are conducted, we can conclude that it is unlikely that the VSS populations we have identified are dominated by SNRs. First, this would be counter to the trend discovered by Long et al. (1981) for the Magellanic Clouds. The SSS binaries, CAL 83 and CAL 87 had hardness ratio [(H-S)/(H+S), where S includes photons between and keV and H includes photons between and keV] of and respectively. No SNR is as soft as CAL 83 and only are as soft or softer than CAL 87. X-ray luminosities are quoted for of these SNRs, and they range from erg s-1 to erg s-1. They would not be detected in any of the galaxies we have studied. Although it may be the case that some SNRs have both spectra and luminosities more typical of SSS X-ray binaries (see, e.g., Kong et al. 2002; Kong et al. 2003; Swartz et al. 2002), the survey of the Magellanic Clouds is consistent with a general trend in which SNRs become larger, softer, and less luminous with time. The second reason we doubt that the VSS population we identify is dominated by SNRs, is that the total populations of VSSs in the Galaxy, the Magellanic Clouds, and in M31 are certainly not dominated by SNRs. In M31 (Di Stefano et al. 2003), the VSSs identified by our criteria are highly variable on time scales of months to years, so that the X-ray emission cannot be coming from an extended region. (See the SSS catalog [Greiner 2000] for a summary of the properties of SSSs in the Galaxy and in the Magellanic Clouds.)
3 The Size of Galactic SSS Populations
The SSSs we have detected in each galaxy comprise a small fraction of all of the VSSs within the galaxy. We detect primarily the hottest, brightest VSSs. This effect becomes even more pronounced for distant galaxies and/or for (a) galaxies located along lines of sight with large values of (b) galaxies with large internal gas components, or (c) spiral galaxies with large inclination angles.
To estimate the size of the total population, we must determine what fraction of all the sources we can (1) detect and (2) identify as VSSs. The second requirement is more restrictive, as typically more than photons are needed. Assuming that at least photons are needed, we can compute, for each temperature and each value of the minimum luminosity of a detectable VSS in each galaxy. We have done these computations for each value of and used in the PIMMS simulations described in paper 2 (Di Stefano & Kong 2003b).
If we knew the true distribution of VSS properties ( and , assuming that thermal models apply) and the spatial distribution of gas within each galaxy, we would be able to compute the true fraction of VSSs we should have detected and identified in each galaxy. We could even check whether the properties of the sources we actually do detect match those of the predictions. Unfortunately, however, we do not know enough about VSSs to make reliable first-principles calculations possible.
What we can say is that galactic VSS populations can productively be viewed as having components.
3.1 The “classical” SSSs
The first component mirrors the SSSs studied by ROSAT to first establish the class. A significant fraction of these are candidates for binaries which include a NBWD. Distributions of source properties for this class were computed by Rappaport, Di Stefano & Smith (1994; RDS) and later used by Di Stefano & Rappaport (1994) to estimate the fraction of SSSs that the ROSAT All-Sky Survey had discovered in the Galaxy, M31, and the Magellanic Clouds. Although specifically constructed to mimic the distributions of CBSS properties, the RDS distributions seemed to fairly well represent the properties of all SSSs discovered during the early 1990s. (Note however, that the source properties were only established for about a dozen sources and that they were poorly constrained.)
We have used the same distribution to compute the fraction of all sources like those discovered in the early 1990s that we would have detected and identified in M101, M83, M51, and NGC 4697. To accomplish this we constructed a template of sources from the PIMMS simulations described in §3 of Di Stefano & Kong (2003a). Each source was characterized by a temperature (with ranging from eV to eV), and a value of .
We then carried out a simulation in which we seeded each galaxy with the RDS distribution. The galaxy’s distributions of were modeled in a very simple way. For NGC 4697 we assumed a column of cm-2 for each source. For M101 and M83 we assumed that an SSS has an equal probability of lying behind a column of cm-2 or of cm-2. For M51, which has a higher inclination angle, we assumed that three values of are equally likely: cm-2, cm-2, and cm-2.
For each galaxy, we considered each source in the RDS distribution. Comparing its temperature to the temperature of each source in the template (which is characterized by and ), we computed the luminosity the source would need to have in order to yield counts. If the actual source luminosity was this high or higher, we counted the source as detected.
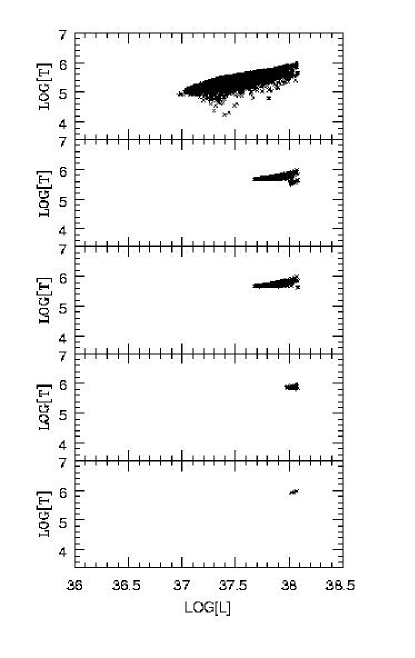
The results are summarized in Figure 6 and in the paragraphs below. The top panel of Figure 6 shows one of the “parent” distributions of “classical” SSSs. The panels below show the members of that parent distribution that would be detected in M101, M83, M51, and NGC 4697, respectively. We have assumed that the distance to each galaxy is the average of the highest and lowest values given in Table 1. In all of these external galaxies, we can detect only the hottest and brightest sources in the distribution. This effect is, however, very pronounced in M51 and especially in NGC 4697, where we can detect only the high-L, high-T tip of the distribution.
M101 and M83: The fraction of sources we would detect ranged from to , with a median value of . This implies that each “classical” SSS detected represents between and SSSs, with a median expectation value of .
M51: The fraction of sources we would detect ranged from to , with a median value of . This implies that each “classical” SSS detected represents between and M51 SSSs, with a median expectation value of .
NGC 4697: The fraction of sources we would detect ranged from to , with a median value of . This implies that each “classical” SSS detected represents between and NGC4697 SSSs, with a median expectation value of .
For each galaxy we now have to estimate the number of classical SSSs detected. Given the limited information we have, it is not presently possible to do this in a reliable way. We could, for example attempt to estimate the number of SSSs that seem different from the “classical” profile and subtract these from the total number of VSSs in each galaxy, to arrive at an upper limit. We do not, however, have enough information about individual sources to make this assessment. On the other hand, the HR category does seem to select sources with temperatures in the appropriate range. Some of these, however, have luminosities that are too large. To make a conservative estimate, we utilize only sources in the HR category, using the total number, of such sources to derive a conservative upper limit, and half of the total in HR to derive a lower limit. This is conservative because it excludes the majority of SSSs in each galaxy. It assumes that the sources identified outside of the HR condition are most likely to represent types of SSSs that are not common in the solar neighborhood or in the Magellanic Clouds.
We multiply the median expectation value for each galaxy by and by to derive a range for the number of “classical” SSSs. For M101 the range is from to . For M83 the range is from to . For M51 the range is from to . For NGC 4697 the range is from to .
There are important caveats. First, for the galaxies that are farthest from us, these estimates would be overestimates, if none of the SSSs we detect actually have the classical profile but are instead more luminous and hotter. This would not imply that NGC 4697 doesn’t have a large “classical” SSS population, rather that we cannot estimate the size of that population based on the data. The second caveat is that, for the spirals that may be closer to us, M101 and M83, the conservative estimates may be underestimates.
3.2 Nova-like variables and other high CVs
The second class of SSSs we expect to inhabit distant galaxies are the low-L ( erg s-1, low-T ( eV) sources that may be associated with nova-like variables or CVs with particularly high accretion rates– systems like V751 Cyg (Greiner et al. 1999; Patterson et al. 2001), and V Sge (Greiner & van Teeseling 1998). These systems would not be detected by the observations carried out so far, so the observations we have used here cannot constrain the sizes of these populations in the galaxies we study. Nevertheless, some reasonable assumptions can be made. First, it is very likely that each of these galaxies houses a population of CVs. If the old stellar populations of the galaxies in our study have similar characteristics to those of the Galaxy, we might expect there to be times as many low-L, low-T SSSs “on” at any given time, as there are SSSs with erg s-1.
3.3 New Classes of Very Soft Sources
It is clear that, among the VSSs we have identified in M101, M83, M51, and NGC 4697, there are sources unlike any found to date in the Galaxy, Magellanic Clouds, or in M31. At this point, it is difficult to estimate the size of these “new” populations. The QSSs comprise one new class. Many are hotter than the canonical SSSs, and may therefore be easier to detect; the catch, however, is that many are near the detection limits. There could be many more below the detection limits. Among the SSSs, we also find low- sources, some with luminosities for their estimated temperatures so low that they may not be consistent with WD models. Most likely, the systems detected so far simply represent the most detectable members of the “new” SSS populations.
To be able to estimate the size of these new populations we need physical models for them, so that population synthesis simulations can produce distributions with which to seed galaxies. We also need further observations of these and of more nearby galaxies, to explore lower luminosities and temperatures.
4 Discussion
The work described in this paper has served three purposes. First, it tests the selection algorithm presented in the companion paper. By fitting spectra to those sources providing adequate numbers of counts, we find that the criteria uniformly select soft sources. As expected from the tests conducted on simulated data (Di Stefano & Kong 2003a), those VSSs fit by blackbody spectra had eV, while all VSSs emitted less than 10% of their flux in photons with energies greater than 1.5 keV. Second, we establish the existence of QSSs. Sources with kT on the order hundreds of eV and erg s-1 appear not to have been observed before. By now, observations in several nearby galaxies, including M31 (Di Stefano et al. 2003a) and M104 (Di Stefano et al. 2003b) verify the result. Finally, investigations have also yielded interesting information about extragalactic SSSs, providing some first steps toward answering the questions posed in Di Stefano & Kong (2003a). We summarize this progress below.
(1) What are typical galactic populations of very soft sources? It is too soon to claim an answer to this question. We can say, however, the SSSs and QSSs seem to exist in virtually every galaxy. (Ongoing analyses of additional galaxies lend further support to this conclusion.) We have so far carried out only a crude population analysis of the galaxies studied here. In each case though, the data is consistent with a population of at least VSSs with erg s-1 active at the time of the observation. The true underlying population of such luminous sources could be several times larger. Observations so far provide evidence for galactic populations of low-luminosity VSSs ( erg s-1), but do not constrain its size. With regard to the potential of VSSs to ionize galactic ISMs, we note that even the most conservative estimate of VSS population for these galaxies yields more than erg s-1 of highly ionizing radiation released by SSSs in typical galaxies. Although the luminosity is smaller than that associated with young stars, photons from VSSs may dominate at high energies.
(2) Are any spiral galaxy parameters related to the relative sizes of SSS and QSS populations? Among the spiral galaxies in this study, there is not enough variation among the values of to allow a search for correlations between and the true size of the SSS/QSS population. The ratio of the number of detected SSSs and QSSs to the total number of detected X-ray sources does vary systematically with inclination (, , and for M101, M83, and M51, respectively). If we limit consideration to sources selected by the HR conditions, which seem to be the softest sources selected, the trend appears even stronger (, , and for M101, M83, and M51, respectively). This might suggest similar sized populations in each of these galaxies.
(3) Do elliptical galaxies house large SSS/QSS populations? The existence of SSSs and QSSs in NGC 4697 demonstrates that there are SSSs in ellipticals. (See also Sarazin, Irwin, & Bregman 2001.) It is difficult to estimate the size of the underlying SSS/QSS populations in galaxies like NGC 4697, largely because we do not yet have good models for the characteristics of the SSS/QSS population in these galaxies. We have demonstrated, however, that, if the sources we detect in NGC 4697 are similar to the SSSs in the Milky Way and Magellanic Clouds that were used to define the class, its population of SSSs is large–about 1250 “classical” SSSs per detected example of a “classical” SSS in NGC 4697. It is possible, however, that many of the detected VSSs are examples of new types of sources. Finally, we note that the data so far are consistent with the hypothesis that a significant portion of the diffuse soft emission found in elliptical galaxies may be due to unresolved SSSs (Fabbiano, Kim, & Trinchieri 1994).
(4) Within spiral galaxies, what are the relative populations of SSSs/QSSs in the galaxy bulges and disks? In the spirals we have studied, , the fraction of SSSs and QSSs located within kpc of the galaxy center is the same as , the fraction of all X-ray sources located within kpc of the galaxy center. The values of vary significantly among the spiral galaxies, however.
(5)
Do galaxies with massive central black holes
have more SSSs/QSSs located within 1 kpc of the nucleus than
comparable galaxies without massive central black holes?
To answer this question, we have to rely on the dynamical
measurements of the central supermassive BH.
M51 is a Seyfert 2 galaxy with a low-luminosity AGN (see, e.g.,
Ho, Filippenko, & Sargent 1997) and it is very likely that there is
a supermassive,
(Hagiwara et al. 2001) BH in the
center. M83 might also harbor a
BH (Thatte et al. 2000).
The concentration factors for SSSs/QSSs in both
M83 and M51 are high, approximately for each galaxy.
The concentration factors for all sources
in each galaxy is comparable, but somewhat smaller.
M101 might have a
supermassive BH (Moody et al. 1995). The relative values
of the concentration factors among the spiral galaxies
suggests that
the concentration of SSSs/QSSs,
and in fact the concentration of all X-ray sources,
scales with the mass of the
central supermassive BH. It is interesting, but not at
this point statistically significant, that the concentration
factors are somewhat higher for SSSs/QSSs.
NGC 4697 appears to have the highest-mass central BH of any of the
galaxies in our sample ().
It is also the galaxy that has the highest concentration factor for
all X-ray sources (
the highest concentration factor for SSSs
(), and the largest difference
between the central concentration of SSSs and other X-ray
sources. From this it seems that interactions near the
galaxy center may be playing an important role in creating X-ray sources,
and that this is especially true for SSSs/QSSs. (An alternative
hypothesis is that the characteristics of the stellar
population near the center differ from those elsewhere in the
galaxy.)
A variety of interactions could enhance the formation of
X-ray binaries near the center of the galaxy; it may
be that the additional enhancement for SSSs is due to
the presence of the cores of stars that have been tidally
disrupted by the central BH.
(6) For all galaxies, are the positions of SSSs and QSSs correlated to the positions of other objects, such as HII regions, planetary nebulae, supernova remnants, or globular clusters? In the spiral galaxies we have studied, the SSSs seem to be concentrated in the spiral arms. Ongoing work on SSSs and QSSs in M101 indicates that they may be preferentially located near HII regions and SNRs, suggesting that some SSSs/QSSs in M101 may be related to young populations.
(7) Are SSSs significant contributors to the rates of Type Ia SNe? It is too soon to say. To use the data to answer this question, we need to estimate the fraction of the SSSs in each galaxy that are accreting WDs. This is difficult to do, even in the Magellanic Clouds. There are, however, some signatures which can help. First, the WD models developed to date invoke donor stars that too old to be concentrated in the spiral arms; the fraction of sources located away from the spiral arms and from regions with recent star formation can provide clues about the size of the NBWD population. Second, some of the accreting WDs that may be Type Ia progenitors should be surrounded by large, distinctive ionization nebulae (Di Stefano 1996).777The reasons are the following. (1) SSSs emit enough photons to ionize large ( pc) regions of the surrounding ISM, if the number density in their surroundings is moderate, on the order of atom cm-3 (Rappaport, Kallman, & Malina 1994). (2) These nebulae have distinctive optical emission signatures that can be significantly different from other nebulae, such as PNe and SNRs (Rappaport & Chiang 1996; Di Stefano Paerels, & Rappaport 1996). (3) These nebulae could be detectable for much of the lifetime of the SSS state ( yrs), as long as the duty cycle is (Chiang & Rappaport 1996). In nearby galaxies where optical counterparts can be identified, we may be able to detect some of the distinctive disk features of close binary SSSs ( days) or to detect the donor stars in wide binary SSSs ( generally is more than 100 days).
4.1 New Questions
(8) What are the ultraluminous SSSs? A natural suggestion is that they are BHs. In fact, if there are BHs with masses filling the gap between the BHs thought to be stellar remnants, and the BHs found at the centers of galaxies, then SSS behavior is predicted for a wide range of masses, source luminosities, and efficiency factors. If BHs with masses in this intermediate range do not exist, or are not found in binaries, then the explanation of ultraluminous SSSs may be more complicated.
(9) What are the low-luminosity high-temperature VSSs? The data provide a hint of a population of sources with temperatures near or over eV, but with luminosities between erg s-1 and erg s-1. NBWDs at this temperature are generally expected to be more luminous. If evidence for this high-T/low-L SSS population is found in other investigations, a new model for some SSSs will be required. At present, there is no “canonical” model for QSSs. Intermediate-mass BHs provide one possible explanation. Consider, e.g., a 200 eV source with erg s-1. This could correspond to a BH of roughly 50 M⊙ accreting at a rate of roughly 1% . (Note that if the bolometric luminosities were significantly smaller, the source might not be expected to be in the soft state.)
(10) Is there a significant population of quasisoft sources and, if so, what is the nature of the sources? Some of the SSSs and QSSs may be SNRs. If so, we expect the flux we measure in observations taken during the next few years to be comparable to the values already measured; some may be associated in optical nebulae. It will be important to search for quasisoft sources that are not SNRs.
(11) If a subset of VSSs are young ( yrs), what are they? Some of them may be SNRs, but we have argued (§5.4.2) that the majority of them are not SNRs. Some may be BHs, some may be neutron stars, perhaps analogs of RX J0059.2-7138. It is even possible that some may be NBWDs. One scenario we propose (R. Di Stefano, in preparation) is one in which a primordial binary with relatively massive stars () evolves into a binary with a massive WD in orbit with a massive star. Even if the primary never fills its Roche lobe, the system could become a symbiotic which experiences an SSS phase. If the primary will fill its Roche lobe, an epoch of irradiation-driven winds prior to contact could also lead to SSS behavior. Finally, in some of these wind-driven systems, the primary mass may be decreased enough that mass transfer is not dynamically unstable when contact is established, and the SSS behavior can continue.
4.2 Prospects
Chandra observations are beginning to help us answer key questions about SSSs and to demonstrate that there are new horizons in SSS research. An unanticipated result of this research is the discovery that galaxies contain a significant number of X-ray sources that appear to be hotter than the canonical SSSs that established the class. Discovering the nature of these QSSs presents a fresh challenge. Continuing observations with both Chandra and XMM should lead to important results. With the publication of this paper we will make our code available to other researchers, and hope that it can facilitate comparative studies of the VSS populations of different galaxies.
URL http://www.mpe.mpg.de/jcg/sss/ssscat.html and maintained by J. Greiner. RD would like to thank the Aspen Center for Physics for providing a stimulating environment, and the participants of the 2002 workshop on Compact Object Populations in External Galaxies for insightful comments. AKHK acknowledges support from the Croucher Foundation. This work was supported by NASA under AR1-2005B, GO1-2022X, and an LTSA grant, NAG5-10705.
References
- (1)
- (2) Chiang, E.& Rappaport, S. 1996, ApJ, 469, 255
- (3)
- (4) Di Stefano, R., Greiner, J., Murray, S., Garcia, M. 2001, ApJ,. 51L, 37
- (5)
- (6) Di Stefano, R. & Kong, A. K. H. 2003a, ApJ, 592, 884
- (7)
- (8) Di Stefano, R. & Kong, A. K. H. 2003b, ApJ, submitted (astro-ph/0311374)
- (9)
- (10) Di Stefano, R. et al. 2003, ApJ, submitted (astro-ph/0306440)
- (11)
- (12) Di Stefano, R. 1996, in Supersoft X-Ray Sources, Proceedings of the International Workshop Held in Garching, Germany, 28 February - 1 March 1996. Lecture Notes in Physics, Vol. 472, edited by Jochen Greiner. Springer-Verlag, Berlin Heidelberg New York, 1996., p.193
- (13)
- (14) Di Stefano, R., Paerels, F., & Rappaport, S. 1995, ApJ, 450, 705
- (15)
- (16) Di Stefano, R., Rappaport, S. 1994, ApJ, 437, 733
- (17)
- (18) Fabbiano, G., Kim, D.-W., Trinchieri, G. 1994, ApJ, 428, 555
- (19)
- (20) Faber, S.M., Wegner, G., Burstein, D., Davies, R.L., Dressler, A., Lynden-Bell, D., Terlevich, R. J. 1989, ApJS, 71, 173
- (21)
- (22) Feldmeier, J.J., Ciardullo, R., Jacoby, G.H. 1997, ApJ, 479, 231
- (23)
- (24) Freedman, W.L., et al. 2001, ApJ, 553, 47
- (25)
- (26) Greiner J. 2000 New Astronomy 5, 137.
- (27)
- (28) Greiner, J., Tovmassian, G.H., Di Stefano, R., Prestwich, A., Gonzalez-Riestra, R., Szentasko, L., & Chevarria, C. 1999, A&A, 343, 183
- (29)
- (30) Greiner, J. & van Teeseling 1998, A&A, 339L, 21
- (31)
- (32) Hagiwara, Y, Henkel, C, Menten, K.M., Nakai, N. 2001 ApJ, 560, L37
- (33)
- (34) Ho, L. C., Filippenko, A. C., & Sargent, W. L. W. 1997, ApJS, 112, 315
- (35)
- (36) Ho, L.C. 2002, ApJ, 564, 120
- (37)
- (38) Kenyon, S.J. 1986, The Symbiotic Stars, CUP
- (39)
- (40) Karachentsev, I.D., et al. 2002, A&A, 385, 21
- (41)
- (42) Kong, A.K.H., Garcia, M.R., Primini, F.A., & Murray, S.S. 2002, ApJ, 580, L125
- (43)
- (44) Kong, A. K. H., Sjouwerman, L. O., Williams, B. F., Garcia, M. R., & Dickel, J. R. 2003, ApJ, 590, L21
- (45)
- (46) Kong, A.K.H., & Di Stefano, R. 2003, ApJ, 590, L13
- (47)
- (48) Kong, A.K.H., & Di Stefano, R. 2004, ATel, 222
- (49)
- (50) Long, K.S., Helfand, D.J., & Grabelsky, D.A. 1981, ApJ, 248, 925
- (51)
- (52) Matonick, D.M., & Fesen, R.A. 1997, ApJS, 112, 49
- (53)
- (54) Moody, J. W., Roming, P.W.A., Joner, M.D., Hintz, E.G., Geisler, D., Durrell, P.R., Scowen, P.A., Jee, R.O. 1995, AJ, 110, 2088
- (55)
- (56) Mukai, K., Pence, W.D., Snowden S.L., & Kuntz, K.D. 2002, ApJ, 582, 184
- (57)
- (58) Nedialkov, P., Orio, M., Birkle, K., Conselice, C., Della Valle, M., Greiner, J., Magnier, E., & Tikhonov, N. A. 2002, A&A, 389, 439
- (59)
- (60) Patterson, J., Thorstensen, J. R., Fried, R., Skillman, D. R., Cook, L. M., & Jensen, L. 2001, PASP, 113, 72
- (61)
- (62) Pence, W. D., Snowden, S. L., Mukai, K., & Kuntz, K. D. 2001, ApJ, 561, 189
- (63)
- (64) Rappaport, S., Chiang, E., Kallman, T., & Malina, R. 1994, ApJ, 431, 237
- (65)
- (66) Rappaport, S., Di Stefano, R., Smith, J.D. 1994, ApJ, 426, 692
- (67)
- (68) Sarazin, Craig L., Irwin, Jimmy A., Bregman, Joel N, 2001, ApJ, 556, 533
- (69)
- (70) Scowen P.A., Dufour R.J., & Hester J.J. 1992, AJ, 104, 92
- (71)
- (72) Soria, R. & Wu, K. 2002, A&A, 384, 99
- (73)
- (74) Soria, R. & Wu, K. 2003, A&A, 410, 53
- (75)
- (76) Swartz, D.A., Ghosh, K.K., Suleimanov, V., Tennant, A.F., & Wu, K. 2002, ApJ, 574, 382
- (77)
- (78) Terashima, Y. & Wilson, A.S. 2003, ApJ, 601, 735
- (79)
- (80) Thatte, N., Tecza, M., & Genzel, R. 2000, A&A, 364, L47
- (81)
- (82) Tonry, J.L., Dressler, A., Blakeslee, J.P., Ajhar, E.A., Fletcher, A.B., Luppino, G.A., Metzger, M.R., Moore, C.B. 2001, ApJ, 546, 681
- (83)
- (84) Tully, R.B. 1988, in Nearby Galaxies Catalog, Cambridge and New York, Cambridge University Press,
- (85)
- (86) Vanlandingham, K. M., Starrfield, S., Shore, S. N., & Sonneborn, G. 1999, MNRAS, 308, 577
- (87)
| Name | Type | Distance | Inclination | Chandra | aaRatio of number of VSSs to total number of X-ray sources. | |||||
|---|---|---|---|---|---|---|---|---|---|---|
| (Mpc) | (arcmin) | (cm-2) | exposure (ks) | |||||||
| M101 | Sc | 5.4, 6.71 | 23.8 | -20.45 | 1.2 | 94.4 | 10.05 | 2 | 53/118 | |
| M83 | Sc | 4.7, 4.573 | 11.5 | -20.31 | 3.8 | 49.5 | 10.01 | 0.1 4 | 54/127 | |
| M51 | ScbbSeyfert 2 galaxy. | 7.7, 8.45 | 13.6 | -20.75 | 1.6 | 14.9 | 9.46 | 0.1 6 | 23/72 | |
| NGC 4697 | E | 23.3, 15.97, 11.78 | 7.1 | -21.67 | ccFor elliptical galaxies the inclination is given by + acos , where d/D is the axial ratio of minor to major diameter (Tully 1988). This inclination angle is generally unrelated to the value of . | 2.1 | 39.3 | 0.53 | 1.29 | 19/91 |
Note. — All data are from Nearby Galaxies Catalogue (Tully 1988) unless specified.
References. — 1: Freedman et al. 2001; 2: Moody et al. 1995; 3: Karachentsev et al. 2002; 4: Thatte et al. 2000; 5: Feldmeier et al. 1997; 6: Hagiwara et al. 2001; 7: Faber et al. 1989; 8: Tonry et al. 2001; 9: Ho 2002
| Object | R.A. | Dec. | Soft | Medium | Hard | HR1aa(M-S)/(M+S); value in parentheses is the maximum of HR1. | HR2bb(H-S)/(H+S); value in parentheses is the maximum of HR2. | NoteccEntries indicate that an object of the type listed is within of a VSS; SNR: SNR catalog (94 objects in total) from Matonick & Fesen (1997); HII: HII region catalog (248 objects in total) Scowen et al. (1992); PN: PN catalog (65 objects in total) from Feldmeier et al. (1997) | |||
|---|---|---|---|---|---|---|---|---|---|---|---|
| (h:m:s) | Counts | S/N | Counts | S/N | Counts | S/N | |||||
| SSS-HR | |||||||||||
| M101-15(10) | 14:02:59.4 | +54:20:42 | 31.3 | 5.3 | 1.3 | 0.6 | 0.0 | 0.0 | -0.9(-0.8) | -1.0(-0.9) | |
| M101-18(13*) | 14:03:01.1 | +54:23:41 | 169.6 | 12.9 | 0.0 | 0.0 | 0.1 | 0.1 | -1.0(-1.0) | -1.0(-1.0) | |
| M101-21(16*) | 14:03:02.5 | +54:24:16 | 74.2 | 8.3 | 0.0 | 0.0 | 0.0 | 0.0 | -1.0(-0.9) | -1.0(-1.0) | |
| M101-34(27) | 14:03:07.9 | +54:21:23 | 35.7 | 5.8 | 1.8 | 0.8 | 0.0 | 0.0 | -0.9(-0.8) | -1.0(-0.9) | |
| M101-37(30*) | 14:03:08.5 | +54:20:57 | 29.3 | 5.0 | 1.0 | 0.4 | 0.4 | 0.0 | -0.9(-0.8) | -1.0(-0.9) | |
| M101-38(31) | 14:03:08.6 | +54:23:36 | 20.7 | 4.1 | 0.0 | 0.0 | 0.0 | 0.0 | -1.0(-0.9) | -1.0(-1.0) | |
| M101-43(36) | 14:03:10.6 | +54:21:26 | 18.2 | 3.8 | 0.0 | 0.0 | 0.0 | 0.0 | -1.0(-1.0) | -1.0(-0.9) | |
| M101-50(43) | 14:03:13.2 | +54:21:57 | 31.3 | 5.3 | 0.0 | 0.0 | 0.0 | 0.1 | -1.0(-1.0) | -1.0(-0.8) | SNR |
| M101-51(45*) | 14:03:13.6 | +54:20:09 | 219.1 | 14.6 | 0.3 | 0.1 | 0.0 | 0.0 | -1.0(-1.0) | -1.0(-1.0) | HII |
| M101-55(48) | 14:03:13.9 | +54:18:11 | 34.3 | 5.6 | 1.4 | 0.6 | 0.0 | 0.0 | -0.9(-0.8) | -1.0(-0.9) | |
| M101-78(73) | 14:03:22.6 | +54:20:38 | 34.3 | 5.4 | 1.5 | 0.6 | 1.0 | 0.4 | -0.9(-0.8) | -1.0(-0.8) | HII |
| M101-80(75) | 14:03:24.0 | +54:23:37 | 68.7 | 8.0 | 0.8 | 0.3 | 0.0 | 0.0 | -1.0(-0.9) | -1.0(-0.9) | HII |
| M101-97(92) | 14:03:29.8 | +54:20:58 | 71.9 | 7.9 | 0.0 | 0.0 | 0.0 | 0.0 | -1.0(-0.9) | -1.0(-0.9) | |
| M101-101(96*) | 14:03:31.9 | +54:23:23 | 30.9 | 5.1 | 0.0 | 0.0 | 0.0 | 0.0 | -1.0(-0.9) | -1.0(-0.9) | |
| M101-102(98) | 14:03:32.3 | +54:21:03 | 8512.0 | 92.2 | 658.4 | 25.6 | 68.0 | 8.0 | -0.9(-0.9) | -1.0(-1.0) | |
| M101-104(99*) | 14:03:33.3 | +54:18:00 | 227.8 | 14.6 | 0.3 | 0.1 | 1.1 | 0.3 | -1.0(-1.0) | -1.0(-1.0) | HII |
| SSS- | |||||||||||
| M101-5 | 14:02:51.7 | +54:19:33 | 13.0 | 3.2 | 1.7 | 0.8 | 0.0 | 0.0 | -0.8(-0.6) | -1.0(-0.7) | SNR |
| M101-11(8*) | 14:02:57.0 | +54:19:48 | 34.2 | 5.6 | 0.0 | 0.0 | 2.5 | 1.0 | -1.0(-0.9) | -0.9(-0.8) | |
| M101-16(11) | 14:03:00.5 | +54:20:02 | 31.9 | 5.2 | 0.0 | 0.0 | 4.2 | 1.5 | -1.0(-0.9) | -0.8(-0.7) | SNR, HII |
| M101-17(12) | 14:03:00.8 | +54:20:17 | 17.1 | 3.5 | 0.0 | 0.0 | 2.8 | 1.1 | -1.0(-0.8) | -0.7(-0.6) | |
| M101-24 | 14:03:04.6 | +54:20:37 | 15.3 | 3.5 | 0.0 | 0.0 | 0.0 | 0.0 | -1.0(-0.8) | -1.0(-0.8) | |
| M101-27(20) | 14:03:05.2 | +54:23:11 | 19.0 | 4.0 | 1.7 | 0.7 | 0.8 | 0.3 | -0.8(-0.7) | -0.9(-0.8) | |
| M101-49(42) | 14:03:12.8 | +54:19:01 | 18.6 | 4.0 | 0.5 | 0.2 | 2.6 | 1.0 | -1.0(-0.8) | -0.8(-0.6) | SNR, HII |
| M101-57(52) | 14:03:14.6 | +54:21:52 | 17.9 | 3.8 | 1.9 | 0.8 | 0.0 | 0.0 | -0.8(-0.7) | -1.0(-0.8) | SNR |
| M101-60(55) | 14:03:15.0 | +54:20:18 | 18.0 | 3.7 | 0.0 | 0.0 | 0.5 | 0.2 | -1.0(-0.8) | -1.0(-0.8) | |
| M101-72(68) | 14:03:21.1 | +54:19:08 | 21.2 | 4.2 | 1.7 | 0.7 | 0.0 | 0.0 | -0.9(-0.7) | -1.0(-0.8) | |
| M101-76(72*) | 14:03:21.7 | +54:20:24 | 19.4 | 3.7 | 0.6 | 0.2 | 0.0 | 0.0 | -0.9(-0.8) | -1.0(-0.8) | HII |
| M101-85(80*) | 14:03:25.3 | +54:21:13 | 27.3 | 4.7 | 0.0 | 0.0 | 3.6 | 1.3 | -1.0(-0.9) | -0.8(-0.7) | HII |
| M101-86(81) | 14:03:25.8 | +54:21:25 | 18.6 | 3.6 | 0.7 | 0.3 | 0.0 | 0.0 | -1.0(-0.8) | -1.0(-1.0) | SNR, HII |
| M101-88(84) | 14:03:26.6 | +54:20:43 | 45.8 | 6.1 | 4.3 | 1.7 | 5.3 | 1.9 | -0.8(-0.8) | -0.8(-0.7) | SNR, HII |
| M101-92 | 14:03:27.9 | +54:18:45 | 27.1 | 4.2 | 3.5 | 1.3 | 3.5 | 1.1 | -0.8 (-0.7) | -0.8 (-0.7) | HII |
| M101-95(90) | 14:03:28.8 | +54:20:59 | 24.6 | 4.4 | 3.1 | 1.3 | 0.3 | 0.1 | -0.8(-0.7) | -1.0(-0.8) | |
| QSS-NOH | |||||||||||
| M101-77 | 14:03:21.7 | +54:22:32 | 9.4 | 2.5 | 0.7 | 0.3 | 0.5 | 0.2 | -0.9(-0.6) | -0.9(-0.6) | PN |
| M101-93(88) | 14:03:28.6 | +54:22:02 | 12.8 | 3.0 | 1.1 | 0.4 | 1.3 | 0.5 | -0.9(-0.7) | -0.8(-0.6) | |
| M101-106(101*) | 14:03:33.9 | +54:20:11 | 23.1 | 3.7 | 3.9 | 1.4 | 0.0 | 0.0 | -0.7(-0.6) | -1.0(-0.8) | SNR, HII |
| QSS-SNOH | |||||||||||
| M101-2(1) | 14:02:49.1 | +54:18:42 | 15.4 | 3.1 | 8.7 | 2.7 | 0.0 | 0.0 | -0.3(-0.3) | -1.0(-0.8) | HII |
| M101-25(18) | 14:03:04.7 | +54:19:25 | 16.0 | 3.3 | 4.3 | 1.7 | 1.4 | 0.5 | -0.6(-0.5) | -0.8(-0.7) | HII |
| M101-61(56) | 14:03:15.5 | +54:17:04 | 53.7 | 6.4 | 9.8 | 2.7 | 0.0 | 0.0 | -0.7(-0.7) | -1.0(-0.9) | HII |
| QSS-HR1 | |||||||||||
| M101-3(2) | 14:02:49.6 | +54:19:59 | 19.4 | 4.1 | 6.4 | 2.3 | 1.8 | 0.7 | -0.5(-0.5) | -0.8(-0.7) | |
| M101-96(91) | 14:03:28.9 | +54:21:49 | 13.3 | 3.1 | 4.7 | 1.8 | 1.9 | 0.7 | -0.5(-0.4) | -0.8(-0.6) | HII |
| QSS- | |||||||||||
| M101-6(4) | 14:02:52.1 | +54:19:47 | 12.5 | 2.9 | 0.4 | 0.2 | 2.3 | 0.9 | -0.9 (-0.7) | -0.7 (-0.6) | |
| M101-12 | 14:02:57.1 | +54:22:33 | 9.6 | 2.5 | 0.0 | 0.0 2.0 | 0.8 | -1.0 (-0.7) | -0.7 (-0.5) | ||
| M101-48(41) | 14:03:12.7 | +54:17:44 | 11.6 | 2.7 | 7.1 | 2.4 | 2.4 | 0.9 | -0.2 (-0.2) | -0.7 (-0.5) | SNR |
| M101-58(53) | 14:03:14.8 | +54:21:10 | 13.6 | 2.9 | 5.2 | 1.9 | 2.0 | 0.9 | -0.5(-0.4) | -0.8(-0.6) | |
| M101-59(54) | 14:03:14.8 | +54:21:23 | 11.2 | 2.9 | 4.9 | 2.0 | 1.7 | 0.7 | -0.4(-0.3) | -0.7(-0.6) | |
| M101-87(82) | 14:03:26.2 | +54:19:51 | 11.6 | 2.9 | 0.5 | 0.2 | 1.5 | 0.6 | -0.9 (-0.7) | -0.8 (-0.6) | HII |
| QSS- | |||||||||||
| M101-53(45*) | 14:03:13.6 | +54:19:09 | 76.3 | 8.4 | 36.3 | 5.9 | 3.9 | 1.4 | -0.4(-0.3) | -0.9(-0.9) | HII |
| QSS-FNOH | |||||||||||
| M101-1 | 14:02:48.8 | +54:20:34 | 11.9 | 3.0 | 3.0 | 1.3 | 0.0 | 0.0 | -0.6(-0.5) | -1.0(-0.8) | |
| M101-8(6) | 14:02:53.2 | +54:18:55 | 5.7 | 1.7 | 9.9 | 3.0 | 1.2 | 0.5 | 0.3 (0.2) | -0.7 (-0.4) | |
| M101-19(14) | 14:03:01.3 | +54:21:33 | 10.2 | 2.8 | 5.7 | 2.2 | 0.9 | 0.4 | -0.3 (-0.3) | -0.8 (-0.6) | |
| M101-112 | 14:03:39.0 | +54:16:56 | 17.3 | 0.6 | 19.6 | 3.7 | 0.0 | 0.0 | 0.1(-0.3) | -1.0(-0.7) | |
| QSS-MNOH | |||||||||||
| M101-114(107) | 14:03:41.3 | +54:19:04 | 280.1 | 14.5 | 64.4 | 7.2 | 1.4 | 0.3 | -0.6(-0.6) | -1.0(-1.0) | HII |
| M101-116(109) | 14:03:51.9 | +54:21:49 | 99.8 | 8.7 | 15.3 | 3.2 | 0.0 | 0.0 | -0.7(-0.7) | -1.0(-0.9) | |
Note. — The object ID in parentheses is from Pence et al. (2001); SSSs selected by Pence et al. (2001) are noted by “*”.
| Object | R.A. | Dec. | Soft | Medium | Hard | HR1aa(M-S)/(M+S); value in parentheses is the maximum of HR1. | HR2bb(H-S)/(H+S); value in parentheses is the maximum of HR2. | |||
|---|---|---|---|---|---|---|---|---|---|---|
| (h:m:s) | Counts | S/N | Counts | S/N | Counts | S/N | ||||
| SSS-HR | ||||||||||
| M83-20 | 13:36:53.9 | -29:48:48 | 43.0 | 5.7 | 2.7 | 1.1 | 2.6 | 0.9 | -0.9(-0.8) | -0.9(-0.8) |
| M83-42 | 13:36:59.1 | -29:53:36 | 30.5 | 5.3 | 0.0 | 0.0 | 0.0 | 0.0 | -1.0(-0.9) | -1.0(-0.9) |
| M83-50 | 13:37:00.4 | -29:50:54 | 105.1 | 10.0 | 0.8 | 0.3 | 0.0 | 0.0 | -1.0(-0.9) | -1.0(-1.0) |
| M83-54 | 13:37:01.1 | -29:54:49 | 132.6 | 11.4 | 1.8 | 0.8 | 0.7 | 0.3 | -1.0(-1.0) | -1.0(-1.0) |
| M83-79 | 13:37:06.1 | -29:52:32 | 108.6 | 10.3 | 1.8 | 0.9 | 0.0 | 0.0 | -1.0(-0.9) | -1.0(-1.0) |
| M83-81 | 13:37:06.5 | -29:54:16 | 15.7 | 3.7 | 0.0 | 0.0 | 0.0 | 0.0 | -1.0(-0.8) | -1.0(-0.8) |
| M83-88 | 13:37:07.4 | -29:51:33 | 17.5 | 3.8 | 0.0 | 0.0 | 0.0 | 0.0 | -1.0(-0.8) | -1.0(-0.8) |
| M83-98 | 13:37:12.8 | -29:50:12 | 35.9 | 5.8 | 2.1 | 1.0 | 1.6 | 0.7 | -0.9(-0.8) | -0.9(-0.8) |
| M83-111 | 13:36:59.5 | -29:52:03 | 78.2 | 8.4 | 5.9 | 2.2 | 2.0 | 0.9 | -0.9(-0.8) | -1.0(-0.9) |
| M83-128 | 13:36:57.7 | -29:53:53 | 29.6 | 5.2 | 1.6 | 0.7 | 0.0 | 0.0 | -0.9(-0.8) | -1.0(-0.8) |
| SSS- | ||||||||||
| M83-1 | 13:36:40.8 | -29:51:18 | 25.2 | 4.7 | 2.9 | 1.3 | 1.6 | 0.6 | -0.8(-0.7) | -0.9(-0.8) |
| M83-7 | 13:36:48.2 | -29:52:44 | 13.1 | 3.3 | 1.9 | 0.9 | 1.6 | 0.7 | -0.8(-0.6) | -0.8(-0.6) |
| M83-10 | 13:36:49.8 | -29:52:17 | 29.3 | 5.0 | 2.7 | 1.2 | 2.4 | 1.0 | -0.8(-0.8) | -0.8(-0.8) |
| M83-19 | 13:36:53.6 | -29:56:00 | 24.7 | 4.8 | 2.3 | 1.1 | 2.8 | 1.2 | -0.8(-0.7) | -0.8(-0.7) |
| M83-25 | 13:36:55.0 | -29:52:39 | 27.5 | 5.0 | 3.3 | 1.8 | 0.0 | 0.0 | -0.8(-0.7) | -1.0(-0.9) |
| M83-41 | 13:36:58.7 | -29:51:00 | 15.2 | 3.5 | 0.4 | 0.1 | 0.0 | 0.0 | -1.0(-0.7) | -1.0(-0.8) |
| M83-46 | 13:36:59.8 | -29:55:25 | 28.0 | 5.1 | 0.8 | 0.3 | 2.1 | 0.9 | -1.0(-0.8) | -0.9(-0.8) |
| M83-48 | 13:37:00.0 | -29:54:17 | 11.5 | 3.0 | 0.9 | 0.4 | 0.0 | 0.0 | -0.9(-0.6) | -1.0(-0.8) |
| M83-53 | 13:37:01.0 | -29:50:56 | 18.4 | 3.7 | 1.2 | 0.5 | 0.0 | 0.0 | -0.9(-0.7) | -1.0(-0.8) |
| M83-60 | 13:37:01.7 | -29:51:13 | 22.7 | 4.2 | 3.3 | 1.4 | 0.3 | 0.1 | -0.7(-0.7) | -1.0(-0.8) |
| M83-73 | 13:37:04.5 | -29:51:08 | 14.0 | 3.1 | 0.0 | 0.0 | 0.0 | 0.0 | -1.0(-0.8) | -1.0(-0.8) |
| M83-80 | 13:37:06.1 | -29:54:44 | 39.6 | 6.2 | 5.0 | 2.0 | 0.0 | 0.0 | -0.8(-0.7) | -1.0(-0.9) |
| M83-91 | 13:37:08.3 | -29:51:26 | 20.8 | 4.1 | 0.2 | 0.1 | 0.8 | 0.3 | -1.0(-0.8) | -0.9(-0.8) |
| M83-92 | 13:37:08.5 | -29:51:35 | 12.8 | 3.0 | 0.0 | 0.0 | 0.0 | 0.0 | -1.0(-1.0) | -1.0(-1.0) |
| M83-93 | 13:37:11.8 | -29:52:15 | 45.0 | 6.5 | 4.6 | 1.8 | 1.3 | 0.6 | -0.8(-0.7) | -0.9(-0.9) |
| M83-94 | 13:37:12.1 | -29:50:56 | 14.2 | 3.4 | 0.6 | 0.2 | 0.6 | 1.0 | -0.9(-0.7) | -0.7(-0.6) |
| M83-97 | 13:37:12.7 | -29:52:00 | 14.8 | 3.5 | 0.0 | 0.0 | 0.6 | 0.3 | -1.0(-0.8) | -0.9(-0.7) |
| M83-127 | 13:37:01.6 | -29:52:01 | 32.9 | 5.2 | 3.1 | 1.3 | 1.0 | 0.4 | -0.8(-0.8) | -0.9(-0.9) |
| QSS-NOH | ||||||||||
| M83-12 | 13:36:50.9 | -29:52:26 | 12.0 | 2.8 | 3.7 | 1.6 | 0.0 | 0.0 | -0.5(-0.5) | -1.0(-0.8) |
| M83-22 | 13:36:54.1 | -29:52:09 | 10.2 | 2.9 | 2.9 | 1.3 | 0.0 | 0.0 | -0.6(-0.5) | -1.0(-0.7) |
| M83-43 | 13:36:59.3 | -29:55:08 | 9.7 | 2.7 | 2.2 | 1.0 | 0.8 | 0.3 | -0.6(-0.5) | -0.9(-0.6) |
| M83-58 | 13:37:01.6 | -29:54:10 | 10.1 | 2.8 | 2.9 | 1.3 | 0.0 | 0.0 | -0.6(-0.5) | -1.0(-0.7) |
| M83-85 | 13:37:07.0 | -29:53:20 | 6.6 | 2.2 | 1.0 | 0.4 | 0.0 | 0.0 | -0.8(-0.5) | -1.0(-0.7) |
| M83-86 | 13:37:07.1 | -29:52:02 | 15.8 | 3.7 | 3.2 | 1.4 | 0.0 | 0.0 | -0.7(-0.6) | -1.0(-0.8) |
| QSS-SNOH | ||||||||||
| M83-15 | 13:36:52.8 | -29:52:31 | 20.0 | 3.9 | 7.5 | 2.5 | 0.0 | 0.0 | -0.5(-0.4) | -1.0(-0.8) |
| M83-24 | 13:36:55.0 | -29:53:04 | 21.2 | 4.0 | 7.8 | 2.6 | 0.0 | 0.0 | -0.5(-0.4) | -1.0(-0.9) |
| QSS-HR1 | ||||||||||
| M83-11 | 13:36:50.8 | -29:52:40 | 20.3 | 3.8 | 7.5 | 2.5 | 1.7 | 0.7 | -0.5(-0.4) | -0.9(-0.7) |
| M83-13 | 13:36:51.1 | -29:50:43 | 25.0 | 4.2 | 9.6 | 2.9 | 1.9 | 0.8 | -0.5(-0.4) | -0.9(-0.8) |
| M83-17 | 13:36:53.1 | -29:53:25 | 33.8 | 5.3 | 5.1 | 1.9 | 1.8 | 0.8 | -0.7(-0.7) | -0.9(-0.8) |
| M83-18 | 13:36:53.2 | -29:52:42 | 27.9 | 4.5 | 11.8 | 3.3 | 1.4 | 0.6 | -0.4(-0.4) | -0.9(-0.8) |
| M83-64 | 13:37:02.4 | -29:51:26 | 64.8 | 7.6 | 10.6 | 3.1 | 1.4 | 0.6 | -0.7(-0.7) | -1.0(-0.9) |
| M83-106 | 13:37:17.4 | -29:51:54 | 13.8 | 3.5 | 5.0 | 2.0 | 1.7 | 0.7 | -0.5(-0.4) | -0.8(-0.6) |
| M83-114 | 13:37:00.2 | -29:52:06 | 80.1 | 8.9 | 10.3 | 3.1 | 2.0 | 0.9 | -0.8(-0.7) | -0.9(-0.8) |
| M83-120 | 13:37:00.6 | -29:52:04 | 356.5 | 18.8 | 61.1 | 7.8 | 1.6 | 0.7 | -0.7(-0.7) | -1.0(-1.0) |
| M83-89 | 13:37:07.5 | -29:48:59 | 11.5 | 2.2 | 2.0 | 0.8 | 1.4 | 0.6 | -0.7(-0.6) | -0.8(-0.6) |
| M83-90 | 13:37:08.2 | -29:49:16 | 10.3 | 2.3 | 2.0 | 0.8 | 1.5 | 0.6 | -0.7(-0.5) | -0.8(-0.6) |
| QSS- | ||||||||||
| M83-105 | 13:37:17.2 | -29:51:53 | 66.1 | 8.1 | 22.5 | 4.7 | 3.9 | 1.7 | -0.5(-0.5) | -0.9(-0.8) |
| M83-116 | 13:37:00.4 | -29:51:59 | 682.2 | 26.0 | 140.1 | 11.8 | 16.4 | 4.0 | -0.7(-0.7) | -1.0(-0.9) |
| M83-117 | 13:37:00.5 | -29:51:56 | 780.3 | 27.9 | 207.9 | 14.4 | 24.7 | 4.9 | -0.6(-0.6) | -0.9(-0.9) |
| M83-119 | 13:37:00.6 | -29:51:59 | 526.6 | 22.9 | 110.4 | 10.5 | 10.0 | 3.0 | -0.7(-0.6) | -1.0(-1.0) |
| QSS-FNOH | ||||||||||
| M83-66 | 13:37:03.0 | -29:49:45 | 11.5 | 2.5 | 4.0 | 1.6 | 0.0 | 0.0 | -0.5(-0.4) | -1.0(-0.8) |
| QSS-MNOH | ||||||||||
| M83-35 | 13:36:57.8 | -29:53:03 | 68.6 | 8.1 | 13.1 | 3.5 | 0.0 | 0.0 | -0.7(-0.6) | -1.0(-0.9) |
| M83-78 | 13:37:06.0 | -29:55:14 | 56.7 | 7.4 | 13.4 | 3.6 | 0.6 | 0.2 | -0.6(-0.6) | -1.0(-0.9) |
| M83-115 | 13:37:00.3 | -29:52:05 | 86.4 | 9.2 | 12.4 | 3.5 | 0.9 | 0.4 | -0.8(-0.7) | -1.0(-0.9) |
| Object | R.A. | Dec. | Soft | Medium | Hard | HR1aa(M-S)/(M+S); value in parentheses is the maximum of HR1. | HR2bb(H-S)/(H+S); value in parentheses is the maximum of HR2. | |||
|---|---|---|---|---|---|---|---|---|---|---|
| (h:m:s) | Counts | S/N | Counts | S/N | Counts | S/N | ||||
| SSS-HR | ||||||||||
| M51-12 | 13:29:43.3 | +47:11:34 | 272.7 | 16.5 | 5.2 | 2.1 | 1.0 | 0.4 | -1.0(-0.9) | -1.0(-1.0) |
| M51-42 | 13:29:55.4 | +47:11:43 | 14.7 | 3.6 | 0.0 | 0.0 | 0.0 | 0.0 | -1.0(-0.8) | -1.0(-0.8) |
| M51-58 | 13:30:02.3 | +47:12:38 | 20.4 | 4.5 | 0.0 | 0.0 | 0.0 | 0.0 | -1.0(-0.9) | -1.0(-0.9) |
| SSS- | ||||||||||
| M51-14 | 13:29:44.0 | +47:11:56 | 7.9 | 2.6 | 0.0 | 0.0 | 0.9 | 0.4 | -1.0(-0.7) | -0.8(-0.5) |
| M51-17 | 13:29:45.9 | +47:10:55 | 11.9 | 3.3 | 0.0 | 0.0 | 0.0 | 0.0 | -1.0(-0.8) | -1.0(-0.8) |
| M51-22 | 13:29:50.1 | +47:14:20 | 8.7 | 2.8 | 0.0 | 0.0 | 0.0 | 0.0 | -1.0(-0.7) | -1.0(-0.7) |
| M51-27 | 13:29:52.0 | +47:12:13 | 9.9 | 2.9 | 0.0 | 0.0 | 1.0 | 0.4 | -1.0(-0.7) | -0.8(-0.6) |
| M51-41 | 13:29:55.1 | +47:10:42 | 8.1 | 2.6 | 0.0 | 0.0 | 0.8 | 0.4 | -1.0(-0.7) | -0.8(-0.5) |
| M51-43 | 13:29:55.4 | +47:14:02 | 10.6 | 3.0 | 0.0 | 0.0 | 0.9 | 0.4 | -1.0(-0.8) | -0.8(-0.6) |
| M51-45 | 13:29:56.0 | +47:13:51 | 7.7 | 2.4 | 1.0 | 0.4 | 0.7 | 0.3 | -0.8(-0.5) | -0.8(-0.5) |
| M51-59 | 13:30:04.1 | +47:10:03 | 10.2 | 3.1 | 2.1 | 1.0 | 0.8 | 0.3 | -0.7(-0.5) | -0.9(-0.6) |
| M51-62 | 13:30:05.7 | +47:10:31 | 8.2 | 2.7 | 0.9 | 0.4 | 0.0 | 0.0 | -0.8(-0.5) | -1.0(-0.7) |
| M51-64 | 13:30:06.0 | +47:14:04 | 9.8 | 3.0 | 1.9 | 0.9 | 0.5 | 0.2 | -0.7(-0.5) | -0.9(-0.6) |
| QSS-NOH | ||||||||||
| M51-23 | 13:29:50.3 | +47:13:22 | 4.7 | 1.9 | 1.0 | 0.4 | 0.0 | 0.0 | -0.6(-0.4) | -1.0(-0.6) |
| M51-70 | 13:30:20.9 | +47:13:53 | 5.2 | 1.9 | 3.4 | 1.4 | 0.9 | 0.3 | -0.2(-0.2) | -0.7(-0.4) |
| QSS-SNOH | ||||||||||
| M51-6 | 13:29:38.6 | +47:13:36 | 20.7 | 4.5 | 5.3 | 2.1 | 1.1 | 0.5 | -0.6(-0.5) | -0.9(-0.8) |
| M51-37 | 13:29:54.3 | +47:11:21 | 10.9 | 3.0 | 2.1 | 1.0 | 0.0 | 0.0 | -0.7(-0.5) | -1.0(-0.8) |
| M51-44 | 13:29:55.8 | +47:11:44 | 12.2 | 3.2 | 3.1 | 1.4 | 0.0 | 0.0 | -0.6(-0.5) | -1.0(-0.8) |
| QSS-HR1 | ||||||||||
| M51-60 | 13:30:04.5 | +47:10:31 | 11.2 | 3.3 | 6.1 | 2.3 | 2.0 | 0.9 | -0.3(-0.2) | -0.7(-0.6) |
| QSS- | ||||||||||
| M51-10 | 13:29:39.9 | +47:12:36 | 201.9 | 14.2 | 70.4 | 8.4 | 9.2 | 2.9 | -0.5(-0.5) | -0.9(-0.9) |
| QSS-FNOH | ||||||||||
| M51-5 | 13:29:38.1 | +47:16:12 | 51.7 | 7.1 | 10.8 | 3.2 | 0.0 | 0.0 | -0.7(-0.6) | -1.0(-0.9) |
| M51-32 | 13:29:53.5 | +47:11:26 | 9.8 | 2.6 | 3.1 | 1.4 | 0.9 | 0.4 | -0.5(-0.4) | -0.8(-0.6) |
| M51-57 | 13:30:02.1 | +47:12:38 | 9.1 | 2.9 | 4.1 | 1.8 | 0.0 | 0.0 | -0.4(-0.3) | -1.0(-0.7) |
| Object | R.A. | Dec. | Soft | Medium | Hard | HR1aa(M-S)/(M+S); value in parentheses is the maximum of HR1. | HR2bb(H-S)/(H+S); value in parentheses is the maximum of HR2. | |||
|---|---|---|---|---|---|---|---|---|---|---|
| (h:m:s) | Counts | S/N | Counts | S/N | Counts | S/N | ||||
| SSS-HR | ||||||||||
| NGC4697-16 | 12:48:37.1 | -05:47:58 | 63.0 | 7.9 | 0.0 | 0.0 | 0.0 | 0.0 | -1.0(-1.0) | -1.0(-0.9) |
| NGC4697-19 | 12:48:34.5 | -05:47:49 | 73.7 | 8.5 | 0.9 | 0.4 | 0.0 | 0.0 | -1.0(-0.9) | -1.0(-1.0) |
| NGC4697-52 | 12:48:41.2 | -05:48:19 | 58.6 | 7.5 | 0.0 | 0.0 | 0.7 | 0.3 | -1.0(-0.9) | -1.0(-0.9) |
| SSS-3 | ||||||||||
| NGC4697-91 | 12:48:38.9 | -05:47:31 | 12.7 | 3.5 | 0.0 | 0.0 | 0.0 | 0.0 | -1.0(-0.8) | -1.0(-0.8) |
| QSS-NOH | ||||||||||
| NGC4697-73 | 12:48:24.1 | -05:48:16 | 17.3 | 4.0 | 3.6 | 1.6 | 0.2 | 0.0 | -0.7(-0.6) | -1.0(-0.8) |
| NGC4697-86 | 12:48:19.6 | -05:47:33 | 8.2 | 2.6 | 3.1 | 1.4 | 0.4 | 0.2 | -0.5(-0.4) | -0.9(-0.6) |
| QSS-SNOH | ||||||||||
| NGC4697-2 | 12:48:36.0 | -05:48:03 | 15.7 | 3.9 | 8.4 | 2.8 | 0.9 | 0.4 | -0.3(-0.3) | -0.9(-0.7) |
| NGC4697-9 | 12:48:35.4 | -05:47:54 | 40.2 | 6.2 | 7.0 | 2.5 | 0.0 | 0.0 | -0.7(-0.7) | -1.0(-0.9) |
| NGC4697-10 | 12:48:36.5 | -05:48:01 | 11.5 | 3.3 | 6.3 | 2.4 | 0.0 | 0.0 | -0.3(-0.3) | -1.0(-0.8) |
| NGC4697-17 | 12:48:37.0 | -05:47:53 | 13.6 | 3.5 | 6.2 | 2.3 | 0.5 | 0.2 | -0.4(-0.3) | -0.9(-0.7) |
| QSS-HR1 | ||||||||||
| NGC4697-13 | 12:48:36.2 | -05:48:15 | 12.5 | 3.1 | 4.1 | 1.7 | 1.3 | 0.5 | -0.5(-0.4) | -0.8(-0.6) |
| NGC4697-29 | 12:48:33.3 | -05:48:02 | 15.3 | 3.7 | 6.8 | 2.4 | 1.8 | 0.8 | -0.4(-0.4) | -0.8(-0.7) |
| NGC4697-49 | 12:48:31.0 | -05:48:28 | 11.8 | 3.1 | 7.0 | 2.5 | 2.3 | 1.0 | -0.3(-0.2) | -0.7(-0.5) |
| NGC4697-50 | 12:48:40.8 | -05:48:22 | 13.1 | 3.3 | 2.8 | 1.2 | 1.4 | 0.6 | -0.7(-0.6) | -0.8(-0.6) |
| NGC4697-59 | 12:48:32.9 | -05:46:14 | 11.4 | 3.3 | 7.9 | 2.7 | 1.8 | 0.8 | -0.2(-0.2) | -0.7(-0.6) |
| NGC4697-66 | 12:48:41.4 | -05:46:02 | 16.4 | 3.9 | 12.1 | 3.4 | 2.3 | 1.0 | -0.2(-0.1) | -0.8(-0.6) |
| NGC4697-74 | 12:48:28.7 | -05:50:25 | 23.4 | 4.4 | 9.1 | 2.9 | 9.1 | 0.9 | -0.4(-0.4) | -0.8(-0.7) |
| QSS-FNOH | ||||||||||
| NGC4697-68 | 12:48:25.5 | -05:48:08 | 7.6 | 2.5 | 6.7 | 2.4 | 0.5 | 0.2 | 0.0(0.0) | -0.9(-0.6) |
| QSS- | ||||||||||
| NGC4697-64 | 12:48:34.4 | -05:50:14 | 51.2 | 6.9 | 23.6 | 4.8 | 3.2 | 1.2 | -0.4(-0.4) | -0.9(-0.8) |
| ID | kTaaBlackbody temperature. | kTRSbbRaymond-Smith temperature. | ccPower-law photon index. | /dof | Flux ddUnabsorbed flux ( erg cm-2 s-1) in 0.3–7 keV. | eeLuminosity ( erg s-1) in 0.3–7 keV. The upper and lower limits quoted here are based on the farthest and nearest distances, respectively, shown in Table 2. | |
|---|---|---|---|---|---|---|---|
| (cm-2) | (eV) | (keV) | |||||
| SSS-HR | |||||||
| M101-104 | 1.39/9 | 2.11 | 0.74, 1.13 | ||||
| M101-51 | 0.57/7 | 6.19 | 2.16, 3.32 | ||||
| M101-18 | 1 (fixed) | 0.96/13 | 1.02 | 0.35, 0.55 | |||
| M101-102 | 1.18/75 | 82.67 | 28.8, 44.4 | ||||
| M83-50 | 1.24/5 | 1.14 | 0.28, 0.30 | ||||
| M83-54 | 0.66/7 | 2 | 0.50, 0.53 | ||||
| M83-79 | 0.33/5 | 4 | 1, 1.1 | ||||
| M51-12 | 1.12/15 | 6.17 | 4.38, 5.20 | ||||
| NGC4697 (3 sources) | 0.66/6 | 1.89 | 3.10, 12.28 | ||||
| SSS- | |||||||
| M83 (18 sources) | 1.05/17 | 9.01 | 2.25, 2.38 | ||||
| QSS-MNOH | |||||||
| M101-114 | 0.91/16 | 9.0 | 3.14, 4.83 | ||||
| M101-116 | 1 (fixed) | 1.34/10 | 0.45 | 0.05, 0.08 | |||
| M83-35 | 1.03/11 | 9.47 | 2.37, 2.50 | ||||
| QSS-FNOH | |||||||
| M51 (3 sources) | 0.97/4 | 35.4 | 25.1, 29.9 | ||||
| QSS-SNOH | |||||||
| M101 (3 sources) | 1.06/10 | 1.15 | 0.40, 0.62 | ||||
| QSS- | |||||||
| M101-53 | 1.18/7 | 2.01 | 0.7, 10.8 | ||||
| M51-10 | 0.2 (fixed) | 1.16/13 | 4.69 | 3.33, 3.96 | |||
| M83-105 | 1.13/5 | 1.36 | 0.34, 0.36 | ||||
| M83-116 | 1.55/25 | 6.17 | 1.54, 1.63 | ||||
| M83-117ffBackground (diffuse emission) not subtracted. | ggMEKAL plasma temperature. | 1.31/19 | 75.6 | 18.9, 20 | |||
| M83-119 | 1.24/20 | 6.5 | 1.62, 1.72 | ||||
| QSS-NOH | |||||||
| M83 (6 sources) | 0.57/5 | 0.95 | 0.24, 0.25 | ||||
| QSS-HR1 | |||||||
| M83-120ffBackground (diffuse emission) not subtracted. | 1 (fixed) | ggMEKAL plasma temperature. | 0.62/14 | 4.74 | 1.18, 1.25 |
Note. — All quoted uncertainties are 90% confidence. The ACISABS model was applied to correct for the degradation of ACIS (see text).
| Galaxy | |||||
|---|---|---|---|---|---|
| M101 | 0.09 | 0.08 | 0.006 | 15 | 13 |
| M83 | 0.20 | 0.18 | 0.004 | 50 | 45 |
| M51 | 0.05 | 0.04 | 0.001 | 50 | 40 |
| NGC4697 | 0.36 | 0.14 | 0.001 | 360 | 140 |
Note. — : Fraction of VSSs in the central 1 kpc; Fraction of all X-ray sources in the central 1 kpc; : fraction of the galaxy’s total surface area comprised by a kpc radius disk.