The alignment of the magnetic field and collimated outflows in star forming regions - the case of NGC 2071
Abstract
The magnetic field is believed to play a crucial role in the process of star formation. From the support it provides during the initial collapse of molecular clouds to the creation of strong collimated jets responsible for large mass losses, current theories predict its importance in many different stages during the formation of stars. Here we report on observational evidence which tests one aspect that can be inferred from these theories: the alignment between the local magnetic field and collimated bipolar outflows in such environments. There is good evidence of an alignment in the case of NGC 2071.
1 Introduction.
In two previous papers (Houde et al., 2000a, b), we presented theory and observations which established the possibility of detecting the presence of the magnetic field in molecular clouds through its effects on the profile of molecular ion emission lines. This new effect can be dramatic and can produce ion profiles with narrower line width and significantly suppressed high velocity wings when compared to the spectra of coexistent neutral molecular species. It is observed in the weakly ionized plasmas of the dense interstellar medium provided they are supported by turbulence or stellar outflows rather than thermally. It also requires some degree of misalignment between the local mean magnetic field and the neutral flows present in the gas. Differences between the line profiles of the ion and neutral species disappear if the flows and the magnetic field are aligned.
This effect resembles in many ways the ambipolar diffusion phenomenon which arises when one considers similar environments in a collisionally dominated regime (i.e., magnetohydrodynamics). Under such circumstances, if the small-scale spatial gradients of the magnetic field can be neglected then gyromagnetic motions can also be ignored and the drift speeds between the ions and the neutrals is found to be small (Shu, 1992). But as we have shown in our first paper on the subject (Houde et al., 2000a), in the presence of neutral flows the magnetic forces quickly dominate over collisional processes even in cases where the local field is relatively weak (a few G at a neutral density of cm-3). Gyromagnetic motions then become important, spatial variation in the magnetic field on the scale of a gyro-radius arise and much larger drift speeds are observed.
As can be inferred from earlier comments, the detection of a magnetic field is most easily established in cases where the differences between the lines profiles of ions and neutrals are strongly accentuated. However, under the assumption of the existence of a sufficiently large magnetic field, a high degree of similarity in the spectra can potentially tell us something about the alignment between the mean magnetic field and the flows. This is mostly interesting for the study of objects which show strong collimated bipolar outflows as it allows a comparison between theory and observation. Indeed, current theoretical models (see Bachiller (1996) for a review) predict the existence of bipolar jets emanating from the poles of the protostars during certain stages of star formation. One agent necessary for the presence of these jets is believed to be the magnetic field to which they would be aligned.
While these jets can be observed at optical and/or radio frequencies, molecular outflows, which appear to exist in irregular shells or in the walls surrounding the cavities formed by the jets, are also detected at millimeter and submillimeter wavelengths. The alignment between these molecular outflows and the magnetic field has been observed at optical wavelengths with measurements of the orientation of the polarization vectors of the radiation emanating from background stars located behind bipolar outflows originating from protostars (Cohen et al., 1984; Heiles, 1987) and, more recently, at millimeter or submillimeter wavelengths through line and continuum polarization detections (Girart et al., 1999b). The technique we present here, which we argue also allows us to achieve this, has the advantage of being very simple. It only requires comparisons of the line profiles of coexisting neutral and ion molecular species, in our case HCN and HCO+, taken at the same positions in the outflows.
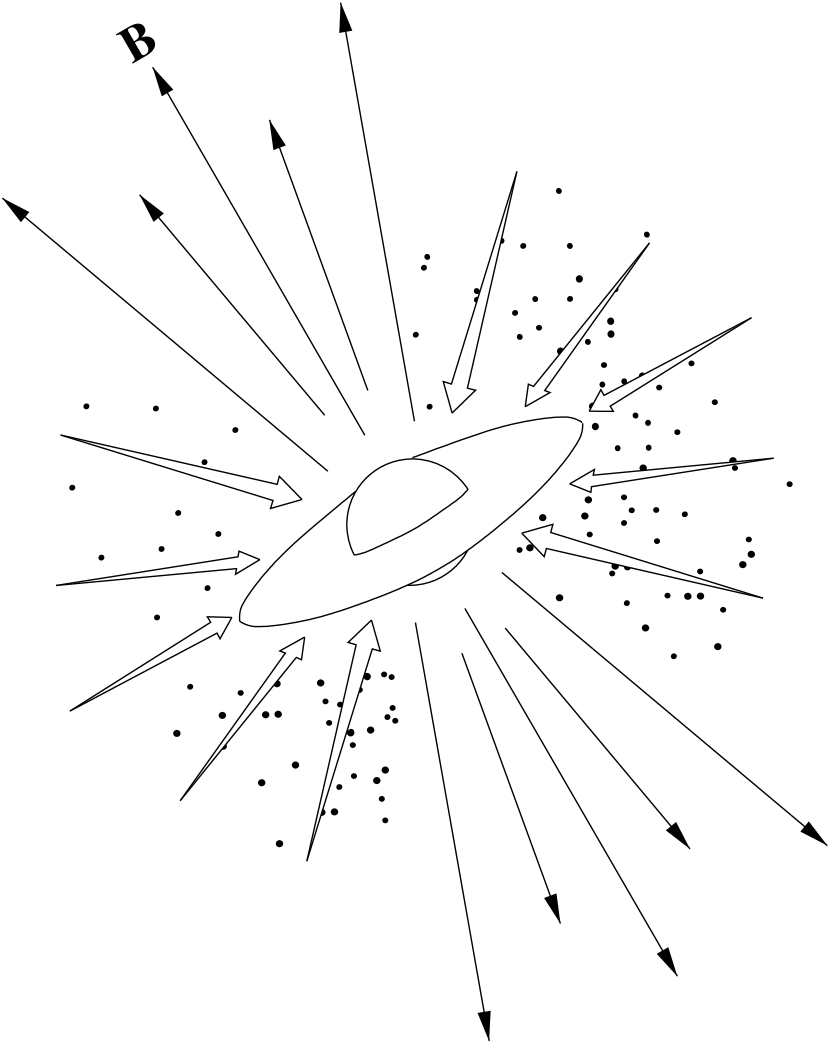
To show how this can be done, we examine the following set of equations (Houde et al., 2000b) which applies to cases where the region under study has i) an azimuthal symmetry about the axis parallel to the orientation of the mean magnetic field and ii) a reflection symmetry across the plane perpendicular to this axis (see Figure 1). We also assume that the flows in the region under study are linear, the plasma is weakly ionized and all the collisions between ion and neutral molecules are perfectly elastic:
| (1) | |||||
| (2) | |||||
The first equation gives an expression for the width (variance) of the neutral line profile and the second another expression for that of the ion. The summation runs over every flow present in any quadrant of any plane which is perpendicular to the plane of reflection symmetry and which also contains the axis of symmetry. is the weight associated with the neutral flow , which presumably scales with the particle density (we assume ions and neutrals to exist in similar proportions), its velocity is given by , is the angle between its direction and that of the mean magnetic field and is the angle between the latter and the line of sight to the observer. and are coefficients that are weak functions of the ion mass and the reduced mass . If we choose the mean neutral molecular mass to be , we get and for a wide range of ion masses. We can easily verify from equations (1) and (2) that, as was mentioned above, the ion and neutral species will have similar line widths if the magnetic field and the flows are aligned (), irrespective of what the viewing angle is. The difference between the line widths is maximized when the flows are perpendicular to the field ().
The difference between the two line widths is also a function of the viewing angle . While we have when the magnetic field is parallel to the line of sight (), we get:
for HCO+ when (with for at least one value of ).
In general, the line narrowing and high velocity wing suppression effects are seen in the core of molecular clouds for many ion species (HCO+, H13CO+, N2H+, HCS+ and H3O+ have been studied so far) whether the observed lines are optically thin or not. Some notable examples are W3 IRS 5, OMC-1, OMC-2 FIR 4 and OMC-3 MMS 6. We also showed, in our previous study of a sample of eleven molecular clouds (Houde et al., 2000b), that the ratio of ion to neutral line width is likely to vary significantly from one source to another, with the ion species always exhibiting narrower line profiles. However, when averaged over the sample, it is fairly close to what would be expected if the flows were randomly oriented in relation to the direction of the mean magnetic field (as can be calculated from equations (1) and (2)). Perhaps this is a sign that there is no obvious propensity for the alignment between the two in the cores of such high density molecular clouds. But in at least one case of a well defined outflow, field and flow alignment is indicated.
In the next section, we present observations of the NGC 2071 molecular cloud where we argue that HCN and HCO+ spectra provide evidence for the alignment between the magnetic field and the collimated outflow. This conclusion will be drawn from the remarkable similarities between the profiles observed in the bipolar outflow for these two molecular species. We should stress that this result, in itself, does not validate the different theories that call for such an alignment. For all we know NGC 2071 may just be a chance happening. Similar studies, like the one presented here or others using different techniques, will have to be done on a number of objects before a conclusion can be reached.
In light of the above discussion concerning the significant difference in line widths which we observed in molecular clouds, we infer that, from a more general standpoint, the case studied in this paper is rather unusual. An explanation for this might reside in the fact that the aforementioned narrowing of the ion lines could be an indication that the central structure of the clouds is more complex than the simple, bipolar outflow that will be dealt with here. A given core could harbor multiple flows and even, perhaps, a magnetic field which may be controlled from a system external to it. For example, one could conceive of the possible interactions between the fields and flows emanating from different protostellar sources residing in the core. Hopefully, possible future high-resolution (interferometric) observations will shed some light on this issue.
2 Observations.
NGC 2071 is an optical reflection nebula located at approximately 390 pc in the L1630 molecular cloud of the Orion B region. This object is known to exhibit a strong bipolar outflow which has been extensively studied with many different molecular species (see Girart et al. (1999a) and references therein). Some of its main characteristics are its relatively high degree of collimation, its large size and a favorable viewing angle which all contribute to a relatively well understood geometry, making this source a perfect candidate for the application of our technique.
Our observations of NGC 2071 were made at the Caltech Submillimeter Observatory (CSO) using the facility’s 300-400 GHz receiver (beam width ). 12CO () data was obtained on 29 January 1997 and 5 February 1999 while HCN () and HCO+ () spectra were obtained on 29 October 1999 and 16 December 1999.
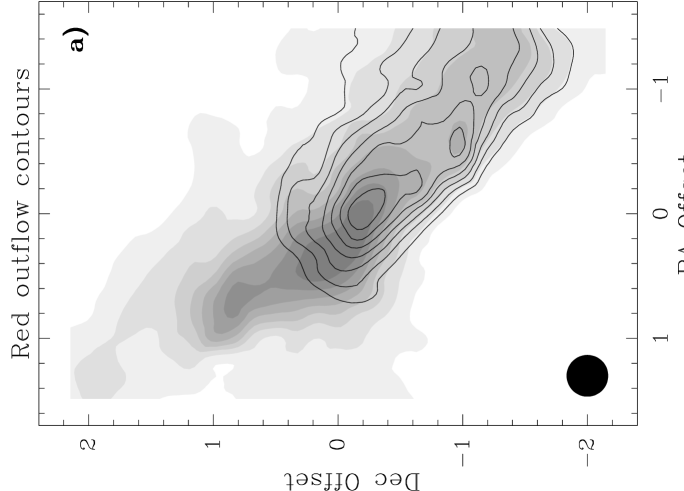
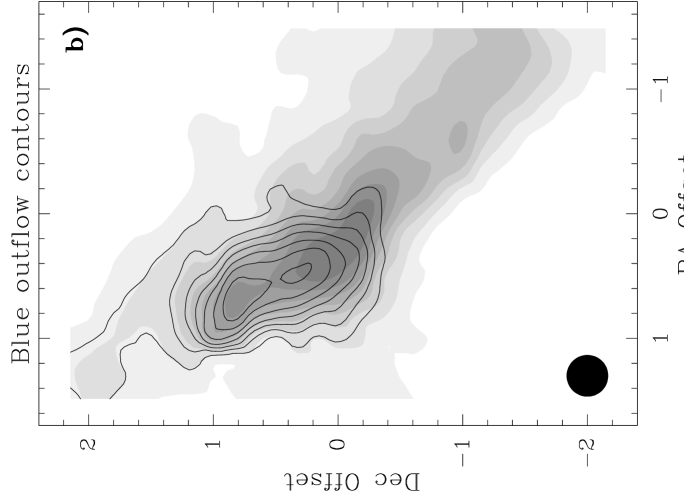
Figure 2 shows two 12CO () maps, the contours highlight the integrated intensity of a) the red outflow (10 km/s 50 km/s) and b) the blue outflow (-50 km/s 10 km/s). The underlying grey scale levels delineate the total integrated intensity (-50 km/s 50 km/s).
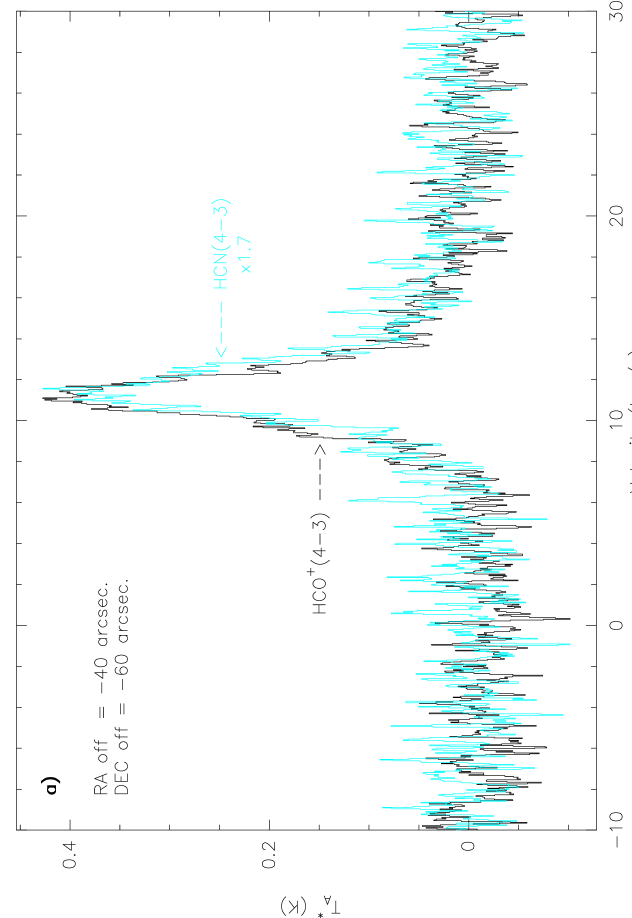
Figure 3a) shows three spectra (12CO, HCN and HCO+) taken at the source’s center position. The HCN and HCO+ spectra are very similar with their center velocity ( km/s) reasonably well aligned with the self-absorption feature of the 12CO spectrum (presumably caused by and at the velocity of the ambient quiescent cloud). The HCO+ to HCN line widths ratio was calculated to be 0.93 (Houde et al., 2000b). Although this position is not located in any of the two outflows, this number suggests that perhaps we have a good alignment between the mean magnetic field and the outflow. To verify this, we have obtained deep integration spectra in one position for each outflow.
Figure 3b) shows spectra of the same molecular species taken in the redshifted outflow (, ). The 12CO spectrum shows an extended high velocity wing that goes as far as 40 km/s. The HCN and HCO+ spectra are, of course, much weaker at this position than in the core but also exhibit redshifted velocity wings which indicate that they are taking part in the outflow motion. At first look, these two spectra show similar profiles, reinforcing the alignment hypothesis between the magnetic field and the collimated outflow. Note that the velocity at peak intensity ( km/s) differs somewhat from that of the quiescent part of the cloud ( km/s). Figure 3c) shows a similar set of spectra taken in the blueshifted outflow (, ). The 12CO spectrum again exhibits a strong high velocity wing that extends to approximately km/s. This time, the HCN and HCO+ line profiles are noticeably different. But both spectrum have a velocity wing that extends as far as that of 12CO while also showing a narrow peak at the velocity of the ambient cloud. This component can be discarded when comparing the wing profiles. This can be ascertained with the help of Figure 3d) where we present a set of spectra taken at a position (, ) situated at approximately the same distance from the core as those of Figure 3b) and c) but in a direction roughly perpendicular to the axis of the outflow. At this position, only this component is present in the spectra and it is natural to assume that it is the result of emissions emanating from the quiescent part of the cloud and not from the outflowing gas.
3 Alignment of the magnetic field and the collimated outflows.
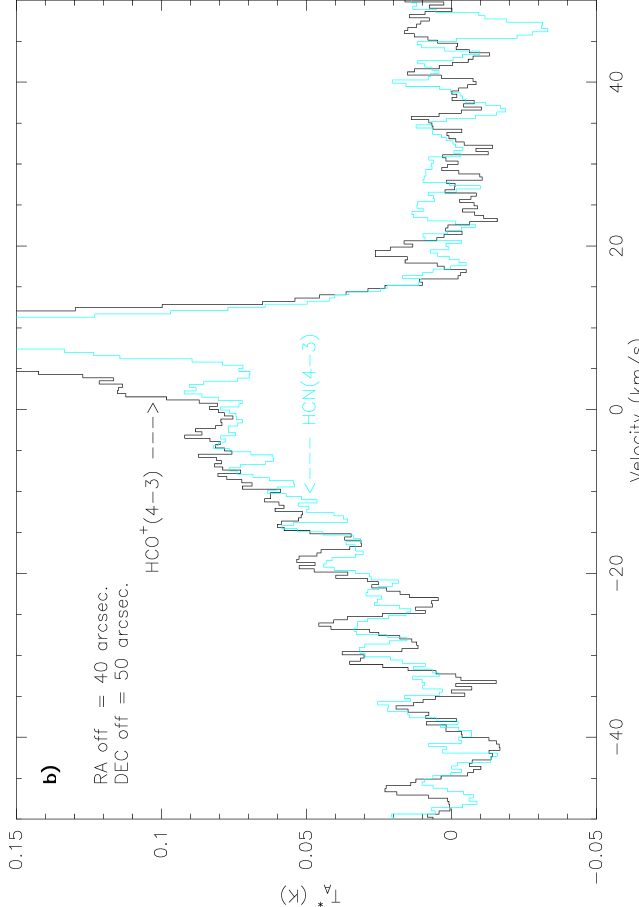
As we mentioned earlier, according to the material we presented in our two previous papers (Houde et al., 2000a, b), the line profiles of coexistent ion and neutral molecular species should show no significant differences in cases where there is a good alignment between the mean magnetic field and the flows present in a given region of a molecular cloud. In Figure 4, we have superposed the HCN and HCO+ spectra obtained in the red and blueshifted outflows presented in Figure 3b) and c). We have also scaled the range of the vertical axis in order to better show the details of the different spectra and avoid any unwanted confusion that could be brought by the components of the quiescent part of the cloud. In both cases, the similarity between the HCN and HCO+ spectra is striking. We are led to the conclusion that there is strong evidence for a high degree of alignment between the magnetic field and the bipolar outflow of NGC 2071. We do not mean to imply that this validates the different theories that call for such an alignment, for all we know NGC 2071 may just be a chance happening. Similar studies like this one (or using other techniques) will have to be done on other objects before a conclusion can be reached.
Evidently, there is always the alternative that there is no magnetic field in the outflows to impede the motion of the ions (a comparison of optically thin lines (H13CN and H13CO+) which probe deeper in the source’s center, presented in Houde et al. (2000b), gives an ion to neutral line width ratio of 0.64 and, therefore, establishes the presence of a magnetic field in the core). Because of this we cannot be absolutely certain of the alignment. But as Cohen et al. (1984) and Girart et al. (1999b) have shown, a magnetic field does exist in the outflow of many objects. It is therefore likely that the same is true for outflowing sources in general.
3.1 The driving agent behind the outflows.
The previous discussion and the conclusion we reached are partly based on the assumption, and likely hypothesis, that jets are the primary driving agent of molecular outflows. In this scenario, outflows with standard high velocities would consist of ambient cloud gas which has been swept up by underlying winds. Whether these winds are composed of the (ionized) jets alone or in combination with a significant neutral component is uncertain, but there is evidence that entrainment of the ambient gas by bow shocks or turbulent mixing on the sides of the jets can be achieved (Bachiller, 1996).
Our interpretation of the data might change if the driving agent were of a different nature. In fact, our analysis rests on the assumption that neutral flows are present, working on the ion species and trying to bring them along in the flows via collisions. Something of this sort is needed to explain the difference in the line profiles between coexistent ions and neutrals observed in the core of molecular clouds (i.e., the larger widths of the neutral spectra (Houde et al., 2000a, b)). Our conclusions might not apply if, on the other hand, the situation were reversed and the ions were driven through some magnetohydrodynamical process and working on the neutrals. But we would then expect the ions to have spectra which would be at least as wide as those of the neutrals and sometimes broader, depending on the degree of coupling between the two species.
4 Conclusion.
Using some of the material presented in our two previous papers (Houde et al., 2000a, b), we have shown how it is possible to find out if the mean magnetic field and collimated outflows are aligned with each other in star formation regions. We have applied this technique to data obtained at the CSO for the NGC 2071 molecular cloud and concluded that there is strong evidence that there exists a high degree of alignment in this case. This technique has the advantage of being very simple since it only requires a comparison between the line profiles of two coexistent molecular species (in our case HCN and HCO+).
References
- Bachiller (1996) Bachiller, R. 1996, ARA&A, 34, 111
- Cohen et al. (1984) Cohen, R. J., Rowland, P. R., and Blair, M. M. 1984, MNRAS, 210, 425
- Girart et al. (1999a) Girart, J. M., Ho, P. T. P., Rudolph, A. L., Estalella, R., Wilner, D. J., and Chernin, L. M. 1999, ApJ, 522, 921
- Girart et al. (1999b) Girart, J. M., Crutcher, R. M., and Rao, R. 1999, ApJ, 525, L109
- Heiles (1987) Heiles. C. 1987, in Interstellar Processes, eds. Hollenbach, D. J. and Thronson Jr., H. A. (Reidel), 171
- Houde et al. (2000a) Houde, M., Bastien, P., Peng, R., Phillips, T. G., and Yoshida, H. 2000a, ApJ, 536, 857
- Houde et al. (2000b) Houde, M., Peng, R., Phillips, T. G., Bastien, P. and Yoshida, H. 2000b, ApJ, 537, 245
- Shu (1992) Shu, F. H. 1992, The Physics of Astrophysics, volume II: Gas Dynamics (University Science Books), ch. 21, 27