THE DIVERSITY OF GAMMA-RAY BURST AFTERGLOWS AND THE SURROUNDINGS OF MASSIVE STARS
Abstract
The finding of a Type Ic supernova connected with GRB 030329 showed a massive star origin for this burst, supporting evidence for this association in previous bursts with lightcurve bumps at the appropriate time for a supernova. Here, we explore the possibility that all long bursts have massive star progenitors, interacting with either the freely expanding wind of the progenitor or the shocked wind. We present models for the afterglows of GRB 020405 and GRB 021211, which are a challenge to wind interaction models. Considering sources for which wind interaction models are acceptable, a range of wind densities is required, from values typical of Galactic Wolf-Rayet stars to values times smaller. The reason for the low densities is unclear, but may involve low progenitor masses and/or low metallicities. If mass is a factor, a low density event should be associated with a low mass supernova. The interpretation of bursts apparently interacting with constant density media as interaction with a shocked wind requires both a range of mass loss densities and a range of external pressures. The highest pressures, cm-3 K, may be due to an extreme starburst environment, which would imply that the burst is superposed on an active star forming region. Although the range of observed events can be accomodated by the shocked wind theory, special circumstances are necessary to bring this about. Finally, we consider the high velocity, high ionization absorption features observed in some afterglow spectra. If the features are circumstellar, the presence of the burst in a starburst region may be important for the formation of clumps near the burst.
1 INTRODUCTION
The spectroscopic finding of SN 2003dh in the afterglow light from GRB 030329 (Stanek et al. 2003; Hjorth et al. 2003) showed a direct link between a cosmological GRB (gamma-ray burst) and the supernova explosion of a massive star, supporting the previous identification of the nearby SN 1998bw with GRB 980425 (Galama et al. 1998). This event also supports the view that the “bumps” found in the light curves of a number of afterglows are, in fact, supernova light. Sources with plausible supernova light from photometry include GRB 970228 (Reichart 1999; Galama et al. 2000), GRB 980326 (Bloom et al. 1999), GRB 011121 (Bloom et al. 2002; Garnavich et al. 2003), and GRB 020405 (Price et al. 2003b). The recent GRB 021211 shows tentative evidence for supernova light in HST (Hubble Space Telescope) observations (Fruchter et al. 2002) and evidence for a supernova spectrum like that of the normal Type Ic SN 1994I in the light of the burst has been reported (Della Valle et al. 2003). In this case, the possible supernova is fainter than SN 1998bw and is comparable in luminosity to SN 1994I.
The implication of the supernova light is that the progenitor object is a massive star. The existing evidence is consistent with the supernova occurring at the same time as the GRB, and that is the assumption that we make. An implication of a massive star progenitor is that the environment for the progenitor is determined by the mass loss wind from the star (Mészáros, Rees, & Wijers 1998; Dai & Lu 1998; Chevalier & Li 1999, 2000, hereafter CL99, CL00 respectively; Livio & Waxman 2000). If there is a free wind from the progenitor star, the wind density is , where is the mass loss rate and is the wind velocity. If the progenitor star is a Wolf-Rayet star, characteristic mass loss parameters are and ; the value of the density can be scaled to the corresponding value for these parameters, (CL99).
The existing information on the afterglows of GRB 970228 and GRB 980326 is consistent with free wind interaction, although there is insufficient information to tie down the wind density (CL99, CL00). In the case of GRB 011121, wind interaction is indicated, with (Price et al. 2002c). GRB 020405 presents more of a problem, because Berger et al. (2003) found that a free wind model is not indicated and they proposed a model involving interaction with a uniform medium. For GRB 021211, Kumar & Panaitescu (2003) consider both uniform medium and wind models, both of which have certain difficulties. For their wind model, the surrounding density must be low, . Because these two sources are of special interest from the massive star progenitor point of view, we consider models for their afterglows in § 2. In § 3, we note that a number of sources appear to be better modeled as interacting with a constant density medium, and investigate the possibility that these objects involve interaction with a shocked stellar wind (Wijers 2001). In view of the evidence for a low density environment around some GRBs, we consider the range of wind densities around Wolf-Rayet stars in § 4. Another possible constraint on the environment of GRBs comes from absorption lines observed in afterglow spectra. Possible implications of the lines are discussed in § 5. Discussion and conclusions are in § 6. We do not consider the tantalizing evidence for X-ray lines, which have not yet attained a high degree of statistical significance.
2 FREE WIND MODELS FOR AFTERGLOWS
Although interaction with a free wind has been considered in modeling afterglows, the number of objects for which such models are successful remains small (e.g., Panaitescu & Kumar 2001, 2002; Yost et al. 2003). Here, we consider two bursts that are of interest because they have possibly been associated with supernovae. The association is more secure in the case of GRB 030329, but data are still becoming available for this object and the optical light curve is complicated by fluctuations, so we defer a discussion of this burst.
2.1 Low-Density Wind Model for GRB 020405
The bright gamma-ray burst GRB 020405 occurred at April 5.0288, 2002 UT. It was detected and localized by the InterPlanetary Network (IPN) consisting of Ulysses, Mars Odyssey/HEND and BeppoSAX (Hurley et al. 2002). The burst is a typical long GRB, with a duration of sec (Price et al. 2003b). An optical afterglow was identified by Price et al. (2002a) about 17 hours after the burst, which allowed for the redshift to be determined at later on (Masetti et al. 2002; Price et al. 2002b). A late red bump was found in the optical data, which was interpreted as coming from an underlying supernova (Price et al. 2003b). Radio and X-ray afterflows were also observed (Berger et al. 2003; Mirabal, Paerels & Halpern 2003a), making it possible to model the source.
Berger et al. (2003) considered the multifrequency observations, and favored an afterglow model in which a jet expands into a constant density, presumably interstellar, medium. The evidence for the ambient medium being a constant density medium, as opposed to a massive star wind, comes from the radio data: the emission at 8.5 GHz is observed to have an initial flux of mJy at day 1.2 and a rapid decline afterwards. The standard interpretation for such a “radio flare” is that it comes from the reverse shock of the GRB ejecta (Sari & Piran 1999). This is possible only if the ejecta run into a medium of relatively low density, such as the typical interstellar medium. A dense Wolf-Rayet wind with a typical mass loss rate () can be ruled out (Berger et al. 2003), because the radio emission would die out on a time scale shorter than a day (CL00; Kobayashi & Zhang 2003). It is, however, difficult to reconcile the constant density medium inferred in the immediate environment of this GRB with the aforementioned evidence for an underlying supernova: the latter points to a massive star progenitor, which should be surrounded by a wind.
A possible resolution of the above paradox is that the progenitor wind has a lower density (i.e., ) than contemplated so far in the literature (see, however, Wu et al. 2003 and Dai & Wu 2003). A low wind density would change the reverse shock evolution from cooling to non-cooling and would prolong the radio emission from the reverse shock, making the wind model potentially compatible with the radio flare observed in GRB 020405.
The optical and X-ray data provide some evidence for wind interaction. Bersier et al. (2003) found that the R band flux decreases with time approximately as between day 1 and 4. The spectrum in the optical was determined to be at day 1.3, where a correction for Galactic extinction has been included. The temporal slope in the optical, , agrees within uncertainties with that in the X-ray, , which is determined between about day 1.7 and 2.3 from Chandra observations (Mirabal et al. 2003a). The spectral slope in the X-ray, , is shallower than that in the optical, (Bersier et al. 2003) or (Price et al. 2003b; see also Masetti et al. 2003), but agrees with the broad-band slope of between the optical and X-ray (Mirabal et al. 2003a). The agreement suggests that the steeper optical slope is probably caused by extinction in the host galaxy; some extinction is expected for the host column density of cm-2 determined from X-ray observations (Mirabal et al. 2003a). If the optical spectrum has an intrinsic slope similar to that of the X-ray spectrum, then the optical and X-ray data can be explained naturally in a wind model with , provided that the cooling frequency is above the X-ray frequencies at the time of observation (Mirabal et al. 2003a). The predicted temporal slope is and spectral slope , both consistent with the optical through X-ray observations. The relatively high cooling frequency required in this model points to a low density in the progenitor wind and/or a low energy fraction for magnetic fields in the blast wave.
To estimate the wind density, we will concentrate on modeling the emission from the forward shock, whose dynamic evolution is largely independent of the details of the initial energy injection from the central engine. The reverse shock, on the other hand, depends on the nature of the GRB ejecta, which is uncertain. The ejecta may have complex substructures and perhaps dynamically important large-scale magnetic fields (Coburn & Boggs 2003), both of which complicate the dynamics of the reverse shock.
To model the forward shock emission, we adopt the analytic expressions of Granot & Sari (2002). These expressions are obtained by fitting numerical calculations based on the spherical, self-similar solutions of Blandford & McKee (1976) for blast wave dynamics. The evolution of the nonthermal electrons injected at the shock front and their synchrotron emission are treated accurately.
To begin the quantitative discussion, we first estimate the flux in the R-band ( Hz) at day. Price et al. (2003b) determined a flux of Jy (after correcting for a Galactic extinction of ) at day 0.91. If the flux decays with time as , then the flux at day 1 would be about 36 Jy. We adopt a somewhat larger, round number of 40 Jy, in view of the evidence for extinction in the host galaxy discussed above. This flux sets the overall scale for the emission in the optical and X-ray bands. It provides a constraint on the parameters of the wind model. From the expression for flux in Table 1 of Granot & Sari (2002; segment G), we find
| (1) |
where a luminosity distance of cm (corresponding to in a flat Universe with , and km s-1 Mpc-1) and are adopted, and a subscript denotes a quantity divided by . Here, is the fraction of the postshock energy density in the magnetic field and is the equivalent isotropic energy in the blast wave. The reduced electron energy fraction used in Granot & Sari (2002) is here replaced by the more commonly used, actual fraction .
A second model constraint comes from the radio emission observed after the initial flare. This component has a more or less constant flux of Jy at 8.5 GHz up to about day 30 (Berger et al. 2003). It could be produced in the forward shock since, in the slow cooling regime under consideration, the flux at a given frequency is constant before the characteristic time , when the typical frequency passes through that frequency (CL00). Denoting the constant flux produced in the forward shock by , we find
| (2) |
where we have used the expressions for the typical frequency and the corresponding peak flux from Table 2 of Granot & Sari (2002). Combining equations (1) and (2), we obtain an expression for the wind density parameter
| (3) |
Since the electron energy fraction is unlikely to exceed 1/3 (the value for energy equipartition between nonthermal electrons, protons and magnetic fields) and must not be more than about Jy, we conclude that . In other words, the density is well below than that of a typical Wolf-Rayet wind ().
The low wind density is consistent with, but not required by, the high cooling frequency inferred from the optical/X-ray data. As mentioned earlier, the cooling frequency needs to be above the X-ray frequencies between day 1.7 and 2.3. Denoting the cooling frequency at day 1.7 by , we find from the expression for in Table 2 of Granot & Sari (2002) that
| (4) |
where Hz (corresponding to an X-ray energy of 10 keV). This equation can be combined with equations (1) and (2) to yield
| (5) |
and
| (6) |
The inferred spherical blast wave energy for the fiducial set of parameters (, and ) is comparable to the -corrected, isotropic-equivalent -ray energy release, which is ergs according to Price et al. (2003b).
In deriving equation (4), we have assumed that inverse Compton scattering does not modify the cooling frequency significantly. We verified that this is the case for the fiducial parameters during the time of interest (after a day or so), when the forward shock is in the slow cooling regime and only a small fraction of nonthermal electrons radiate efficiently. If is much larger than , then would be very small, and inverse Compton scattering could dominate synchrotron radiation in cooling the nonthermal electrons (e.g., Sari & Esin 2001). In such a case, equation (4) and expressions (5) and (6) need to be modified accordingly.
If the more or less constant radio emission at 8.5 GHz after the initial flare comes from the forward shock, then Jy, which yields a self-absorption time
| (7) |
according to Granot & Sari (2002). This time is before the first radio observation, and is consistent with it marking the beginning of the predicted constant-flux segment of radio light curves (CL00). The segment is expected to end at the characteristic time
| (8) |
which is later than the observed turnover around day 30. We need to invoke an additional process, such as a jet break, to account for the turnover. A collimated blast wave is indicated by the high degree of polarization (up to ; Bersier et al. 2003) observed in the optical emission. To produce a break around day 30, the jet must have a half-opening angle of order (CL00)
| (9) |
which would bring the inferred blast wave energy down to
| (10) |
This value is in line with the “standard” energy advocated by Frail et al. (2001).
Whether the observed radio flare itself can be explained by the free wind model is uncertain. The flare presents two potential difficulties to the model. First, it may be absorbed in the forward shock, if the wind is dense enough. This is, however, not a problem since the forward shock becomes transparent to the radiation at 8.5 GHz well before the earliest time of observation according to equation (7). Second, after the reverse shock crosses the GRB ejecta, no new nonthermal electrons are accelerated, and the reverse shock emission cuts off above a certain frequency . The cutoff frequency is expected to be well below 8.5 GHz at day 1 or later for typical Wolf-Rayet wind parameters. In the case of GRB 020405, this may not be a problem for the following reason. As mentioned earlier, the optical through X-ray data can be explained if the cooling frequency at day 1.7 is comparable to, or greater than, Hz. Since , we have in the forward shock at the time when the reverse shock crosses the GRB ejecta. Since the energy densities are comparable in the forward and reverse shocks at this time, the cooling frequency in the reverse shock (above which the emission cuts off) should be comparable to that in the forward shock if their magnetic energy fractions are also comparable. Kobayashi & Zhang (2003) showed that the cutoff frequency scales with time as in a wind model at , adopting simple assumptions about the GRB ejecta and their dynamics after the passage of the reverse shock front. The scaling yields a cutoff time days, which is late enough to accommodate the radio flare observed at day 1.2. Between and , the radio flux is predicted to decrease as , which is too shallow to explain the rapid decline of roughly between the initial peak and the second observation at day 3.3. The cutoff time must therefore occur before day 3.3, which requires that the cooling at day 1.7 occurs close to 10 keV. The reverse shock emission at the lower frequency 1.4 GHz can extend beyond day 3.3. It may account for the unusual spectral slope of observed between 1.4 and 8.5 GHz at day 3.3 when combined with the radio emission from the forward shock, which is expected to have a spectrum .
2.2 Low-Density Wind Model for GRB 021211
GRB 021211 was an X-ray rich GRB detected and localized by HETE-2 on December 11.4712, 2002 (Crew et al. 2003). A bright optical afterglow was discovered and followed up within minutes of the burst (Wozniak et al. 2002; Li et al. 2003; Park et al. 2002; Fox et al. 2003). At an age of sec, the afterglow had an R-band magnitude of (Wozniak et al. 2002). It decayed with time approximately as for about 11 min. Thereafter, the decay flattened to roughly (Li et al. 2003; Fox et al. 2003; Pandey et al. 2003). Vreeswijk et al. (2002) determined the redshift to be . Late time observations show some evidence for a underlying supernova (Fruchter et al. 2002; Della Valle et al. 2003).
The close resemblance of the early light curve of GRB 021211 to that of GRB 990123 has led to the suggestion that the initial, faster declining emission comes from the reverse shock of the GRB ejecta (e.g., Li et al. 2003; Fox et al. 2003), thought to be the case for GRB 990123 (Sari & Piran 1999). The relatively shallow slope of this portion, , was taken as evidence against a wind model (Fox et al. 2003). We note, however, that the earliest emission could be a combination of emissions from the forward and the reverse shock, and the shallow slope may or may not be a problem. This point will be discussed further toward the end of the subsection. Here we discuss the data after about 11 min in the context of a wind model, and try to constrain the wind density.
The wind model predicts a decay slope of below the cooling frequency and above. In the R-band, the decay observed after about 11 min is relatively flat, with . This slope would be difficult to accommondate in a wind model, unless the power index of electron energy distribution is close to 2 and the R-band lies above the cooling frequency. We choose an index slightly above 2, , which yields a decay slope in the cooling regime. The corresponding spectral slope is , which can be constrained by the color of the afterglow. The most relevant data come from the nearly simultaneous R and J band measurements of McLeod et al. (2002) and Bersier et al. (2002) around day 0.86. Their R-band magnitude of and J-band magnitude of yield a spectral slope of using the photometric zeropoints of Campins, Rieke & Lebofsky (1985) for J and Fukugita, Shimasaku & Ichikawa (1995) for R, after correcting for Galactic extinction of (Pandey et al. 2003). This slope is consistent with the wind model within uncertainties. Based on B and Ks band photometry, Fox et al. (2003) obtained a slope around day 0.1. This slope is again consistent with the model, although the Ks band flux is measured at day 0.0823 while that at R band at day 0.1310; some uncertainties are involved in extrapolating the data to a common time. Nearly simultaneous data exist at day 7 in J, H and Ks band (Fox et al. 2003). They yield a spectral slope , indicating contributions from other components than the afterglow at this (late) time, possibly an underlying supernova. We conclude that while the sparse multiple-color data available are unable to provide strong support for the wind model, they do appear to be consistent with the model, provided that the R-band is emitted by fast cooling electrons up to about day 1 or beyond.
As in the case of GRB 020405, we adopt the analytic expressions of Granot & Sari (2002) to derive model constraints. The first constraint comes from the R-band flux, which has an estimated magnitude of 23.1 at day 1. From the expression for the flux in segment H of the lightcurves of Granot & Sari, we find
| (11) |
A second constraint comes from the characteristic time when the typical frequency passes through the R-band. This should occur around, or before, the kink in the early light curve at days; otherwise, there will be a flat segment in the light curve (with ; CL00) between the early steep segment and the shallower segment at later times, which is not observed. This requirement translates to
| (12) |
where . From equation (11) and (12), we can solve for and in terms of :
| (13) |
and
| (14) |
The afterglow of GRB 021211 was not followed up in X-ray. In radio, it was searched for, but not detected (Fox et al. 2003). A stringent upper limit of Jy was obtained at 8.5 GHz by adding up data between day 8.9 and 25.8. This limit provides a further constraint on the wind model,
| (15) |
where . Combining equations (12) and (15), we find
| (16) |
The fourth, and final, constraint comes from the time for the cooling frequency to cross the R-band. This cooling time is given by
| (17) |
where equations (13), (14) and (16) are used to obtain the second equality. As discussed earlier, in order to explain the relatively slow decay of R-band lightcurve in a wind model and the spectral slope observed at day 0.86, we need to demand that the cooling frequency cross the R-band later than about day 1. This condition of day can be made consistent with the requirements that and days when and only when both and are close to their upper limits, according to equation (17). It implies that the cooling frequency crosses the R-band from below around day 1. After day 1, the light curve should steepen to and the spectral slope should become flatter, with . These predictions are difficult to test, because afterglow data are sparse and scattered at late times, and may be contaminated by supernova light.
The inference that days has interesting consequences. It implies, from equation (14), that must be greater than about 0.15; otherwise, the energy fraction in magnetic fields would be greater than unity. On the other hand, should be less than about 1/3, as mentioned earlier. Picking a value between the two extremes, , we find that according to equation (14), ergs according to equation (13), and according to equation (16). The wind density could be somewhat higher, by a factor of two or so, for values of near the upper limit. It is still well below that of a typical Wolf-Rayet star (). The inferred blast wave energy is relatively low, although not far from the “standard” value given in Frail et al. (2001). This energy is not corrected for jet effects, since there is no evidence for jet break in this source. The low energy is perhaps to be expected, given that GRB 021211 has one of the dimmest optical afterglows, and is not detected at radio wavelengths.
Radio emission was searched for at 8.5 GHz around day 0.1, the earliest radio observation of any GRB to date. The source was not detected at this time, with a upper limit of 110 Jy (Fox et al. 2003). The nondetection is consistent with the wind model for the following reason. As noted earlier, the reverse shock emission cuts off above a certain frequency once all of the GRB ejecta have been shocked. We can estimate the cutoff frequency at day 0.1 as we did in the last subsection. Let the time when the ejecta are crossed by the reverse shock front be sec, where is of order unity for GRB 021211. From the inference day and the scaling , we obtain for the forward shock. If the cooling frequencies in the reverse and forward shocks are the same at , then from the scaling (Kobayashi & Zhang 2003) we find that Therefore, at day 0.1, the observing frequency ( Hz) is well above the cutoff frequency, by more than three orders of magnitude.
A potential problem with the wind model is the relatively shallow decay in the initial portion of the R-band light curve before min. Fitting a single power-law through this portion yields (e.g., Fox et al. 2003; see also Pandey et al. 2003). This emission, if coming from the reverse shock alone, would have too shallow a decay for both the constant density and the wind model. The problem is more severe for the wind model than for the constant density model. However, the early afterglow is probably a combination of emissions from the forward and reverse shock, and one must subtract out the (uncertain) forward shock emission from the observed data to obtain the true reverse shock emission. One can in principle extrapolate the data at later times backwards to accomplish this task. The fact that the flattening in the light curve around min is relatively mild, from to (Li et al. 2003; Fox et al. 2003; Pandey et al. 2003), suggests that care must be taken in doing the subtraction. Because of the relatively modest contrast between the two fitted power-laws in the region of interest, the reverse shock emission is sensitive to how the subtraction is done, and can easily have a decay slope that is steeper than . For example, we have subtracted from the data before days (or 11 min) a single power-law with a temporal index (as predicted in the wind model) that fits well the late time light curve and found that the residual light curve can be fitted by . Therefore, we believe that the relatively shallow initial decay in the R-band light curve may not be as serious a problem as initially feared, particularly in view of the uncertainties mentioned earlier in making predictions of reverse shock emission.
A lower value for the wind density, , was derived by Kumar & Panaitescu (2003); they also found a higher isotropic energy. Our model and that of Kumar & Panaitescu both use the optical flux at minutes and the evolution at that time to set a limit on . However, our model has (required for modeling the optical after after 11 minutes) as compared to for Kumar & Panaitescu, and they do not use the cooling constraint that plays a role in our model. In addition to the optical observations at minutes, they modeled the earlier emission as reverse shock emission and the -ray emission itself (assumed to be from the forward shock wave). Both interpretations give a low circumstellar density, although our result is less extreme than that of Kumar & Panaitescu (2003).
2.3 Results on Wind Density from Afterglow Modeling
In Table 1, we list the afterglows that have been modeled assuming interaction with a free wind () density structure. Panaitescu & Kumar (2001, 2002; hereafter PK01, PK02, respectively) have developed both uniform medium and wind models for well-observed afterglows. They find that only in the case of GRB 970508 is the wind model preferred; in other cases (GRBs 991208, 991216, 000418), wind and uniform medium models are equally acceptable. Table 1 shows that most of the wind cases are compatible with of , which is in accord with wind densities for Galactic Wolf-Rayet stars.
In the cases of GRBs 011121, 020405, and 021211, the wind density is considerably lower. Of the sources in the Table, these are also the best cases for the presence of supernova emission. There is a selection effect in that a lower density wind leads to weaker afterglow emission, in which supernova emission may be more easily detected. The case of GRB 021211 is especially striking in this respect; its luminosity was lower than upper limits that have been set for a number of other GRBs, indicating that bursts of this type may be underrepresented in the sample.
An implication of these results is that Type II supernovae are unlikely to be associated with a significant part of the afterglow sample. The radio and X-ray emission from normal Type II supernovae show that Type IIP events appear to have the lowest density circumstellar wind and they have for (Chevalier 2003), implying . One event with a lower density immediately surrounding the supernova is SN 1987A, but the low density extended out only a radial distance cm. This inference is consistent with the finding that Type II supernova progenitor stars are not suitable for the propagation of GRB jets (MacFadyen, Woosley, & Heger 2001; Matzner 2003)
3 BURSTS IN UNIFORM DENSITY MEDIA
Since early studies of well-observed GRB afterglows, interaction with a uniform medium has generally been preferred over interaction with a wind medium (PK02 and references therein). The range of densities that is observed for these cases is typical of that in the interstellar medium and one interpretation is that these objects are interacting directly with the interstellar medium of the host galaxies. However, this is not expected for the environment of a massive star. One possibility is that there is a separate kind of progenitor object for these sources, such as a compact binary system. Another possibility is that a constant density environment can be created around a massive star.
The most plausible reason for a constant density around a massive star is that the wind has passed through a termination shock, creating a hot, approximately constant density region (Weaver et al. 1977). Wijers (2001) has discussed this scenario for the interaction regions of GRB afterglows (see also Ramirez-Ruiz et al. 2001); the question is whether the observed afterglows can be accomodated with conditions expected in a shocked wind.
3.1 Pre-Burst Wind Interactions
The shocked stellar wind depends on the evolutionary stages prior to the Wolf-Rayet stage. For Galactic stars, a standard evolutionary track is to start as an O star, evolve through a RSG (red supergiant) phase or LBV (luminous blue variable) phase with considerable mass loss, and ending as a Wolf-Rayet star (Garcia-Segura et al. 1996a, 1996b). At low metallicity, the RSG phase may be absent (Chieffi et al. 2003); this may also be the case for certain binary stars.
We begin by considering the second case, where the star remains blue throughout its evolution. The total age of a massive star () is years. The typical wind velocity is and a typical leads to a reasonable amount of mass loss during the evolution. The wind power is then , so that provides a reference value for the power. If the surrounding pressure can be neglected, the radius of the wind bubble is cm at (Weaver et al. 1977), where is the ambient density and . The shock velocity is .
The pressure associated with the shock front, , can be expressed as , where we use for in units of K cm-3. If the surrounding pressure is larger than this, the expansion of the bubble is slowed before . The interstellar pressure in the solar neighborhood, when various components of pressure are included, is . In Galactic molecular clouds, (Blitz 1993). High interstellar pressures are attained in an intense starburst region, like the nuclear region of M82 where (Chevalier & Clegg 1985). In ultraluminous starburst galaxies, the pressure may reach (Chevalier & Fransson 2001). The evidence on the positions of GRBs in their host galaxies indicates that they generally follow the light distribution, with some bursts occurring in the very center of a galaxy and others in a more peripheral position (Bloom, Kulkarni, & Djorgovski 2002). The bursts in the central, bright region of a galaxy are the ones that are most likely in a starburst region and may be exposed to a high pressure.
The density in the interstellar bubble depends on the uncertain physics of heat conduction. Heat conduction could be prevented by the magnetic field, which is expected to be toroidal in the shocked wind region. If it is, the density and pressure in the bubble are given by (Weaver et al. 1977)
| (18) |
where is the radius of the wind termination shock. The temperature in the bubble is K. Weaver et al. (1977) consider a particular case with heat conduction (, , , years) and find that the temperature in most of the bubble is lowered to and the density is correspondingly raised. They suggest that the termination shock is not a sharp discontinuity. However, it is possible that instabilities in the collisionless shock suppress heat conduction.
In the case where the star goes through a RSG phase, the Wolf-Rayet progenitor drives a shock wave into the slow moving wind; this forward shock front is likely to be radiative. The termination shock of the Wolf-Rayet star wind should be adiabatic, leading to a relatively thick region of shocked wind. The structure of the shocked region is discussed by Chevalier & Imamura (1983, hereafter CI83), who develop self-similar solutions and find that in the strong shock limit (for both the RSG shock and the termination shock), is determined by the mass loss rates of the winds, , and the ratio of the wind velocities, . Using typical values for these parameters, and , Fig. 5 of CI83 gives the ratios of the wind velocity to the shock velocity of the outer and inner shock, their and . A typical value for is 10; i.e. the termination shock expands at in the rest frame. From their Table 3, we find that , for the above parameter ranges. The density in the shocked region is approximately constant, although it rises toward the contact discontinuity (Fig. 3a of CI83). Beyond the contact discontinuity, a region of shocked RSG wind is expected. Since it should have cooled to K or lower, a density jump of is expected at this point because of approximate continuity of the pressure.
The radius of the shocked region depends on the duration of the Wolf-Rayet phase. As a reference value, we take years. For , the radius of the termination shock is cm and the pressure in the shocked region is . In the case where the interstellar pressure is higher than this, the expansion is stalled.
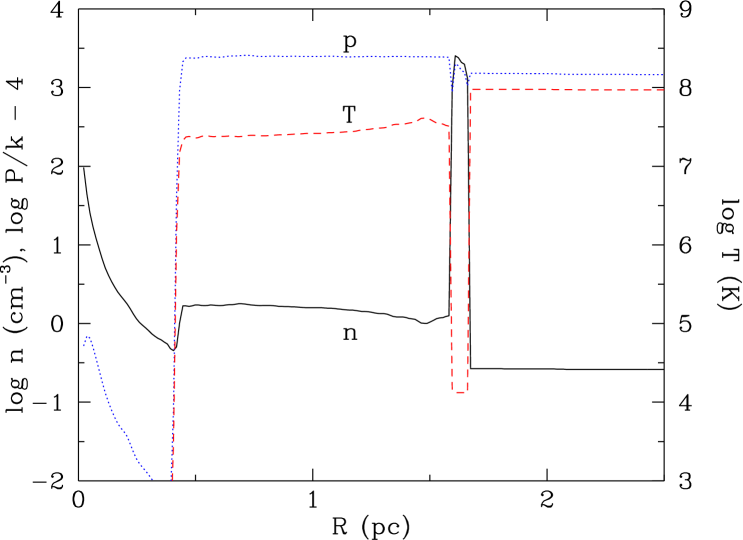
In order to investigate the case where the expansion is stalled by a high interstellar pressure, we have carried out a one dimensional numerical simulation using the VH-1 hydrodynamic code. The full evolution of the wind bubble from the main sequence to the Wolf-Rayet phase has been followed. As a representative case, we use a mass loss history, wind velocity, and duration of the different evolutionary phases typical of that of a 35 star, as calculated by Garcia-Segura, Langer, & MacLow (1996b). The wind velocity in the Wolf-Rayet phase is , and the mass loss rate . For the pressure of the ISM, we take , which is typical of a local starburst sample (Heckman, Armus, & Miley 1990). The density of the ISM is taken to be and the temperature K, but these parameters are not important for the properties of the shocked bubble, as will be explained below. Cooling is included, assuming an equilibrium cooling curve.
In Fig. 1, we show the structure of the wind bubble at the time of the supernova explosion. The most interesting results of this calculation are the dramatic decrease of radius of the termination shock, pc, and the increase in the extent of the constant density bubble, , out to the dense red supergiant shell. These numbers should be compared with pc and , respectively, in the case of a low pressure ISM. Because the pressure in the shocked wind is nearly in equilibrium with the ISM, and the temperature K, the density in the bubble is , independent of the mass loss rate and the ambient density. A large ISM pressure will therefore result in a high value of the density in the shocked bubble. The extent of the constant density region depends on the duration of the WR stage, which varies with mass and metallicity, and the ambient pressure. Considerations based on mass conservation show that
| (19) | |||||
| (20) |
For a star without rotation, the Wolf-Rayet lifetime is found to be yrs at , while it is only yrs at (Maeder & Meynet 1994). The structure of the dense red supergiant shell at 1.7 pc should only be taken as a rough approximation. As the calculations by Garcia-Segura et al. (1996b) show, this region is severely distorted by hydrodynamical instabilities.
3.2 Observed Bursts
Several GRB afterglows have been inferred to be surrounded by constant density regions. The problem is to determine whether these regions are consistent with expectations for a shocked stellar wind. Table 2 lists 4 bursts that have measured redshifts and have been identified as likely to be interacting with a constant density medium. The estimates of the density are from PK02. Harrison et al. (2001) have modeled GRB 000926 and obtained cm-3, in good agreement with PK02. Piro et al. (2001) obtained cm-3 for this source, but their model does not include the radio data. Other sources modeled by PK02 can also be fit by a constant density model, but an wind model can also fit the data. In any case, the densities inferred for GRB 990123 and GRB 000926 span the range for the sources.
The density and pressure in an adiabatic wind bubble (eq. [18]) can be used to obtain the relation in the bubble. The pressure in the bubble can thus be written as , leading to the values of given in column (6) of Table 2. The relatively low value of for GRB 990123 is appropriate for a wind bubble in an interstellar medium with a moderate pressure. This is consistent with the position of GRB 990123 away from the the brightest regions of star formation (Bloom et al. 2002). However, the high pressures inferred for GRB 000301c and GRB 000926 are difficult to reconcile with a plausible pressure expected in an adiabatic wind bubble unless the bursts are occurring in an extreme starburst region. GRB 000301c and GRB 000926 are centrally located in their host galaxies, although not perhaps at the very center (Bloom et al. 2002). Heat conduction gives the possibility of increasing the density and decreasing the temperature of the gas (Weaver et al. 1977). However, we believe that the toroidal magnetic field in the wind is likely to inhibit conduction. In addition, the radiative cooling time for the gas becomes less than the likely evolution time. The cooling time for gas with cm-3 and K is yr; at K, the cooling time is decreased by the lower temperature and the enhanced radiation by CNO ions.
X-ray observations of bubbles around Galactic Wolf-Rayet stars have the potential to shed light on the question of bubble properties. Two bubbles, NGC 6888 (Wrigge et al. 1998) and S308 (Chu et al. 2003), have been detected at present. NGC 6888 shows a hot component ( K) which requires reduced heat conduction, but the component is more limb brightened than expected in standard models (Wigge et al. 1998). The observations indicate some complexities in the bubble structure, but they do not clearly show the nature of the medium occupying most of the volume.
In our scenario, any source with an inferred surrounding density cm-3 is expected to be in an extreme starburst region. Frail et al. (2003) recently modeled the afterglow of GRB 980703 as interaction with a constant density medium with cm-3; a wind model is less likely, although it cannot be ruled out. Berger, Kulkarni, & Frail (2001) found radio emission from the host galaxy of GRB 980703 that implies it is in the class of ultraluminous infrared galaxies, although at the faint end. The burst is near the center of the galaxy in a region of star formation, so a high starburst pressure is possible.
Another constraint on possible surrounding wind structure comes from the fact that the afterglow shock front must reach the termination shock by the time, , that the initial observations used in the model have been made. Column (5) of Table 2 gives estimates of this time for the PK02 models, corrected to the source frame. For an adiabatic wind bubble, the radius of the termination shock can be estimated from eq. (18), yielding cm; the resulting values of for the different densities are given in column (7). An estimate of the time that it takes the shock front to reach depends on energy per unit solid angle of the initial jet propagation before deceleration and spreading. For spherical expansion, the shock radius is
| (21) |
where is the isotropic energy in units ergs and is the age in days (CL00). Column (4) of Table 2 gives an estimate of the initial isotropic energy for the energy and jet angle given by PK02. The requirement that the shock front reach before gives an upper limit on , which is in column (8) of Table 2. It can be seen that the sources with a high estimated pressure have values of in the expected range, but that the value for GRB 990123 is low. For a standard Wolf-Rayet star wind velocity, the mass loss rate must be low in this case in order to accomodate a value of so close to the star.
A final constraint comes from the duration of the afterglow that can be described by spherical expansion in a constant density medium; during this time, the relativistic shock expands as . The maximum initial time of this expansion is and the final time is , which for these sources occurs when jet deceleration and lateral expansion become important. This time is given by Frail et al. (2001) for the sources considered here. The maximum value of the radial range is thus about and is given in column (9) of Table 2. The maximum values are in some cases close to the minimum values that are expected if the Wolf-Rayet wind is expanding into a RSG wind and the external pressure is low, so that some interaction models can be ruled out. The case of a high external pressure can give a more extended shocked bubble, which provides a more suitable region for the constant density expansion.
The above considerations show that there are possible problems with a shocked Wolf-Rayet wind interpretation of the results from GRB afterglow models. The low density and early observations of GRB 990123 require a surprisingly low value for the progenitor mass loss rate, although it is similar to that deduced for GRB 021211. The high densities inferred for GRB 000301c, GRB 000926, and some other bursts imply pressures that are only expected in an extreme starburst region. In addition, the time range of observations suggests a radial range for the shock wave of a factor in radius. Interaction with either the termination shock density jump (factor 4 in density) or the contact discontinuity density jump (factor in density) might be expected in some cases. Wijers (2001) suggested that the bump in optical afterglow of GRB 970508 was due to interaction with the wind termination shock. However, the afterglow evolution before the jump should be steeper or the same as the evolution after the jump; that is not observed for GRB 970508 (e.g., Fruchter et al. 2000). Another explanation for the bump is emission from a collimated flow that is initially directed away from the observer (PK02). In the case of GRB 030226, Dai & Wu (2003) suggested that the apparent increase in flux along with a steepening of the light curve is due to interaction with the contact discontinuity, but the sparse data do not make the case completely clear.
In addition to placing constraints on models with constant density interaction, the shocked wind scenario constrains the free wind models in that the termination shock must lie beyond the region where the free wind model has been applied. Using eqs. (18) and (21), this constraint can be expressed as an upper limit on the pressure surrounding the wind:
| (22) |
where is the time of latest application of the spherical afterglow model in days. In the case of our model for GRB 021211 (, , ), we have . The model requires that the burst did not occur in an intense starburst region. The wind model for GRB 021211 discussed by Kumar & Panaitescu (2003) (, , ) yields , an implausibly small value for the external pressure. Kumar & Panaitescu (2003) argue against the wind model based on the low value of and the high value of ; the inability of the wind to propagate out from the star in their model provides another reason. Kumar & Panaitescu (2003) prefer a constant density model with cm-3; as in the case of GRB 990123, this model will require a low wind density and surrounding pressure, if the constant density region is a shocked wind.
4 LOW DENSITY WINDS AROUND WOLF-RAYET STARS
The observations of GRB afterglows indicate that, in some cases, the densities surrounding the bursts are lower than expected around Wolf-Rayet stars, which are believed to be likely progenitors of the bursts. The observational support for Wolf-Rayet progenitors has come from the identification of GRB 980425, GRB 030329, and possibly GRB 021211 with Type Ic supernovae (Galama et al. 1998; Stanek et al. 2003; Hjorth et al. 2003; Della Valle et al. 2003). The main theoretical argument in their favor is the need to have a compact stellar progenitor in order to get the explosion out from the central engine in an amount of time that is not much longer than the duration of gamma-ray bursts (MacFadyen, Woosley, & Heger 2001; Matzner 2003).
Mass loss rate estimates for Galactic Wolf-Rayet stars have been given by Nugis & Lamers (2000), who find typical mass loss rates and wind velocities . The mass loss rates given by Nugis & Lamers include a correction for clumping, which brings the rates down by a factor of a few compared to the uncorrected values. Of the stars in their list, the one with the lowest wind density is a WO 2 star with and , yielding . The high wind velocity of a compact WO star is a significant part of the low density.
Possible reasons for a significantly lower mass loss density are a metallicity dependence, mass dependence, and azimuthal dependence of the mass loss. Wijers (2001) argued that GRBs occur in low metallicity galaxies so the stars have lower mass loss rates, with . However, WN type Wolf-Rayet stars have been found in the lower metallicity Large Magellanic Cloud (Hamann & Koesterke 2000) and the Small Magellanic Cloud (Crowther 2000) that have mass loss rates that are comparable to Galactic stars. However, in a similar study of WC stars, Crowther et al. (2002) found that the mass loss rates scale as , where is the metal fraction, similar to that found for main sequence stellar winds. The mass loss mechanism for Wolf-Rayet stars is poorly understood. WC stars presumably have comparable amounts of element processing despite different initial conditions. If the mass loss depends on these elements, the dependence on initial metallicity may be small. However, if Fe lines are important, the initial metallicity plays a role.
On evolutionary grounds, Langer (1989) advocated , where is the mass of the Wolf-Rayet star. The stellar mass drops to at the end of its life because of mass loss, so at that time. With this prescription for mass loss, Wolf-Rayet stars are expected to end up in a fairly small final mass range. The mass loss rates of Nubis & Lamers (2000) are a factor lower than those used by Langer, which leads to a larger final mass. However, it is not clear whether the present evidence supports a small final mass range for Wolf-Rayet stars. The mass of ejecta in SN 1998bw is estimated to be , with a presupernova mass of (Nomoto et al. 2001). On the other hand, the mass of ejecta in SN 1994I has been estimated at , with a presupernova mass of (Nomoto et al. 2001). Although there is uncertainty in these estimates, the case for SN 1994I having a considerably lower mass than SN 1998bw is good.
If low progenitor mass is the reason for a low density wind, there should be a relation between the supernova characteristics and the presence of a low density wind, although variations in the explosion energy are another factor in the diversity of supernova properties. A low progenitor mass leads to a fast (rapidly evolving) supernova, as was observed for SN 1994I (Nomoto et al. 2001). The estimated energy for the explosion of SN 1994I is ergs. If the energy were high, ergs as indicated for SN 1998bw (Nomoto et al. 2001), the light curve would be especially fast because the timescale for the lightcurve . In the case of GRB 021211, the evidence for a supernova shows that it is comparable in luminosity and spectrum to SN 1994I and is not bright like SN 1998bw (Della Valle et al. 2003). Unless there is a large compact remnant mass, this implies a low mass progenitor, which is consistent with the low value of deduced for GRB 021211. In the case of SN 2001ke associated with GRB 011121, the supernova is fainter and faster than SN 1998bw (Bloom et al. 2002; Garnavich et al. 2003), intermediate between SN 1998bw and SN 1994I. This argues for an intermediate progenitor mass.
In standard models for GRBs in supernovae, the burst occurs along the stellar rotation axis (e.g., MacFadyen, Woosley, & Heger 2001), so a lower wind density along the polar axis compared to the equatorial region would be observed as a low density interaction. This kind of structure was proposed in a model in which rotation and magnetic fields play a crucial role in the mass loss from Wolf-Rayet stars (Poe, Friend, & Cassinelli 1989; Ignace, Cassinelli, & Bjorkman 1998). In this picture, the radiation pressure-driven mass loss in the polar direction would be comparable to that observed in O stars and would be considerably less than the equatorial mass loss. However, a prediction of this model is polarization of the light in scattering lines, which is not observed in most Wolf-Rayet stars (Harries, Hillier, & Howarth 1998; Kurosawa et al. 1999); in those stars that do show polarization, the required equator:pole density ratio is (Harries et al. 1998). Aspherical winds appear to be unlikely to explain the low values of wind density required for some GRB afterglows.
GRBs may represent only a small fraction () of Wolf-Rayet star deaths, so there is the possibility that they have unusual conditions that are not seen in observed stars. A factor in producing a GRB is thought to be stellar rotation in order to have a rapidly rotating core, so rotation may be a characteristic of the progenitors. The models of Meynet & Maeder (2003) show that the rotational velocities for the Wolf-Rayet stars are likely to be low, , but stars in binary systems may be faster rotators. However, rapid rotation may affect the mass loss in the equatorial plane, but mass loss in the polar direction, which is the direction thought to be relevant to GRB flows, may not be affected.
5 OPTICAL/ULTRAVIOLET ABSORPTION LINES
One of the interesting recent observations of GRB afterglows is the finding that some of them show absorption lines of highly ionized species, blueshifted relative to the host galaxy. The best studied of these is GRB 021004 (Mirabal et al. 2002, 2003b; Salamanca et al. 2002; Saviglio et al. 2002; Schaefer et al. 2003). Mirabal et al. (2003b) find a host redshift of and absorption lines of CIV, SiIV, and Lyman lines at , corresponding to velocities of relative to the host.
Schaefer et al. (2003) and Mirabal et al. (2003b) have discussed the possible origin of the blueshifted features and have both concluded that a circumstellar origin is most likely. There are two possibilities for the velocity structure: the high velocity is representative of the Wolf-Rayet star wind velocity and the lower velocities are representative of shells swept up by the Wolf-Rayet wind, or the absorption features are due to nearby clumps that are radiatively accelerated by the radiation from the GRB. Intermediate situations between these two are also possible. Schaefer et al. (2003) prefer the first interpretation because velocities in the general range of those observed are naturally produced. Mirabal et al. (2003b) argue against this interpretation and for radiative acceleration, based on the abundances in the fast component. H is definitely present; although Wolf-Rayet stars are H poor, some WN stars have H, as do a significant fraction of Type Ib supernovae (Branch et al. 2002). The abundances deduced by Mirabal et al. do not show the overabundance of N expected for a WN, so they conclude against this possibility. However, the abundances are very uncertain, given that only high ionization stages are observed, so this argument may not be conclusive.
In addition to GRB 021004, high excitation, high velocity absorption features have been found in GRB 020813 (Barth et al. 2003) and GRB 030226 (Greiner et al. 2003; Price et al. 2003a; Chornock & Filippenko 2003). The absorption lines of CIV in GRB 020813 are at and (Barth et al. 2003); the system is also present in a [O II] emission line, indicating that this is the redshift of the host galaxy. The system has a velocity of relative to the host. In this case, the blueshifted absorption is also present in a number of lower ionization species (Si II, Al II, Fe II, Mg II, and Mg I); there is no coverage of Ly. In the case of GRB 030226, strong absorption line systems are present at and , with C IV and Si IV present, as well as numerous lower ionization species and Ly. The velocity separation is . The velocity separation seen in these sources is consistent with expectations for the velocity of a Wolf-Rayet star wind. However, the presence of H does not support this origin for the lines.
The main problem with a circumstellar origin for the absorption is the strong ionization by the GRB radiation. Lazzati et al. (2002) estimate that C IV is photoionized around GRB 021004 out to cm, which is larger than the radii at which radiative acceleration would have to occur ( cm). A possible way to regain the C IV is recombination, but the density required to recombine to C IV is cm-3 (Lazzati et al. 2002), which is much larger than the density expected in a Wolf-Rayet star wind ( cm-3). The required degree of clumping in the Wolf-Rayet star wind itself does not seem plausible, but there is the possibility of clumps from the swept up RSG wind. The 2-dimensional simulations of Garcia-Segura et al. (1996b) show that the swept up RSG wind is fragmented and spread over a radial range. The material ends up at a radius of pc in the simulations of Garcia-Segura et al., but the high pressure in a starburst region can keep the RSG wind shell at a relatively small radius. This scenario also has the benefit of providing a high pressure to compress the RSG clumps. With the case , clumps that may be shielded from the Wolf-Rayet star radiation field may have a high enough density for recombination to be important.
Photoionization may also be a problem for line formation in the circumstellar wind, but if the wind is relatively strong, the free wind may extend to cm from the star. If the free wind is the source of the high velocity absorption, there are implications for the afterglow observed from the GRB. The afterglow evolution must be of the wind type over a period of at least days and the wind must be strong enough to sustain a larger termination shock radius. These expectations are borne out for GRB 021004, for which Li & Chevalier (2003) deduced a free wind type model with .
6 DISCUSSION AND CONCLUSIONS
In this paper, we have emphasized some consequences of the hypothesis that all the long duration GRBs have massive star progenitors. Because the massive stars are expected to have their close-in surroundings modified by the progenitor winds, we consider both free winds and shocked winds as possible surrounding media for the afterglow phase. The properties of a shocked wind can be affected by the pressure of the surrounding medium when the pressure is high, as occurs in a starburst region. A number of afterglows have been interpreted in terms of interaction with a constant density medium with density cm-3 (Yost et al. 2003; Frail et al. 2003). Yost et al. note that this density is compatible with that of interstellar clouds or the interclump medium of Galactic molecular clouds. A different interpretation is needed in the massive star progenitor case, and we investigated the possibility that the medium is the shocked wind bubble in a starburst region. The relatively high densities found in some afterglows require that the burst occur in an extreme starburst region. In the case where there is direct interaction of a GRB with the interstellar medium, the interclump medium in a molecular cloud in a starburst region is likely to have a considerably higher density than the densities observed ( cm-3, Chevalier & Fransson 2001). A significant fraction of GRBs must occur in starbursts, so the fact that such high densities have not been observed may be an indication that the surroundings of GRBs have been modified by stellar winds or ionizing radiation.
The fact that there is a substantial number of bursts that require a very high pressure surrounding medium may be a drawback to this scenario, but such sources are likely to be overrepresented in the sample because they are luminous and can be observed in detail. Among the afterglows that can be interpreted as interaction with a free wind, the highest density objects are compatible with expectations for the wind from a typical Galactic Wolf-Rayet star, but the lower densities imply a wind densities that are lower by a factor . Because the density in a shocked wind is higher than that in a free wind at the same radial point, the low density requirement is not alleviated by appealing to a shocked wind. One factor contributing to a low density wind may be a high wind velocity, as appears to occur for WO stars. Other factors that can contribute are a low stellar mass or a low metallicity, although it is not clear whether these factors can provide the low densities that are needed. A related point is that some of the densities deduced around Type Ic supernovae are surprisingly small. For moderately efficient production of synchrotron emission from SN 1998bw and SN 2001ap, the surrounding wind density corresponds to (Li & Chevalier 1999; Berger, Kulkarni, & Chevalier 2002). It is only if the fraction of energy density going into magnetic fields () is small that the value of comes to . At the same time, moderately high values of mass loss from Wolf-Rayet stars are expected in order to obtain compatibility with stellar evolution (e.g., Langer 1989).
We have discussed afterglow models in terms of interaction with either a free wind or a constant density medium. These cases are the simplest for modeling because the dynamical situation can be treated in terms of a self-similar solution. If both of these cases are relevant, there is also the expectation that the GRB blast wave should in some cases be observed to traverse the termination shock wave, which marks the transition between the two types of media. Wijers (2001) has described some of the basic changes that might be expected for this transition, but they have not been clearly observed in any afterglow, which is a point against the general scenario. However, there is a need for more detailed hydrodynamic simulations of this interaction, as well as calculations of the expected emission properties.
| GRB | Reference | |
| 970508 | 0.3,0.39 | CL00,PK02 |
| 991208 | 0.4,0.65 | Li & Chevalier 2001, PK02 |
| 991216 | PK01 | |
| 000301C | 0.45 | Li & Chevalier 2001 |
| 000418 | 0.69 | PK02 |
| 011121 | 0.02 | Price et al. 2002c |
| 020405 | this paper | |
| 021004 | 0.6 | Li & Chevalier 2003 |
| 021211 | , | Kumar & Panaitescu 2003; this paper |
| GRB | ||||||||
|---|---|---|---|---|---|---|---|---|
| cm-3 | (ergs) | days | ( cm) | |||||
| (1) | (2) | (3) | (4) | (5) | (6) | (7) | (8) | (9) |
| 990123 | 1.60 | 0.0019 | 2.2 | 0.07 | 4.6(4) | 28 | 0.0070 | 0.54 |
| 990510 | 1.62 | 0.29 | 0.96 | 0.08 | 7.0(6) | 2.3 | 0.060 | 0.64 |
| 000301c | 2.03 | 27 | 0.11 | 0.17 | 6.5(8) | 0.24 | 0.29 | 0.55 |
| 000926 | 2.07 | 22 | 0.32 | 0.26 | 5.3(8) | 0.26 | 0.55 | 0.86 |
References
- (1) Barth, A. J., et al. 2003, ApJ, 584, L47
- (2) Berger, E., Kulkarni, S. R., & Chevalier, R. A. 2002, ApJ, 577, L5
- (3) Berger, E., Kulkarni, S. R., & Frail, D. A. 2001, ApJ, 560, 652
- (4) Berger, E., Frail, D. A., & Kulkarni, S. R. 2002, GCN 1613
- (5) Berger, E., Soderberg, A. M., Frail, D. A., & Kulkarni, S. R. 2003, ApJ, 587, L5
- (6) Bersier, D., Bloom, J., Challis, P., & Garnavich, P. 2002, GCN 1251
- (7) Bersier, D., et al. 2003, ApJ, 583, L63
- (8) Blandford, R. D., & McKee, C. F. 1976, Phys. Fluids, 19, 1130
- (9) Blitz, L. 1993, in Protostars and Planets III, ed. E. H. Levy and J. I. Lunine (Tucson: Univ. of Arizona), 125
- (10) Bloom, J. S., Kulkarni, S. R., & Djorgovski, S. G. 2002, AJ, 123, 1111
- (11) Bloom, J. S., et al. 1999, Nature, 401, 453
- (12) Bloom, J. S., et al. 2002, ApJ, 572, L45
- (13) Branch, D., et al. 2002, ApJ, 566, 1005
- (14) Campins, H., Rieke, G. H., Lebofsky, M. J. 1985, AJ, 90, 896
- (15) Chevalier, R. A. 2003, in From Twilight to Highlight: the Physics of Supernovae, ed. W. Hillibrandt & B. Leibundgut (Berlin: Springer), p. 299
- (16) Chevalier, R. A., & Clegg, A. W. 1985, Nature, 317, 44
- (17) Chevalier, R. A., & Fransson, C. 2001, ApJ, 558, L27
- (18) Chevalier, R. A., & Imamura, J. N. 1983, ApJ, 270, 554
- (19) Chevalier, R. A., & Li, Z.-Y. 1999, ApJ, 520, L29 (CL99)
- (20) Chevalier, R. A., & Li, Z.-Y. 2000, ApJ, 536, 195 (CL00)
- (21) Chieffi, A., Dominguez, I., Höflich, P., Limongi, M., & Straniero, O. 2003, MNRAS, 345, 111
- (22) Chornock, R., & Filippenko, A. V. 2003, GCN 1897
- (23) Chu, Y.-H., Guerrero, M. A., Gruendl, R. A., Garcia-Segura, G., & Wendker, H. J. 2003, ApJ, in press (astro-ph/0309182)
- (24) Coburn, W., & Boggs, S. E. 2003, Nature, 423, 415
- (25) Crew, G. B., et al. 2003, ApJ, submitted (astro-ph/0303470)
- (26) Crowther, P. A. 2000, A&A, 356, 191
- (27) Crowther, P. A., Dessart, L., Hillier, D. J., Abbott, J. B., & Fullerton, A. W. 2002, A&A, 392, 653
- (28) Dai, Z. G. & Lu, T. 1998, MNRAS, 298, 87
- (29) Dai, Z. G., & Wu, X. F. 2003, ApJ, 591, L21
- (30) Della Valle, M., et al. 2003, A&A, 406, L33
- (31) Fox, D. W., et al. 2003, ApJ, 586, L5
- (32) Frail, D. A., et al. 2001, ApJ, 562, L55
- (33) Frail, D. A., et al. 2003, ApJ, 590, 992
- (34) Fruchter, A. S., et al. 2000, ApJ, 545, 664
- (35) Fruchter, A., Levan, A., Vreeswijk, P., Holland, S. T., & Kouveliotou, C. 2002, GCN 1781
- (36) Fukugita, M., Shimasaku, K., & Ichikawa, T. 1995, PASP, 107, 945
- (37) Galama, T. J., et al. 1998, Nature, 395, 670
- (38) Galama, T. J., et al. 2000, ApJ, 536, 185
- (39) Garcia-Segura, G., MacLow, M.-M., & Langer, N. 1996a, A&A, 305, 229
- (40) Garcia-Segura, G., Langer, N., & MacLow, M.-M. 1996b, A&A, 316, 133
- (41) Garnavich, P., et al. 2003, ApJ, 582, 924
- (42) Granot, J., & Sari, R. 2002, ApJ, 568, 820
- (43) Greiner, J., Guenther, E., Klose, S., & Schwarz, R. 2003, GCN 1886
- (44) Hamann, W.-R., & Koesterke, L. 2000, A&A, 360, 647
- (45) Harries, T. J., Hillier, D. J., & Howarth, I. D. 1998, MNRAS, 296, 1072
- (46) Harrison, F. A., et al. 2001, ApJ, 559, 123
- Heckman, Armus, & Miley (1990) Heckman, T. M., Armus, L. & Miley, G. K. 1990, ApJS, 74, 833
- (48) Hjorth, J., et al. 2003, Nature, 423, 847
- (49) Hurley, K., et al. 2002, GCN 1325
- (50) Ignace, R., Cassinelli, J. P., & Bjorkman, J. E. 1998, ApJ, 505, 910
- (51) Kobayashi, S., & Zhang, B. 2003, ApJ, 582, L75
- (52) Kumar, P., & Panaitescu, A. 2003, preprint (astro-ph/0305466)
- (53) Kurosawa, R., Hillier, D. J., & Schulte-Ladbeck, R. E. 1999, AJ, 118, 539
- (54) Langer, N. 1989, A&A, 220, 135
- (55) Lazzati, D., Rossi, E., Covino, S., Ghisellini, G., & Malesani, D. 2002, A&A, 396, L5
- (56) Li, W., Filippenko, A. V., Chornock, R., & Jha, S. 2003, ApJ, 586, L9
- (57) Li, Z.-Y., & Chevalier, R. A. 1999, ApJ, 526, 716
- (58) Li, Z.-Y., & Chevalier, R. A. 2001, ApJ, 551, 940
- (59) Li, Z.-Y., & Chevalier, R. A. 2003, ApJ, 589, L69
- (60) MacFadyen, A. I., Woosley, S. E., & Heger, A. 2001, ApJ, 550, 410
- (61) Livio, M. & Waxman, E. 2000, ApJ, 538, 187
- Maeder & Meynet (1994) Maeder, A. & Meynet, G. 1994, A&A, 287, 803
- (63) Masetti, N., et al. 2002, GCN 1330
- (64) Masetti, N., Palazzi, E., Simoncelli, A., et al. 2003, A&A, 404, 465
- (65) Matzner, C. D. 2003, MNRAS, 345, 575
- (66) McLeod, B., Caldwell, N., Grav, T., Luhman, K., Garnavich, P., & Stanek, K. Z. 2002, GCN No. 1750
- (67) Mészáros, P., Rees, M. J., & Wijers, R. A. M. J. 1998, ApJ, 499, 301
- (68) Meynet, G., & Maeder, A. 2003, A&A, 404, 975
- (69) Mirabal, N., Halpern, J. P., Chornock, R., & Filippenko, A.V. 2002, GCN 1618
- (70) Mirabal, N., Paerels, F., & Halpern, J. P. 2003a, ApJ, 587, 128
- (71) Mirabal, N., et al. 2003b, ApJ, 595, 935
- (72) Nomoto, K. et al. 2001, in Supernovae and Gamma-Ray Bursts, ed. M. Livio, N. Panagia, & K. Sahu (Cambridge: CUP), p. 144
- (73) Nugis, T., & Lamers, H. J. G. L. M. 2000, A&A, 360, 227
- (74) Panaitescu, A., & Kumar, P. 2001, ApJ, 554, 667
- (75) Panaitescu, A., & Kumar, P. 2002, ApJ, 571, 779 (PK02)
- (76) Pandey, S. B., et al. 2003, A&A, 408, L21
- (77) Park, H. S., Williams, G., & Barthelmy, S. 2002, GCN 1736
- (78) Piro, L., et al. 2001, ApJ, 558, 442
- (79) Poe, C. H., Friend, D. B., & Cassinelli, J. P. 1989, ApJ, 337, 888
- (80) Price, P. A., Schmidt, B. P., & Axelrod, T. S. 2002a, GCN 1326
- (81) Price, P. A., et al. 2002b, GCN 1340
- (82) Price, P. A., et al. 2002c, ApJ, 572, L51
- (83) Price, P. A., Fox, D. W., Djorgovski, S. G., Cote, P., & Jordan, A. 2003a, GCN 1889
- (84) Price, P. A., et al. 2003b, ApJ, 589, 838
- (85) Ramirez-Ruiz, E., Dray, L. M., Madau, P., & Tout, C. A. 2001, MNRAS, 327, 829
- (86) Reichart, D. E. 1999, ApJ, 521, L111
- (87) Salamanca, I., Rol, E., Wijers, R., Ellison, S., Kaper, L., & Tanvir, N. 2002, GCN 1611S
- (88) Sari, R. & Esin, A. 2001, ApJ, 548, 787
- (89) Sari, R. & Piran, T. 1999, ApJ, 517, L109
- (90) Savaglio, S., et al. 2002, GCN 1633
- (91) Schaefer, B. E., et al. 2003, ApJ, 588, 387
- (92) Stanek, K. Z., et al. 2003, ApJ, 591, L17
- (93) Vreeswijk, P., Fruchter, A., Hjorth, J., & Kouveliotou, C. 2002, GCN 1785
- (94) Weaver, R., McCray, R., Castor, J., Shapiro, P., & Moore, R. 1977, ApJ, 218, 377
- (95) Wijers, R. A. M. J. 2001, in 2nd Rome Workshop on GRBs in the Afterglow Era, E. Costa, F. Frontera, & J. Hjorth (Berlin: Springer), 306
- (96) Wozniak, P., et al. 2002, GCN 1757
- (97) Wrigge, M., Chu, Y.-H., Magnier, E. A., & Kamata, Y. 1998, Lecture Notes in Physics, v.506 (Berlin: Springer), 425
- (98) Wu, X. F., Dai, A. G., Huang, Y. F., & Lu, T. 2003, MNRAS, 342, 1131
- (99) Yost, S. A., Harrison, F. A., Sari, R., & Frail, D. A. 2003, ApJ, 597, 459
- (100)
- (101)
- (102)
- (103)