Is There a Missing Galaxy Problem at High Redshift?
Abstract
We study the evolution of the global stellar mass density in a cold dark matter (CDM) universe using two different types of hydrodynamical simulations (Eulerian TVD and SPH) and the analytical model of Hernquist & Springel (2003). We find that the theoretical calculations all predict both a higher stellar mass density at than indicated by current observations, and that the peak of the cosmic star formation rate history should lie at . Such a star formation history implies that as much as (70%, 30%) of the total stellar mass density today must already have formed by . Our results suggest that current observations at are missing as much as 50% of the total stellar mass density in the Universe, perhaps owing to an inadequate allowance for dust obscuration in star-forming galaxies, limited sample sizes, or cosmic variance. We also compare our results with some of the updated semi-analytic models of galaxy formation.
1 Introduction
Is the evidence for high redshift galaxy formation consistent with the concordance CDM model? Recent observational results include the discovery of Extremely Red Objects at (e.g. Elston et al., 1988; McCarthy et al., 1992; Hu & Ridgway, 1994; Cimatti et al., 2003; Smail et al., 2002), Sub-millimeter galaxies at (e.g. Smail et al., 1997; Chapman et al., 2003), Lyman-break galaxies (LBGs) at (e.g. Steidel et al., 1999), and galaxies at either by their Lyman- emission (e.g. Hu et al., 1999; Rhoads & Malhotra, 2001; Taniguchi et al., 2003; Kodaira et al., 2003; Ouchi et al., 2003a) or by their optical to near infrared (IR) colors (e.g. Iwata et al., 2003; Ouchi et al., 2003b; Dickinson et al., 2003b).
Multiband photometry including the near-IR band makes it possible to estimate the stellar mass of these high redshift galaxies by fitting the observed photometric results with artificial galaxy spectra generated by a population synthesis model. Using this technique, several groups have now estimated the stellar mass density in the Universe in the redshift range of (e.g. Brinchmann & Ellis, 2000; Cole et al., 2001; Cohen, 2002; Dickinson et al., 2003a; Fontana et al., 2003; Glazebrook et al., 2004). Rudnick et al. (2003) also estimated the stellar mass density at by combining the estimates of the rest-frame optical luminosity density and the mean cosmic mass-to-light ratio. These observational estimates constrain the evolution of the stellar mass density as a function of redshift or cosmic time.
The observations indicate the presence of a significant stellar population at high redshift, and, by comparing with semi-analytic models of galaxy formation, some authors claim that CDM models seriously underpredict galaxy formation at . For example, Fontana et al. (2003) compare their estimate of from the Hubble Deep Field (HDF) South with the semi-analytic model of Menci et al. (2002), and argue that the high-mass tail of the galaxy stellar mass function is not adequately described by CDM models. Comparing to the same semi-analytic model, Poli et al. (2003) argue that hierarchical models lack sufficient star formation at , resulting in a failure to reproduce the pronounced brightening of the luminosity function at these redshifts. Also, Dickinson et al. (2003a) find that their data from the HDF North suggest a steeper increase in than some semi-analytic models (Kauffmann et al., 1999; Somerville et al., 2001; Cole et al., 2000), and some of the semi-analytic models predict higher stellar mass density compared to their data points. Given these contradicting claims and the large parameter space available to the semi-analytic models as well as the limitations of the current observational samples, it is not clear at present if any of these discrepancies actually pose a serious problem to hierarchical evolution.
In this paper, we compare the observational data with the results from state-of-the-art cosmological simulations of the standard concordance CDM model and the theoretical model of Hernquist & Springel (2003) (hereafter H&S model), to show that, contrary to some of the claims, theory predicts a higher at than indicated by current observations and that the cosmic star formation rate (SFR) density peaks at , earlier than suggested by most semi-analytic models. Also, we will explicitly compare our results with those from the updated semi-analytic models by Somerville et al. (2001), Granato et al. (2000) (GALFORM), and Menci et al. (2002).
2 Simulations
We will show results from two different types of cosmological hydrodynamic simulations. Both approaches include “standard” physics such as radiative cooling/heating, star formation, and supernova (SN) feedback, although the details of the models and the parameter choices differ somewhat.
One set of simulations was performed using an Eulerian approach, which relies on a particle-mesh method for the gravity and the Total Variation Diminishing (TVD) method (Ryu et al., 1993) with a fixed mesh for the hydrodynamics. The treatment of the radiative cooling and heating is described in Cen (1992) in detail. The structure of the code is similar to that of Cen & Ostriker (1992, 1993), but the code has significantly improved over the years with additional input physics. It has been used for a variety of studies, including the evolution of the intergalactic medium (Cen et al., 1994; Cen & Ostriker, 1999a, b), damped Lyman- absorbers (Cen et al., 2003), and galaxy formation (e.g. Cen & Ostriker, 2000; Nagamine, Fukugita, Cen, & Ostriker, 2001a, b; Nagamine, 2002).
Our other simulations were done using the Lagrangian Smoothed Particle Hydrodynamics (SPH) technique. We use an updated version of GADGET (Springel et al., 2001), which uses an ‘entropy conserving’ formulation (Springel & Hernquist, 2002) to mitigate problems with energy/entropy conservation (e.g. Hernquist, 1993) and overcooling. This code also uses a multiphase model of the interstellar medium to describe self-regulated star formation and a phenomenological model for galactic winds (Springel & Hernquist, 2003a). This approach has been used to study the evolution of the cosmic SFR (Springel & Hernquist, 2003b), damped Lyman- absorbers (Nagamine, Springel, & Hernquist, 2004a, b), and galaxies at high redshifts (Nagamine, Springel, Hernquist, & Machacek, 2004).
3 Stellar Mass Density
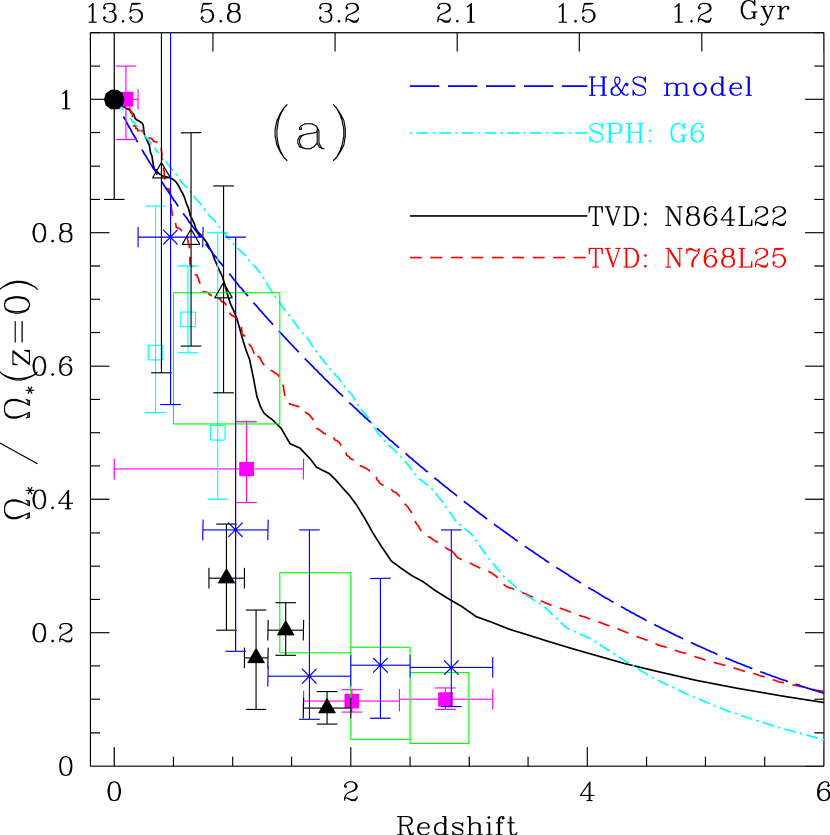
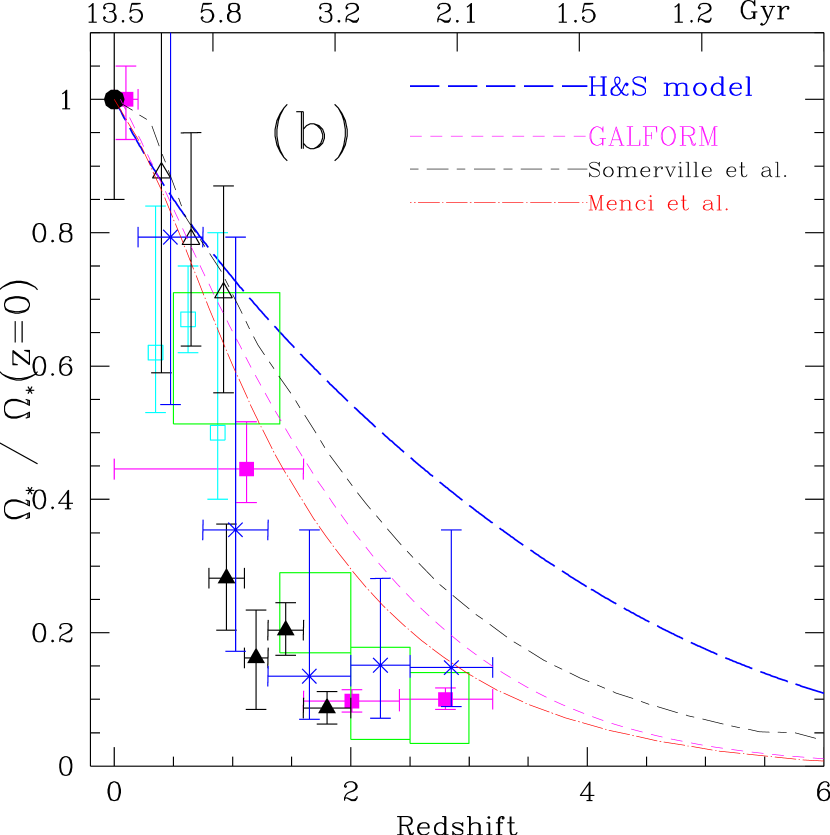
Figure 1 shows the evolution of the global stellar mass density as a function of redshift. Figure 1a compares the simulation results with the observations, and Figure 1b compares the semi-analytic models with the observations. Our results are scaled to unity at (see discussion below). Observational data points are normalized to the local estimate by Cole et al. (2001, filled circle at z=0) following Rudnick et al. (2003). The result of the H&S model shown in both panels is simply the integral of their approximate formula for the SFR which will be given in Equation (1).
For recent epochs (), the computed results are within the range of the observational data. However, the important result here is that at , all the observational estimates (both corrected and uncorrected estimates for the incompleteness of the survey) are smaller than the simulation results by more than a factor of two. The early development of the stellar mass density is much faster in the simulations than is suggested by current observations. As we discuss in Section 4, the larger at originates from a higher SFR at which peaks at in both the TVD and SPH simulations. Such a star formation history implies that about 70% (50, 30, 15%) of the total stellar mass density today must have been in place by (). The contribution to from the star formation at is about 10%.
We note that the data points of Rudnick et al. (2003, magenta filled squares) should be considered as a lower limit, as they did not attempt to make any extrapolations to correct for the incompleteness of their data. On the other hand, Dickinson et al. (2003a, green square boxes) correct for the incompleteness of their data by integrating the Schechter fit with a faint-end slope of down to a fainter magnitude. For the Fontana et al. (2003, blue crosses) data points, we have plotted the values for the SMC extinction case (which yields slightly larger values compared to the Calzetti et al. (2000) extinction), and the upper error bars are extended up to their ‘maximum mass’ estimates. For the Glazebrook et al. (2004, black filled triangles) data points, we plotted the values for the mass limit of which yields largest estimates from their data. We also note that dust extinction is taken into account in the analyses by Brinchmann & Ellis (2000); Dickinson et al. (2003a); Fontana et al. (2003); Glazebrook et al. (2004) by allowing the extinction parameter to vary when fitting the broadband photometric measurements of each galaxy by the spectral energy distribution generated by a population synthesis model. Rudnick et al. (2003) adopt the Calzetti extinction with when deriving the mean mass-to-light ratio from the rest-frame color.
The scaling of the simulation results to the local estimate at leaves us with some concerns, because the relative value of does indeed depend on this scaling. However, some kind of normalization is necessary to compare the results of different numerical models on the same basis, because every numerical model has its input parameters, and what we would like to focus in this paper is the relative speed of the development of from high redshift to the present time. The two TVD simulations in fact yield different values of owing to cosmic variance and differences in the set of cosmological parameters adopted in the simulations: and 0.0052 for N864L22 and N768L25, respectively. The normalization of at in Figure 1 can be partially explained by the scaling of with the baryon mass density in the different simulations. Hernquist & Springel (2003) have shown that scales as from theoretical arguments, and Gardner et al. (2003) found that the amount of cold gas and stars in their SPH simulations follow .
Using the cosmological parameters of the two TVD runs, the scaling gives the expected ratio . The actual corresponding ratio from the two simulations is , which is a reasonable agreement, given other uncertainties, such as cosmic variance. It is expected that the H&S model (blue long-dashed line in Figure 1) should yield the highest at , because it is intended to remove the effects of limited resolution and cosmic variance. Since the results of N864L22 and N768L25 are not corrected for the limited box-size and resolution, it is natural that they lack the earliest star formation at , resulting in a lower at . This is also true of the SPH G6 run which by itself cannot resolve the entire starforming population at . Also, a comparison of the N864L22 and N768L25 results gives an idea of the level of cosmic variance for a volume of , and the deviation of the SPH G6 run from the H&S model is also a consequence of cosmic variance.
Figure 1b compares the results of H&S theoretical model, semi-analytic models of Somerville et al. (2001), Granato et al. (2000), Menci et al. (2002), and observations. The model shown for Somerville et al. (2001) is the updated ‘accelerated quiescent’ model which was also used in Somerville et al. (2004), and follows the merger tree down to halos with circular velocity . The result shown for Menci et al. (2002) is the original model used by Poli et al. (2003) and Fontana et al. (2003) for the comparison to their observational data. Recently Menci et al. (2003) updated their model to include a starburst mode of star formation, which gives a result close to that of GALFORM. The results of the semi-analytic models are somewhat higher than the observational estimates, but within the upper limit of Fontana et al. (2003) data point at . It is also clear that the predicted by the H&S model is higher than that of the two semi-analytic models by about a factor of two. The discrepancy between the models and observations increases at , and is significant at more than 1-.
4 Cosmic Star Formation Rate at
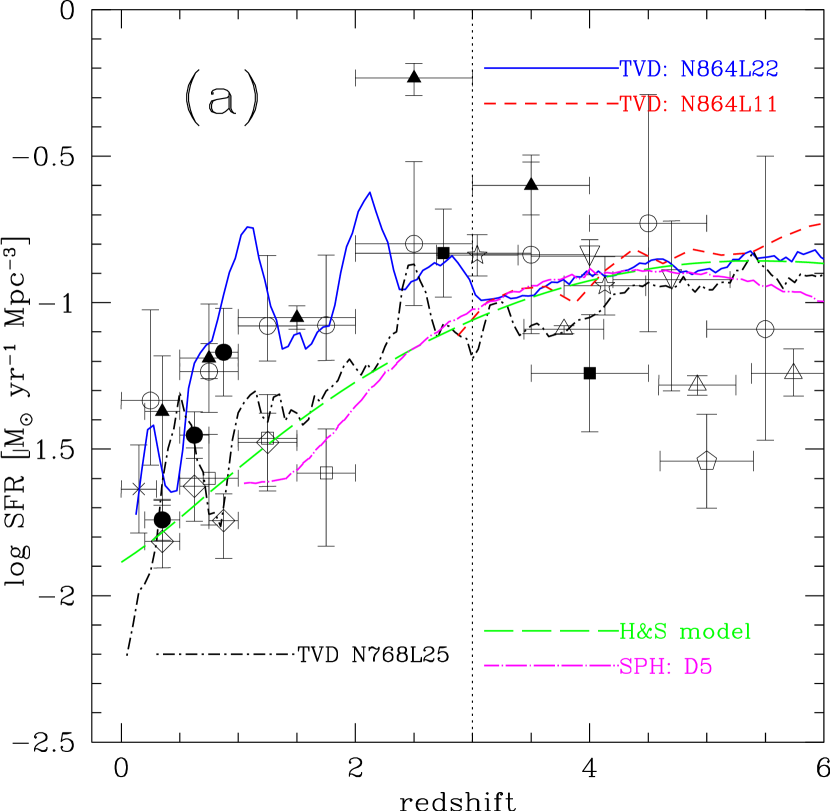
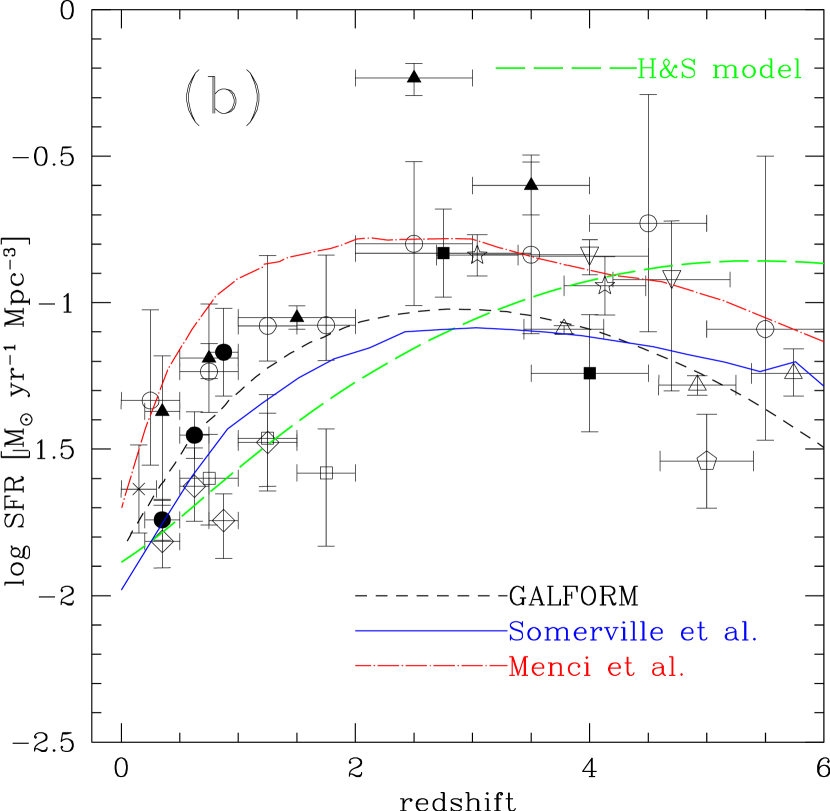
In Figure 2, we show the cosmic SFR density as a function of redshift. Panel (a) shows the simulation results, and panel (b) shows the semi-analytic model results. The simulation results shown in this figure are extracted directly from the runs, without any further adjustments. The H&S model that is shown in both panels has an approximate form as
| (1) |
where . For a CDM universe with the star formation and feedback algorithm described by Springel & Hernquist (2003a), the parameters defining the SFR density take the values , , and . See Section 5 for further discussion on this formula.
The line types and data points are described in the caption. The observationally estimated ultra-violet (UV) luminosity densities have been converted into the SFR by (Madau, Pozzetti, & Dickinson, 1998). The SFR data points are corrected for dust extinction according to a prescription similar to that of Steidel et al. (1999): we assume the highly uncertain extinction correction factors to be 1.3 () and 4.0 (), while Steidel et al. (1999) used higher values 2.7 () and 4.7 ().
It is important to note that each data point has been derived under different assumptions, because the faint-end slope of the luminosity function of galaxies at high redshift is not well constrained and adopting a steeper slope and integrating down to fainter magnitudes would certainly yield a larger UV luminosity density. Here we describe some of the high redshift data points. Steidel et al. (1999, open stars at ) derived their UV luminosity density by integrating the luminosity function with a faint-end slope of down to . For their data points, we read off the SFR from Fig.9, corrected to our flat- cosmology, and applied our extinction correction. Giavalisco et al. (2004, open triangles at ) integrated the Schechter fit with a faint-end slope of down to , where is the characteristic UV luminosity of LBGs at . Iwata et al. (2003, open pentagon at ) integrated their Schechter fit with in the magnitude range of . This integration range was chosen to match with the limiting magnitude of the sample by Steidel et al. (1999) in terms of absolute magnitude, therefore it is expected from the shape of the luminosity function that the resultant UV luminosity density at is times of that at in the same absolute magnitude range, depending on the choice of cosmology and the integration range. For the Ouchi et al. (2003b, inverted open triangles) data points, we show their total UV luminosity density case where the luminosity function with a faint-end slope of is integrated down to .
An important theoretical result here is that all the simulation results and the H&S model peak at , and not at lower redshifts, as is often found in semi-analytic models of galaxy formation (e.g. Baugh et al., 1998; Kauffmann et al., 1999; Cole et al., 2000; Somerville et al., 2001, see panel (b)). Observationally, it is an unsettled problem whether the SFR levels off at high-redshift (e.g. Steidel et al., 1999) or still increases beyond (Lanzetta et al., 2002). In particular, Lanzetta et al. (2002) stress the importance of the cosmological surface dimming effect and argue that previous measurements have missed a significant fraction of the ultraviolet luminosity density of the universe at . The scatter in the data points at is still large, and it is not possible at this time to determine the trend in SFR at these redshifts. However, our point is a theoretical one, and does not depend on the distribution of data points as we detail in Section 5.
In passing, we note that the absolute values of at computed by integrating the SFR curves shown in Fig.2b are 0.0037, 0.0031, 0.0041, and 0.0090 for the models by Hernquist & Springel (2003), Somerville et al. (2001), Granato et al. (2000), and Menci et al. (2002), respectively.
The result of TVD N864L22 at is slightly higher than most of the observational data points and has two large bumps at and 2.0. These two peaks presumably owe to major merger events taking place in the simulation, and are a consequence of cosmic variance in the relatively small box utilized. If we had utilized a larger box, then we would expect the curve to be smooth. Clearly the box-size of is not large enough to accurately model the volume averaged quantities in the universe at .
5 Discussion & Conclusions
We have shown that two independent different types of numerical hydrodynamic simulations both predict that the cosmic star formation rate density should peak at , and that this relatively early peak in the SFR leads to a more rapid development of the stellar mass density than current observational estimates. When all the results are scaled to the local value at , the stellar mass density at in the simulations is larger than observed values by more than a factor of two. We also showed in Figure 1b that the semi-analytic models of Somerville et al. (2001), Granato et al. (2000), and Menci et al. (2002) predict larger than current observational estimates, but within the upper error bar of the Fontana et al. (2003) data point at . In particular, the H&S model predicts higher than those semi-analytic models by about a factor of two at . This comes from the fact that both the simulations and H&S model has a peak of SFR at , whereas the semi-analytic models have a peak at .
The high predicted by our simulations and the model of Hernquist & Springel (2003) suggest that current observations are missing nearly half of the total stellar mass density in the universe at high redshifts. This missing stellar mass could be hidden in a population of red galaxies that have not been detected previously in the optical ground-based data. In fact, Franx et al. (2003) and Daddi et al. (2004) find such a population of red galaxies at in HDF-South that has a volume density half that of LBGs at and a stellar mass density comparable to that of LBGs. However, the data points by Rudnick et al. (2003) include this red galaxy population. Therefore the cosmic variance might be a stronger cause for the underestimate of by the current observations. This is hinted by the absence of this red population in HDF-North. If these red populations are strongly clustered as suggested by Daddi et al. (2003), observations with small fields-of-view could easily miss them. The stellar mass density in the simulations and observations agree reasonably well at where the rate of increase is much slower than at higher redshift. In addition, the dust extinction correction may seriously underestimate the fraction of early star formation that is heavily obscured. If we only had optical UV observations of nearby starburst galaxies – rather than the full spectrum extending to the submillimeter – we would greatly underestimate star formation in these systems (e.g. Hughes et al., 1998; Meurer et al., 1999; Barger et al., 2000; Calzetti et al., 2000; Takagi et al., 2003). Future studies of starforming galaxies in the far-infrared wavelengths (e.g. Kennicutt et al., 2003) using the Spitzer Space Telescope, in the submillimeter (e.g. Tecza et al., 2004), in the millimeter (e.g. Bekki & Shioya, 2000) using the Atacama Large Millimeter Array (ALMA), and in X-rays (e.g. Norman et al., 2004) using the Chandra X-ray Observatory would enable us to constrain the nature of starburst galaxies better, and estimate the intrinsic SFR more accurately.
It is reassuring that the two different sets of simulations, which use very different hydrodynamic methods (i.e. Eulerian TVD and SPH), both give a star formation history that peaks at . As argued by Hernquist & Springel (2003) this is to be expected, because the evolution of the cosmic SFR is driven mainly by a competition between gravity and the expansion of the Universe, with a weaker dependence on the details of star formation and feedback. The form of equation (1) given in Section 4 can be understood as follows. At high redshifts, when the cooling time is short, star formation is limited primarily by the gravitational growth of halos, which is independent of the dissipative gas dynamics. Thus, the parameter and the factor in the exponential of equation (1) are determined by the form of the matter power spectrum, and the description of star formation and feedback enter into only logarithmically. At low redshifts, the supply of star forming gas is limited by the expansion rate of the Universe, fixing the dependence of on as . The explicit influence of the prescription for star formation and feedback is again subdominant and mainly affects the values of the normalization parameters and .
For these reasons, equation (1) can be generalized straightforwardly to other cosmologies and to include other physics (e.g. Yoshida et al., 2003). Moreover, as shown in e.g. figure 6 of Hernquist & Springel (2003), the fact that the SFR density is regulated mainly by the competition between gravity and the expansion of the Universe means that the peak in should lie at , unless an implausible value is adopted for the parameters governing star formation. Hence, it is not surprising that the various sets of simulations should be consistent, with residual differences owing to details in the cosmology and, most important, cosmic variance and resolution limitations. We plan to investigate these issues in the future using the algorithms described here, as well as adaptive mesh refinement codes.
For now, the agreement between our different numerical approaches supports the general arguments made by Hernquist & Springel (2003), that the SFR density should peak at , mostly independent of the details of star formation and feedback. As we have demonstrated here, such an early peak in the cosmic star formation history yields that clearly exceeds current observational estimates and the results of semi-analytic models, suggesting that most of the stars in the universe at are “missing.”
References
- Barger et al. (2000) Barger, A. J., Cowie, L. L., & Richards, E. A. 2000, AJ, 119, 2092
- Baugh et al. (1998) Baugh, C. M., Cole, S., Frenk, C. S., & Lacey, C. G. 1998, ApJ, 498, 504
- Bekki & Shioya (2000) Bekki, K. & Shioya, Y. 2000, PASJ, 52, L57
- Brinchmann & Ellis (2000) Brinchmann, J. & Ellis, R. 2000, ApJ, 536, L77
- Calzetti et al. (2000) Calzetti, D., Armus, L., Bohlin, R. C., Kinney, A. L., Koornneef, J., & Storchi-Bergmann, T. 2000, ApJ, 533, 682
- Cen (1992) Cen, R. 1992, ApJS, 78, 341
- Cen et al. (1994) Cen, R., Miralda-Escude, J., Ostriker, J. P., & Rauch, M. 1994, ApJ, 437, L9
- Cen & Ostriker (1992) Cen, R. & Ostriker, J. P. 1992, ApJ, 399, L113
- Cen & Ostriker (1993) —. 1993, ApJ, 417, 404
- Cen & Ostriker (1999a) —. 1999a, ApJ, 514, 1
- Cen & Ostriker (1999b) —. 1999b, ApJ, 519, L109
- Cen & Ostriker (2000) —. 2000, ApJ, 538, 83
- Cen et al. (2003) Cen, R., Ostriker, J. P., Prochaska, J. X., & Wolfe, A. M. 2003, ApJ, 598, 741
- Chapman et al. (2003) Chapman, S. C., Blain, A. W., Ivison, R. J., & Smail, I. R. 2003, Nature, 422, 695
- Cimatti et al. (2003) Cimatti, A., Daddi, E., Cassata, P., Pignatelli, E., Fasano, G., Vernet, J., Fomalont, E., Kellermann, K., Zamorani, G., Mignoli, M., & et al. 2003, A&A, 412, L1
- Cohen (2002) Cohen, J. G. 2002, ApJ, 567, 672
- Cole et al. (2000) Cole, S., Lacey, C. G., Baugh, C. M., & Frenk, C. S. 2000, MNRAS, 319, 168
- Cole et al. (2001) Cole, S., Norberg, P., Baugh, C. M., Frenk, C. S., Bland-Hawthorn, J., Bridges, T., Cannon, R., Colless, M., Collins, C., Couch, W., & et al. 2001, MNRAS, 326, 255
- Connolly et al. (1997) Connolly, A. J., Szalay, A. S., Dickinson, M. E., SubbaRao, M. U., & Brunner, R. J. 1997, ApJ, 486, L11
- Cowie et al. (1999) Cowie, L. L., Songaila, A., & Barger, A. J. 1999, AJ, 118, 603
- Daddi et al. (2004) Daddi, E., Cimatti, A., Renzini, A., Vernet, J., Conselice, C., Pozzetti, L., Mignoli, M., Tozzi, P., Broadhurst, T., de Serego Alighieri, S., & et al. 2004, ApJ, 600, L127
- Daddi et al. (2003) Daddi, E., Röottgering, H. J. A., Labbe, I., Rudnick, G., Franx, M., Moorwood, A. F. M., Rix, H. W., van der Werf, P. P., & van Dokkum, P. G. 2003, ApJ, 588, 50
- Dickinson et al. (2003a) Dickinson, M., Papovich, C., Ferguson, H., & Budavári, T. 2003a, ApJ, 587, 25
- Dickinson et al. (2003b) Dickinson, M., Stern, D., Giavalisco, M., Ferguson, H. C., Tsvetanov, Z., Chornock, R., Cristiani, S., Dawson, S., Dey, A., Filippenko, A. V., Moustakas, L. A., Nonino, M., Papovich, C., Ravindranath, S., Riess, A., Rosati, P., Spinrad, H., Vanzella, E., & et al. 2003b, ApJ, 600, L99
- Elston et al. (1988) Elston, R., Rieke, G. H., & Rieke, M. 1988, ApJ, 331, L77
- Ferguson et al. (1996) Ferguson, P. M. H. C., Dickinson, E. D., Giavalisco, M., Steidel, C. C., & Fruchter, A. 1996, MNRAS, 283, 1388
- Fontana et al. (2003) Fontana, A., Donnarumma, I., Vanzella, E., Giallongo, E., Menci, N., Nonino, M., Saracco, P., Cristiani, S., D’Odorico, S., Poli, F., & et al. 2003, ApJ, 594, L9
- Franx et al. (2003) Franx, M., Labbe, I., Rudnick, G., van Dokkum, P. G., Daddi, E., Förster, S., Natascha, M., Moorwood, A., Rix, H.-W., Röttgering, H., van de Wel, A., & et al. 2003, ApJ, 587, L79
- Gardner et al. (2003) Gardner, J., Katz, N., Hernquist, L., & Weinberg, D. H. 2003, ApJ, 587, 1
- Giavalisco et al. (2004) Giavalisco, M., Dickinson, M., Ferguson, H. C., Ravindranath, S., Kretchmer, C., Moustakas, L. A., Madau, P., Fall, M., Gardner, J. P., Livio, M., & et al. 2004, ApJ, 600, L103
- Glazebrook et al. (2004) Glazebrook, K., Abraham, R., McCarthy, P., Savaglio, S., Chen, H.-W., Crampton, D., Murowinski, R., Jorgensen, I., Roth, K., Hook, I., Marzke, R., & Carlberg, R. 2004, submitted (astro-ph/0401037)
- Granato et al. (2000) Granato, G. L., Lacey, C. G., Silva, L., Bressan, A., Baugh, C. M., Cole, S., & Frenk, C. S. 2000, ApJ, 542, 710
- Hernquist (1993) Hernquist, L. 1993, ApJ, 404, 717
- Hernquist & Springel (2003) Hernquist, L. & Springel, V. 2003, MNRAS, 341, 1253
- Hu et al. (1999) Hu, E. M., McMahon, R. G., & Cowie, L. L. 1999, ApJ, 522, L9
- Hu & Ridgway (1994) Hu, E. M. & Ridgway, S. E. 1994, AJ, 107, 1303
- Hughes et al. (1998) Hughes, D. H., Serjeant, S., Dunlop, J., Rowan-Robinson, M., Blain, A., Mann, R. G., Ivison, R., Peacock, J., Efstathiou, A., Gear, W., Oliver, S., Lawrence, A., Longair, M., Goldschmidt, P., & Jenness, T. 1998, Nature, 394, 241
- Iwata et al. (2003) Iwata, I., Ohta, K., Tamura, N., Ando, M., Wada, S., Watanabe, C., Akiyama, M., & Aoki, K. 2003, PASJ, 55, 415
- Kauffmann et al. (1999) Kauffmann, G., Colberg, J. M., Diaferio, A., & White, S. D. M. 1999, MNRAS, 303, 188
- Kennicutt et al. (2003) Kennicutt, R. C. J., Armus, L., Bendo, G., Calzetti, D., Dale, D. A., Draine, B. T., Gordon, C. W. E. K. D., Grauer, A. D., Helou, G., Hollenbach, D. J., Jarrett, T. H., Kewley, L. J., Leitherer, C., Li, A., Malhotra, S., Regan, M. W., Rieke, G. H., Rieke, M. J., Roussel, H., Smith, J.-D. T., Thornley, M. D., & Walter, F. 2003, PASP, 115, 928
- Kodaira et al. (2003) Kodaira, K., Taniguchi, Y., Kashikawa, N., Kaifu, N., Ando, H., Karoji, H., Ajiki, M., Akiyama, M., Aoki, K., Doi, M., & et al. 2003, PASJ, 55, L17
- Lanzetta et al. (2002) Lanzetta, K. M., Yahata, N., Pascarelle, S., Chen, H.-W., & Fernández-Soto, A. 2002, ApJ, 570, 492
- Lilly et al. (1996) Lilly, S. J., Fèvre, O. L., Hammer, F., & Crampton, D. 1996, ApJ, 460, L1
- Madau (1997) Madau, P. 1997, in Star Formation Near and Far, ed. S. S. Holt & G. L. Mundy, Vol. 393 (New York: AIP), 481
- Madau et al. (1998) Madau, P., Pozzetti, L., & Dickinson, M. 1998, ApJ, 498, 106
- McCarthy et al. (1992) McCarthy, P. J., Persson, S. E., & West, S. C. 1992, ApJ, 386, 52
- Menci et al. (2002) Menci, N., Cavaliere, A., Fontana, A., Giallongo, E., & Poli, F. 2002, ApJ, 575, 18
- Menci et al. (2003) Menci, N., Cavaliere, A., Fontana, A., Giallongo, E., Poli, F., & Vittorini, V. 2003, ApJ, in press (astro-ph/03011496)
- Meurer et al. (1999) Meurer, G. R., Heckman, T. M., & Calzetti, D. 1999, ApJ, 521, 64
- Nagamine (2002) Nagamine, K. 2002, ApJ, 564, 73
- Nagamine et al. (2001a) Nagamine, K., Fukugita, M., Cen, R., & Ostriker, J. P. 2001a, ApJ, 558, 497
- Nagamine et al. (2001b) —. 2001b, MNRAS, 327, L10
- Nagamine et al. (2004a) Nagamine, K., Springel, V., & Hernquist, L. 2004a, MNRAS, 348, 421
- Nagamine et al. (2004b) —. 2004b, MNRAS, 348, 435
- Nagamine et al. (2004) Nagamine, K., Springel, V., Hernquist, L., & Machacek, M. 2004, MNRAS, 350, 385
- Norman et al. (2004) Norman, C., Ptak, A., Hornschemeier, A., Hasinger, G., Bergeron, J., Comastri, A., Giacconi, R., Gilli, R., Glazebrook, K., Heckman, T., Kewley, L., Ranalli, P., Rosati, P., Szokoly, G., Tozzi, P., Wang, J., Zheng, W., & A. 2004, ApJ, in press (astro-ph/0402140)
- Ouchi et al. (2003a) Ouchi, M., Shimasaku, K., Furusawa, H., Miyazaki, M., Doi, M., Hamabe, M., Hayashino, T., Kimura, M., Kodaira, K., Komiyama, Y., & et al. 2003a, ApJ, 582, 60
- Ouchi et al. (2003b) —. 2003b, ApJ, submitted (astro-ph/0309655)
- Pascarelle et al. (1998) Pascarelle, S. M., Lanzetta, K. M., & Fernandez-Soto, A. 1998, ApJ, 508, L1
- Poli et al. (2003) Poli, F., Giallongo, E., Fontana, A., Menci, N., Zamorani, G., Nonino, M., Saracco, P., Vanzella, E., Donnarumma, I., Salimbeni, S., & et al. 2003, ApJ, 593, L1
- Rhoads & Malhotra (2001) Rhoads, J. E. & Malhotra, S. 2001, ApJ, 563, L5
- Rudnick et al. (2003) Rudnick, G., Rix, H.-W., Franx, M., Labbe, I., Blanton, M., Daddi, E., Förster, S., Natascha, M., Moorwood, A., Röttgering, H., Trujillo, I., & et al. 2003, ApJ, 599, 847
- Ryu et al. (1993) Ryu, D., Ostriker, J. P., Kang, H., & Cen, R. 1993, ApJ, 414, 1
- Sawicki et al. (1997) Sawicki, M. J., Lin, H., & Yee, H. K. C. 1997, AJ, 113, 1
- Smail et al. (1997) Smail, I., Ivision, R. J., & Blain, A. W. 1997, ApJ, 490, L5
- Smail et al. (2002) Smail, I., Owen, F. N., Morrison, G. E., Keel, W. C., Ivison, R. J., & Ledlow, M. J. 2002, ApJ, 581, 844
- Somerville et al. (2004) Somerville, R. S., Moustakas, L. A., Mobasher, B., Gardner, J. P., Cimatti, A., Conselice, C., Daddi, E., Dahlen, T., Dickinson, M., Eisenhardt, P., Lotz, J., Papovich, C., Renzini, A., & Stern, D. 2004, ApJ, 600, L135
- Somerville et al. (2001) Somerville, R. S., Primack, J. R., & Faber, S. M. 2001, MNRAS, 320, 504
- Spergel et al. (2003) Spergel, D., Verde, L., Peiris, H. V., Komatsu, E., Nolta, M. R., Bennett, C. L., Halpern, M., Hinshaw, G., Jarosik, N., Kogut, A., & et al. 2003, ApJS, 148, 175
- Springel & Hernquist (2002) Springel, V. & Hernquist, L. 2002, MNRAS, 333, 649
- Springel & Hernquist (2003a) —. 2003a, MNRAS, 339, 289
- Springel & Hernquist (2003b) —. 2003b, MNRAS, 339, 312
- Springel et al. (2001) Springel, V., Yoshida, N., & White, S. D. M. 2001, New Astronomy, 6, 79
- Steidel et al. (1999) Steidel, C. C., Adelberger, K. L., Giavalisco, M., Dickinson, M., & Pettini, M. 1999, ApJ, 519, 1
- Takagi et al. (2003) Takagi, T., Vansevicius, V., & Arimoto, N. 2003, PASJ, 55, 385
- Taniguchi et al. (2003) Taniguchi, Y., Ajiki, M., Murayama, T., Nagao, T., Veilleux, S., Sanders, D. B., Komiyama, Y., Shioya, Y., Fujita, S., Kakazu, Y., & et al. 2003, ApJ, 585, L97
- Tecza et al. (2004) Tecza, M., Baker, A., Davies, R., Genzel, R., Lehnert, M. D., Eisenhauer, F., Lutz, D., Nesvadba, N., Seitz, S., Tacconi, L. J., Thatte, N. A., Abuter, R., & Bender, R. 2004, ApJ, in press (astro-ph/0403264)
- Treyer et al. (1998) Treyer, M. A., Ellis, R. S., Millard, B., Donas, J., & Bridges, T. J. 1998, MNRAS, 300, 303
- Yoshida et al. (2003) Yoshida, N., Bromm, V., & Hernquist, L. 2003, ApJ, submitted (astro-ph/0310443)
| Run | [] | [] | [] | [] | |
|---|---|---|---|---|---|
| TVD: N864L11a | 11.0 | 12.7 | |||
| TVD: N864L22a | 22.0 | 25.5 | |||
| TVD: N768L25b | 25.0 | 32.6 | |||
| SPH: Q5c | 10.0 | 1.2 | |||
| SPH: D5c | 33.75 | 4.2 | |||
| SPH: G6c | 100.0 | 5.3 |
Note. — Parameters of some of the simulations on which this study is based. The quantities listed are as follows: is the simulation box-size, is the number of the hydrodynamic mesh points for TVD or the number of gas particles for SPH, is the dark matter particle mass, is the mass of the baryonic fluid elements in a grid cell for TVD or the masses of the gas particles in the SPH simulations. Note that the TVD uses () dark matter particles for N864 (N768) runs. is the size of the resolution element (cell size in TVD and gravitational softening length in SPH in comoving coordinates; for proper distances, divide by ). The upper indices on the run names correspond to the following sets of cosmological parameters: for (a), for (b), and for (c).