The Globular Cluster System of NGC 5128 II. Ages, Metallicities, Kinematics, and Formation
Abstract
We present a study of the nearby post-merger giant elliptical galaxy, NGC 5128 (Centaurus A), in which we use the properties of its globular cluster (GC) and planetary nebula (PN) systems to constrain its evolution. Using photometric and spectroscopic data for 215 GCs presented in Paper I, we study trends in age, metallicity, and kinematics for the GC system. We confirm that the GC metallicity distribution is bimodal, and show that these two sub-populations have different properties. Using spectral line index measurements of the brightest clusters, the metal-poor GCs have old ages like the Milky Way globular clusters, while the metal-rich GCs have H line-strengths that could be interpreted as a mean age of Gyr. Both populations appear to have [Mg/Fe] ratios consistent with that of the Galactic GC system, although this quantity is not very well-constrained. The kinematics of the metal-rich GCs are similar to those of the planetary nebulae, exhibiting significant rotation about a misaligned axis, while the metal-poor GCs have a higher velocity dispersion and show a weaker kinematic correlation with the field stars. The total gravitating mass of NGC 5128 derived from the GCs is in excellent agreement with the value derived from stellar (PN) kinematics. We suggest that these and other data support a picture in which the main body of NGC 5128 was formed 3–8 Gyr ago by the dissipational merger of two unequal-mass disk galaxies supplemented by the continual accretion of both gas-rich and gas-poor satellites.
Subject headings:
galaxies: elliptical and lenticular, cD — galaxies: evolution — galaxies: halos — galaxies: individual (NGC 5128) — galaxies: kinematics and dynamics — galaxies: star clusters1. Introduction
The fossil record of old star clusters that is present in nearly every galaxy provides a window onto the vigorous epochs of star formation that mark its evolutionary history. In nearby galaxies ( Mpc), where detailed investigations are possible, globular cluster systems can provide important leverage on the chemical and dynamical history of their hosts and their environment. In spheroidal stellar populations such as elliptical galaxies and bulges, the observed color distributions of globular clusters (GCs) alone require either a significant amount of merging, multiple epochs of star formation (Forbes, Brodie, & Grillmair 1997), or both (Ashman & Zepf 1992). The hierarchical merging that has been invoked to explain these systems can be purely dissipationless (Côté, Marzke, & West 1998), or also involve gaseous bursts of star formation (Beasley et al. 2002)
While much has been learned from the metallicity distributions of these GC systems, relatively little work has been done on their kinematics and their ages. This is mainly because such studies are difficult for a large fraction of nearby galaxies, even with the new generation of 6–10 meter telescopes. These properties, however, offer to extend the power of GC systems as galaxy diagnostics by probing the dynamical states of galactic sub-components, and the time scales on which they formed. Recently, there is evidence that while metal-poor GCs are universally old, the metal-rich GCs in ellipticals can have a large spread in age (Puzia 2002; Larsen et al. 2003). The story told by the few GC systems with substantial kinematic data is less consistent. In general, the metal-poor GC sub-populations have a higher velocity dispersion, but rotation in either population varies on a galaxy-by-galaxy basis (Zepf et al. 2000, Côté et al. 2001, Perrett et al. 2002, Côté et al. 2003).
Globular clusters are in many ways ideal test particles for probing the dynamics of early-type galaxies. While integrated long slit spectroscopy of the galaxy light is limited to due to rapidly declining surface brightness, GCs are essentially unresolved and are easily observed at large distances from the galaxy center. As single-age, single-metallicity entities, GCs also offer the opportunity to correlate age and chemical enrichment with dynamics, providing a powerful probe of galaxy evolution. Moreover, luminous ellipticals can host thousands of GCs, providing ample statistics. Although GCs are often considered ideal tracers of ancient star formation because they are simple stellar populations, they still only make up less than 1% of the light in a typical galaxy. Comparisons to the field star population are essential for any complete picture of galaxy formation.
One of the best galaxies for conducting an in-depth study is the nearby post-merger elliptical NGC 5128 (Centaurus A). At a distance of 3.5 Mpc (Hui et al. 1993), NGC 5128 is the nearest giant elliptical galaxy, and provides a unique opportunity to investigate both the nature of spheroids and the effects of the merging process. In ellipticals, only for NGC 5128 has the metallicity distribution of the field population been determined (W.Harris & G.Harris 2002). Likewise, only a handful of galaxies have both globular cluster and planetary nebula (PN) kinematic data (Romanowsky et al. 2002). In this paper, we present results based on the GC survey described in Paper I (Peng, Ford, & Freeman 2004b). We combine these results with those presented in our survey of planetary nebulae (Peng, Ford, & Freeman 2004a) to try and elucidate the formation history of this interesting and important galaxy.
2. The Colors of NGC 5128 GCs
The optical colors of old GCs are often used as proxies for metallicity. This is because for GCs of similar age, the main property that drives the shape of the spectral energy distribution is metal content. Structure in the GC color distribution is thus taken as a signature of various ancient epochs of metal-enrichment and star formation.
We present multiple color distributions for the NGC 5128 GCs using our broad wavelength coverage. All GC colors have been dereddened using the reddening maps of Schlegel, Finkbeiner, & Davis (1998). Using code made publicly available by David Schlegel, we determined the foreground reddening toward each individual GC. Although the mean reddening is , because we are concerned with the -band, the variations in extinction across two degrees of sky can be significant — they are at the level of 0.1 mag (peak-to-peak) in –. Jablonka et al. (1996) independently measured extinction variations in NGC 5128 that they attributed mainly to the foreground. We made no effort to correct for extinction internal to NGC 5128. Therefore, it is possible that some of the GCs are affected by additional extinction, especially in the inner regions where there is clearly dust. All the results in the following section must be kept with this caveat in mind.

We show the various color histograms for the NGC 5128 GCs. Figure 1 plots four colors that are often used — (U B)0, (B V)0, (–)0, and (–)0. To suppress spurious structure in the histograms, the bin size for each color is the median photometric error. In theory, (–) is not necessarily the best color for stellar population studies, but it has traditionally had the smallest errors as a fraction of the spanned color range for all the optical colors.
All color distributions show clear bimodal structure. This is similar to what was seen previously by Harris et al. (1992, hereafter HGHH92) and Rejkuba (2001), and which has been seen in many other GC systems (e.g. Larsen et al. 2001; Kundu & Whitmore 2001). We use the KMM test (Ashman, Bird, & Zepf 1994) to quantify the degree of bimodality. The KMM test determines the likelihood that a sample is better represented by two (or more) Gaussians rather than by one. We consider only the homoscedastic case (both Gaussians have the same width), as the heteroscedastic case is less well constrained. We also clip the outlier GCs because they adversely skew the distribution — the extreme blue GCs are likely young, and the extreme red GCs may suffer from internal reddening. Using KMM, we find the GC distribution in all colors is very likely bimodal, with values near zero (). The individual and summed sub-distributions can be seen as curves plotted over the histograms in Figure 1. For the colors (U B)0, (B V)0, (–)0, and (–)0, the blue peaks are determined to be at 0.14, 0.71, 0.86, 0.89 mag, and the red peaks are at 0.46, 0.88, 1.35, 1.10 mag, respectively. The widths of the peaks, mag respectively, are close to the values expected if they were dominated by photometric error.
We divided the sample into blue and red GCs based on various criteria, and finally decided on a cut at (–). The extreme blue outliers in (B V) and (–) are likely to be young clusters and not extremely metal-poor. This is supported by the fact that the colors, which are not as sensitive to age, do not show such extreme blue colors for these objects.
3. The GC Radial Distributions
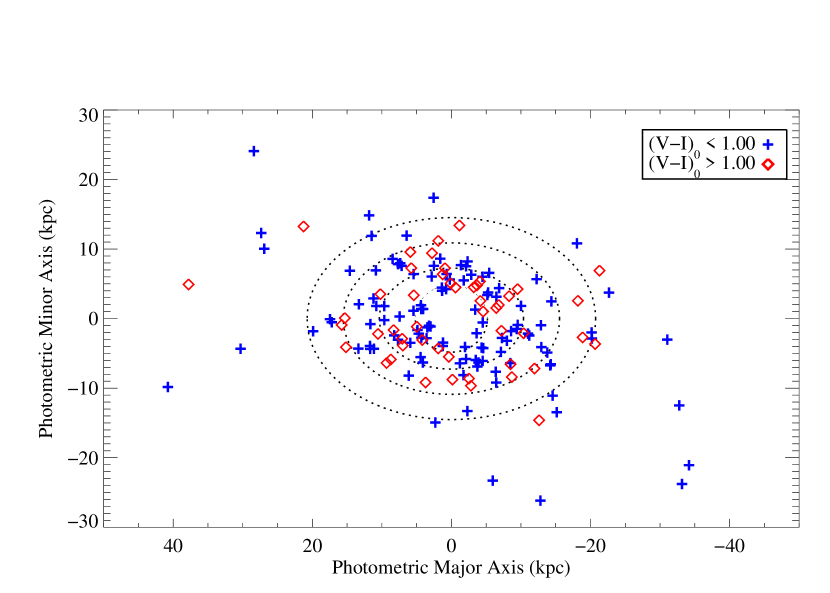
Figure 2 plots the locations of each confirmed GC with respect to the major and minor axes. Another representation of the locations of the GCs are plotted in Peng et al. (2004b), Figure 10. The symbols are coded to represent the blue and red GC populations. Figure 3 shows the approximate radial surface density profiles for the GCs and their blue and red subcomponents. The surface density was computed in circular annular bins, and fit with a de Vaucouleurs profile. While the galaxy is obviously non-circular, especially in the halo, the ellipticity of the GC system is not well-determined, and so we have assumed the simplest case.

We do not correct for incompleteness or selection biases. Because of our requirement that GCs must be spectroscopically confirmed, the selection function for our sample is quite complicated. However, to first order, we assume that these biases do not vary strongly as a function of radius except for in the very inner regions. Incompleteness is a problem in the center due to the complex structure of the dust lane and the bright background from the galaxy. These bins show a drop-off in surface density (where we would expect it be rising), and are ignored for the purposes of fitting the profile.

The profile of the entire GC population is well fit by a de Vaucouleurs law. Also overplotted are the fitted profiles to the red and blue sub-populations. The slope of the red population is formally steeper (more centrally concentrated) than that of the blue population. However, a more detailed treatment may confirm or reject this spatial dichotomy, considering our simplistic assumptions. Investigations in other ellipticals (e.g. Geisler, Lee, & Kim 1996; Neilsen, Tsvetanov, & Ford 1997) show that the red populations are typically more centrally concentrated that the blue, and that these dual spatial scales are the driving reason behind metallicity gradients seen in GC systems as a whole. We show this more clearly in Figure 4 where we plot the (–)0 color versus the projected radius. Nearly all of the GCs beyond 25 kpc are in the blue sub-population. This is partially because there are more blue GCs in general, and so they are statistically more likely to be present in the outer regions. The three lines represent the kernel smoothed (–)0 color as a function of radius. There is a slight color gradient in the overall population, but the blue and red populations individually show flat color profiles. This is similar to the case of Galactic GCs, for which there is no significant gradient in metallicity for either bulge/disk or halo clusters.
4. Relative Metallicities and Ages
Massive star clusters form during episodes of moderate to intense star formation in a galaxy (e.g. Larsen & Richtler 1999). Because larger numbers of massive clusters form in more massive starbursts (Whitmore 2000), the population of surviving clusters which eventually become GCs should trace their host galaxy’s major epochs of star formation. As discrete, identifiable collections of stars with a single age and metallicity, these clusters are also the simplest stellar populations to model. Together, these properties offer the hope that the study of GC systems will ultimately help reveal the star formation and metal enrichment history of galaxies. In this section, we attempt to derive physical quantities from the observables by comparison to evolutionary synthesis models.
4.1. Photometry
Despite the relative simplicity of GCs with respect to the integrated stellar light of an entire galaxy, disentangling the effects of age and metallicity on observed properties is still difficult. Modelers can calculate the photometric and spectroscopic evolution of simple stellar populations as a function of age for different metallicities (e.g. Bruzual & Charlot 1993, Vazdekis 1999, Yi et al. 2001). Examples of these age-metallicity grids in color-color space are taken from the 2001 release of the Bruzual & Charlot models (BC01). Unfortunately, there is a severe and well-known degeneracy between age and metallicity effects in colors for stellar populations older than 1–2 Gyr. However, as Yi (2003) has pointed out, the addition of information in the -band makes optical colors somewhat less prone to this degeneracy, at least at low metallicities.
The utility of observations is offset by the difficulty in obtaining deep and accurate -band photometry. Atmospheric extinction and the rapid loss of sensitivity of current astronomical detectors at shorter wavelengths makes precise band measurements notoriously difficult. Much of the ground-breaking work on GC systems in the 1990s was done with on elliptical galaxies at distances greater than 10 Mpc. Unfortunately, the relatively low response of the WFPC2 detectors in the blue and near-ultraviolet required most work to be done in the and (or equivalent) bandpasses. Moreover, these galaxies are too distant for ground-based 4-meter class telescopes. Recently, though, Rejkuba (2001) obtained and photometry of two fields in NGC 5128 using the 8-meter VLT and used the -band’s sensitivity to metallicity. Jordán et al. (2002) obtained Strömgren u photometry of M87 GCs and used it in conjunction with other filters to constrain the relative ages of the metal-rich and metal-poor GC populations. Whitlock, Forbes, & Beasley (2003) also took observations of GCs in NGC 3379, comparing colors to model grids. However, photometry is still relatively rare and the large number of confirmed NGC 5128 GCs makes our data set interesting.
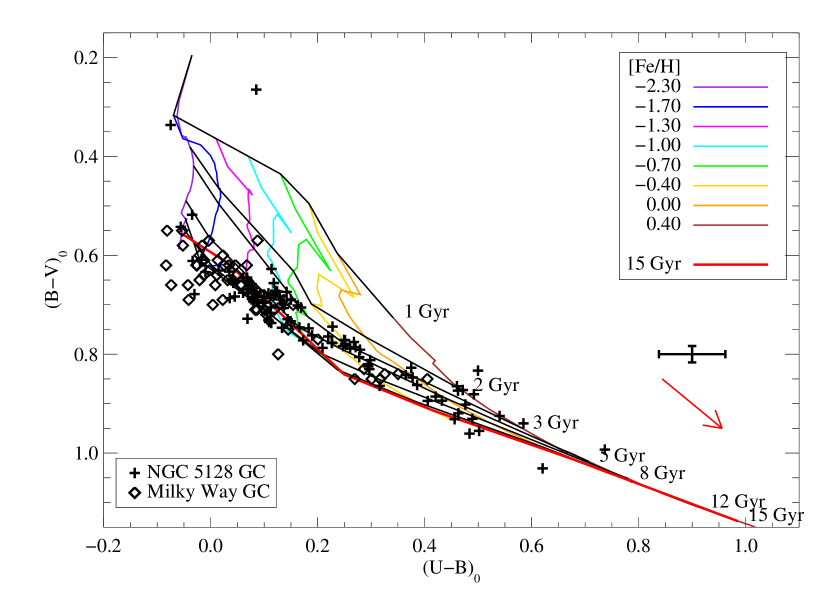
For the purposes of this paper, we simply compare the colors of the NGC 5128 GCs to Milky Way clusters, and to the BC01 model grids in order to explore global trends in age and metallicity. We defer a detailed discussion of the use of colors to derive ages and metallicities to another paper (Yi et al. 2003). In Figure 5, we show the colors of 105 NGC 5128 GCs with respect to the dereddened colors of the Milky Way GCs (W.Harris 1996) and the BC01 grid (we have also compared to the UBV grids of Maraston (2003, in prep), but the differences between the two sets of models are not important for our purposes). Those plotted are NGC 5128 GCs with mag and Galactic GCs with . A caveat is that both of these cuts are slightly biased against the most metal-rich GCs. In NGC 5128, these clusters have the reddest U B colors and so will have fainter magnitudes for a fixed . In the Galaxy, the more metal-rich clusters are preferentially toward the bulge, and so will have higher reddening. We know from color-magnitude diagrams (CMDs) of Galactic GCs that these clusters have a large range in metallicity but are all older than Gyr, a result generally reproduced by the model grids.
Figure 5 shows that our photometry is precise enough to make comparisons to both the models and the Galactic GCs at the metal-poor end. The metal-poor clusters in NGC 5128, toward the left of the diagram, are consistent with being as old as the metal-poor Milky Way GCs. These GCs also happen to fall on the 12–15 Gyr tracks in the BC01 models. Unfortunately, at low metallicity this age is degenerate with younger ages because of the contribution of blue horizontal branch stars to the broadband colors. However, we know independently that the metal-poor Galactic GCs with these colors are closer to 15 Gyr in age than to 5 Gyr so it is likely that NGC 5128 clusters with these colors are also old. These GCs are well-separated from two clusters that are much younger than the rest, with ages Gyr. These younger clusters are HGHH-G279, with (B V), and pff_gc-029, with (B V). Held et al. (1997) spectroscopically determined that HGHH-G279 may be young. Also, the youngest of these star clusters (pff_gc-029) belongs to the young blue tidal stream described in Peng, Ford, Freeman & White (2002).
At the metal-rich end, however, we are handicapped by the increasing degeneracy between age and metallicity, and also by the lack of Galactic GCs with low reddening. According to the grids alone, the locus of NGC 5128 GCs appear to be above the 12 and 15 Gyr isochrones, but the few Galactic GCs in this range appear to occupy a similar locus. Given the errors in photometry and reddening, we conclude that our photometry has only weak leverage on the ages of the metal-rich GCs. For a more definitive answer, we require spectroscopy.
4.2. Spectral Line Indices
While the signal-to-noise for broadband photometry is much higher than for spectroscopy, the low spectral resolution limits astronomers to studying trends in the shape of the spectral energy distribution. Spectroscopy is a complementary approach that permits the measurement of individual spectral features that are sensitive to temperature and elemental abundances. Because each cluster in our sample was required to have a measured radial velocity to be included in our catalog, we are fortunate to have spectra for most NGC 5128 GCs. For the brighter GCs, the measurement of line indices provides a test independent of our photometry for the relative ages of the GC sub-populations.
We use the Lick/IDS system of optical spectral line indices defined by Worthey et al. (1994) and Worthy & Ottaviani (1997). These indices cover many important metal and Balmer lines in the blue half of the optical spectrum. These authors and others have combined the original Lick/IDS stellar spectra using models for stellar evolution to produce model spectra of integrated stellar populations. By comparing index measurements in our spectra to the model grids for an instantaneous burst of star formation at different ages and metallicities, we hope to constrain these quantities in the NGC 5128 GCs.
4.2.1 Transforming to the Lick/IDS System
Before making this comparison, it is important to prepare the spectra properly and place the measurements on the Lick system. All GC spectra had any underlying galaxy light subtracted (see discussion in Peng et al. 2004b). The median level of galaxy light contamination is 11%, and this subtraction is only important for a few extreme cases. For the purpose of matching the Lick/IDS system, we observed five standard stars HD140283, HR5196, HD64606, HR5568, HR2574. These stars span a range of metallicity and effective temperature . HD140283 was observed twice, each time through a different fiber. We de-redshifted these stars to the rest-frame using velocities listed in SIMBAD. The original Lick/IDS stars were observed at a resolution of 8–11 Å between 4000-6000Å, so we smoothed our spectra with a variable-width Gaussian kernel to match the resolution given in Worthey & Ottaviani (1997).
By comparing our index measurements for these stars with the measurements of Worthey et al. , we derived offsets for each line index that could then be applied to our CTIO/Hydra measurements. This comparison is shown for six indices in Figure 6.

4.2.2 Line Index Measurements: Age and Metallicity
For each GC spectrum, we measured all of the line indices from Worthey et al. (1994) and Worthey & Ottaviani (1997). We confine our discussion to a few of the indices that are most useful. As has been discussed extensively in the literature by these and other authors, the age-metallicity degeneracy also plagues optical spectroscopic work. However, it is possible to somewhat disentangle these two, albeit to a relatively low precision, using lines that are more sensitive to either age or metallicity. We use the index defined by Thomas, Maraston, & Bender (2003; hereafter TMB03) as our primary metallicity indicator. This index is a modified version of the one described by González (1993) and is defined as . By combining an alpha-element (Mg) with iron, this index is insensitive to the effects of alpha-enhancement when using the TMB03 models. As our primary age index, we use H, the Balmer line with the highest signal-to-noise, although we also show results for the H index, which some have argued may be a better age indicator (e.g. Vazdekis & Arimoto 1999, Puzia et al. 2002).
In Figures 7 and 8, we compare our measurements with the model grids of TMB03 and in the latter, to the Galactic GC observations of Cohen, Blakeslee, & Ryzhov (1998, CBR98). For the TMB03 grids, we choose the models with canonical mass-loss on the RGB (blue horizontal branches). When comparing this model grid with the BC01 grid in Figure 5, one can see how the effects of age and metallicity, while still covariant, are much less entangled when using spectral index measurements than they are with optical broadband colors.
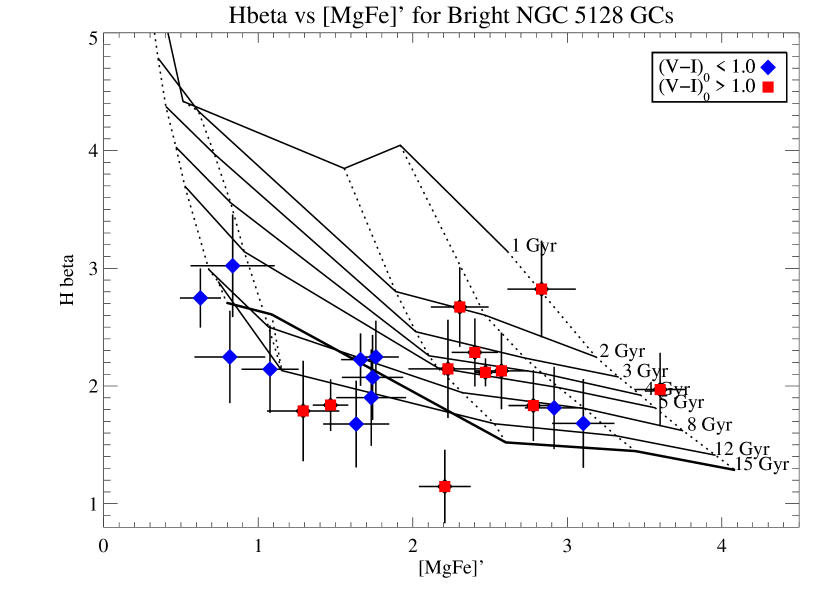
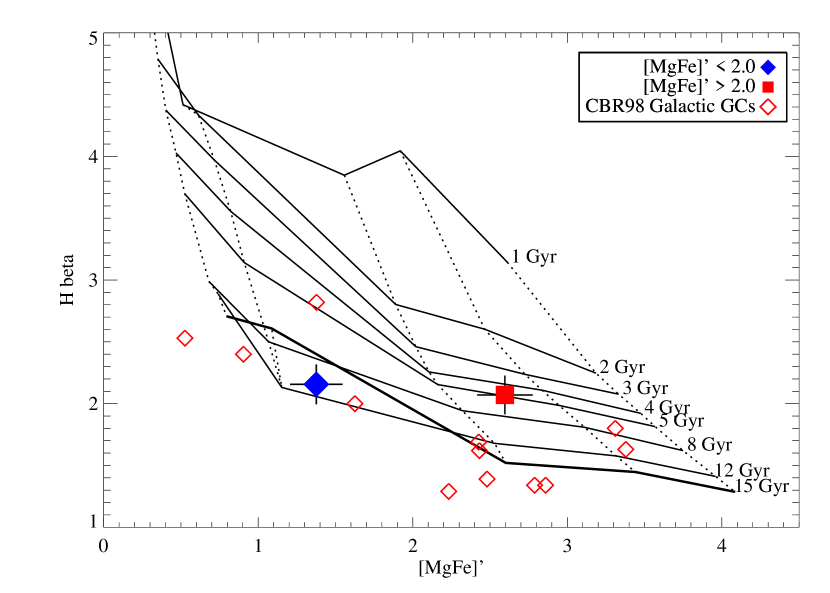
Figure 7 shows H and index measurements for all GCs with CTIO/Hydra spectra that have a signal-to-noise (S/N) per resolution element in the Lick H bandpass. This roughly corresponds to errors of , and . Errors were determined using counting statistics and read noise in the original spectra. They do not incorporate systematic errors that may be inherent to our transformation to the Lick/IDS system.
In this figure, the points are coded by their (–)0 color in order to provide a visual aid for comparison between our photometry and spectroscopy. As expected, the broadband color correlates with metallicity — while mixing between the two groups is unavoidable given the overlapping nature of the two distributions, the blue GCs are generally metal-poor and the red GCs are metal-rich. The metal-poor clusters are consistent with being a universally old population (8–15 Gyr old). The metal-rich GCs, however, appear to have a large spread in ages from 1–10 Gyr, with the bulk of them being significantly young. In fact, of the metal-rich GCs with line index measurements, only one-third have derived ages older than 8 Gyr.
To determine the mean ages of these populations, we created two composite spectra in bins of , dividing at a value of 2. This is slightly more precise than dividing by (–)0, achieving the same effect. Each one of these composites is the sum of all the high S/N spectra in that metallicity bin. The composite spectra are plotted in Figure 9. The metal lines, especially Mg and Fe are stronger in the metal-rich composite, but H is of comparable strength in both spectra.

We measured the same indices for these composites and plot their values in Figure 8. The 1-sigma errors here are a combination of both random errors and systematic errors, the latter of which are from the transformation to the Lick/IDS system. The random errors, as determined from the bootstrap, are comparable to the size of the data points. The systematic errors are dominant, and were determined by the scatter about the mean offset value for the observed standard stars. Also overplotted in this panel are the Lick index values for a few Galactic GCs as measured by CBR98. Again, while the metal-poor GCs in NGC 5128 are consistent with the old ages of the Galactic GCs, the more metal-rich NGC 5128 GCs are younger than their Galactic counterparts. We see the same trend when we measure the H index, both on individual spectra and the composites. This can be seen in Figure 10.

There is an age degeneracy at old ages for metal-poor GCs due to the contribution of flux from blue horizontal branch stars. Whichever way we break this degeneracy, the metal-poor clusters are old, with ages of 10 or 13 Gyr with an error of Gyr. The metal-poor composite also has [m/H]. The metal-rich composite has an age of Gyr, with [m/H]. Regardless of the age degeneracy at low metallicities, the metal-rich clusters appear significantly younger (by 5–8 Gyr) than their metal-poor counterparts.
One caveat that must be mentioned is that old GCs with prominent blue horizontal branches (BHBs) can have spectra that mimic those of intermediate-age stellar populations. For metal-poor GCs, this causes a degeneracy at old ages. It is also possible that strong Balmer line strengths in metal-rich GCs can be explained by a significant number of BHB stars (e.g. Peterson et al. 2003). Both de Freitas Pacheco & Barbuy (1995) and Beasley, Hoyle, & Sharples (2002) show that blue horizontal branches can enhance H line strengths by up to 1.0Å. However, it is unlikely that all of the metal-rich GCs are “second parameter” clusters, although it would certainly be interesting if that were the case. Moreover, a few of the very youngest clusters, such as the one discussed in Peng et al. (2002), have H line strengths that are too high to be fully explained by a BHB contribution to a Gyr old population.
As with all comparisons to model grids, these ages are to be trusted more in a relative sense rather than an absolute sense. Only the plots involving composite spectra include the errors in the Lick/IDS stars, and none include errors in the model grids. It is also possible that by limiting ourselves to bright GCs, we are biasing ourselves in favor of younger clusters. Despite these caveats, our spectroscopy shows that H is systematically stronger in the metal-rich GCs. This is strongly suggestive that there is an age difference between the metal-poor and metal-rich GCs, and also that the metal-rich GCs are consistently younger than the Galactic GCs.
If the metal-rich GCs are of intermediate age, then they should be more luminous than if they were the same age as Galactic GCs. Should we expect to see exceptionally bright metal-rich GCs in NGC 5128? Metallicity, however, plays a competing role with age in that a metal-rich cluster of the same mass as a metal-poor counterpart will be intrinsically fainter. The result is that the BC01 models predict the turnover magnitude of the luminosity function for an intermediate-age metal-rich GC population with (–) to be only mag brighter in than for a metal-poor population with (–). The turnover magnitudes for the two populations in should be nearly identical. Unfortunately, our spectroscopy does not go sufficiently past the turnover of the GC luminosity function to determine the turnover magnitude for either population. However, within the sampled magnitude range, the distribution of GC brightnesses is similar, which is consistent with the age distribution we see.
4.2.3 Line Index Measurements: Alpha-Element Enhancement
The abundance ratio of alpha-elements to iron can shed light on the duration of the star-forming event that created the observed stars. This is because alpha-elements are preferentially created in Type II supernovae whose progenitors are massive stars. Thus, alpha-elements such as Mg and O primarily enrich the local interstellar medium (ISM) in the early stages of a star-forming event. Type I supernovae, which preferentially produce iron, have low-mass progenitors (white dwarf–red giant pairs) that take at least 1 Gyr to inject their metals into the ISM. The result is that stars created in short bursts are likely to be enhanced in alpha-elements. Stars that formed in more prolonged star-forming events, or those that formed out of gas pre-enriched with iron, will not have alpha-enhanced elemental abundances. Varying levels of alpha-enhancement can also mean that the initial mass function of stars was different for different stellar populations.


We attempt to constrain the level of alpha-element enhancement in the NGC 5128 GCs. TMB03 calculated Lick indices for different levels of alpha-enhancement. While these models are among the best available for alpha/Fe analysis, one caveat is that they are poorly calibrated at young and intermediate ages because they are matched to the Galactic bulge GCs. We use the Mg2 and combined Fe indices (where ) to compare alpha-element and iron abundances. Figure 11 shows the TMB03 tracks for [0.3, 0.0, +0.3, +0.5] where is the solar ratio by definition and is represented by the solid line in both panels. Figure 11 plots the bright (S/N) NGC 5128 GCs and the CBR98 Galactic GCs on the TMB03 grid. The Galactic GCs are known (from spectroscopy of individual stars) to be generally enhanced in -elements (e.g. Habgood 2001) with Fe. This is shown in this comparison to the TMB03 models by their offset from the solar value. In the mean, all NGC 5128 GCs are consistent with having the same Fe enhancement as the Galactic GCs. This is shown more clearly in Figure 12, where the indices have been measure on the composite GC spectra. As seen by the errors in this figure, which include both random and systematic errors, this conclusion is sensitive to the transformation used to place our measurements on the Lick/IDS system. As with the other composite measurements, systematic errors dominate the random errors. The same trends are evident when the Mgb index is used to trace magnesium, as is seen in Figure 13. The fact that these two indices give similar results is reassuring because the Mgb index spans a smaller range of the spectrum than the Mg2 index, and is thus less likely to be affected by errors in the transformation. Going beyond measuring gross trends and determining the distribution of Fe values will require much higher quality data.

5. Globular Cluster Kinematics
The space motions of stars and star clusters in a galaxy provide another window on the environment in which they formed. Unlike gas, which radiates energy in inelastic collisional encounters, stars and clusters can be treated as collisionless particles. Because of this, they retain for a much longer period of time the space motions of the gas out of which they formed. This allows us to use their kinematics, not only as tracers of the larger galactic gravitational potential, but as a probe of their dynamical history. In particular, the amount of angular momentum in a given population may be an important clue to uncovering the nature of its progenitors. By adding a larger environmental context to the historical record, kinematic data complements formation timescales and local metal content that we have derived from their spectral energy distributions.
NGC 5128 is much too far away to measure proper motions of individual objects, but we can measure the doppler line-of-sight velocity to obtain kinematic information in one dimension. Since our catalog is velocity-selected—we require that an object have a radial velocity of km s-1 in order to be considered a GC—a kinematic analysis is a natural product of our survey. A comparison of GC kinematics to PN kinematics has only been done for a handful of galaxies. This is a potentially valuable comparison as it can help determine whether the GCs, or some subset of them, share a common formation history with the bulk of the stars in the galaxy.
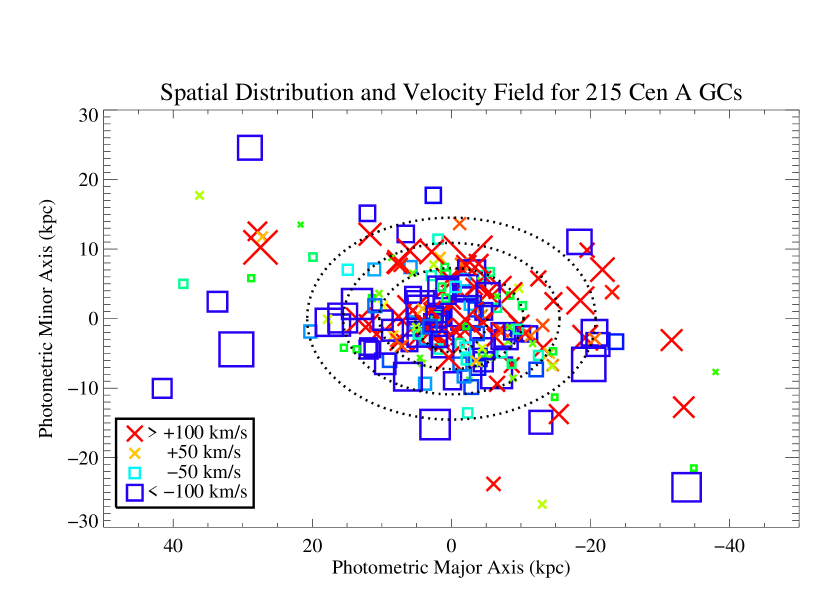
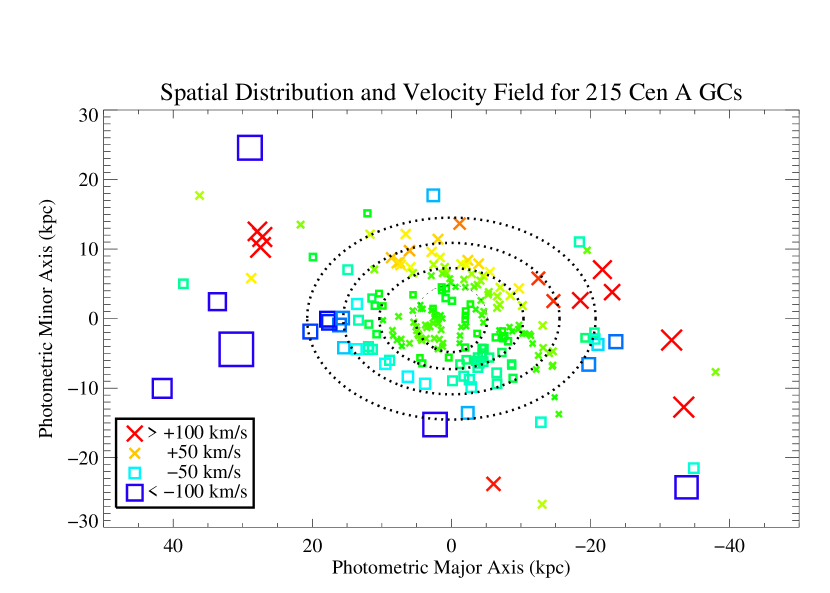
Figure 14 shows the GC velocity field. The large velocity dispersion of the GC system makes it hard to see any ordered motion. This is made more clear in Figure 15 where the velocity field is smoothed with a Gaussian kernel ( kpc). In this smoothed velocity field, the GC system shows a clear sign of rotation outside of kpc. The rotation is around both the major and minor axes, in a similar sense as we see for the PNe.
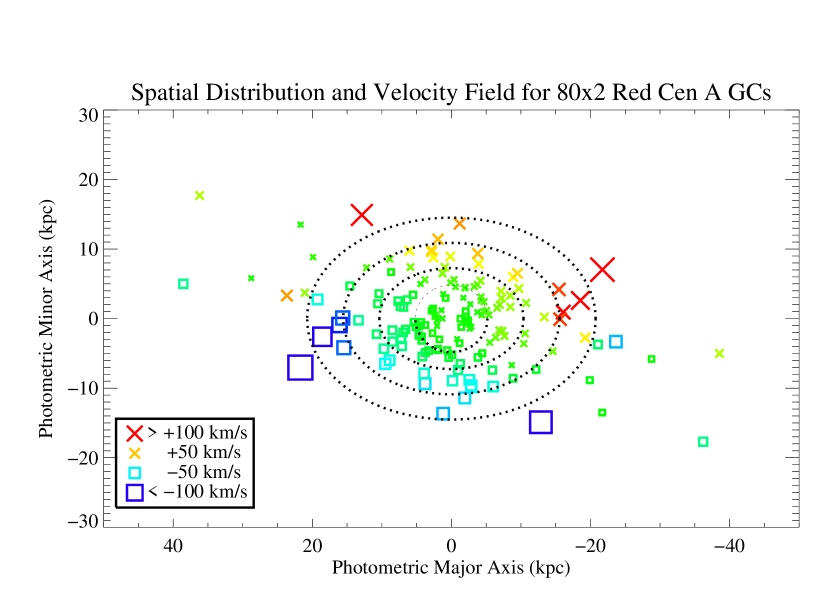
As we have done before, we can also divide the sample into red and blue GCs. The kinematics of these sub-populations are shown in Figures 16 and 17 in the same format (actual velocities and smoothed velocities) as in Figure 14. The median velocities of the two are almost identical at 539 km s-1 for the blue GCs and 542 km s-1 for the red GCs, both of which agree with the assumed systemic velocity of 541 km s-1. Both fields are also roughly symmetric through the origin, rejecting the null hypothesis at the level.
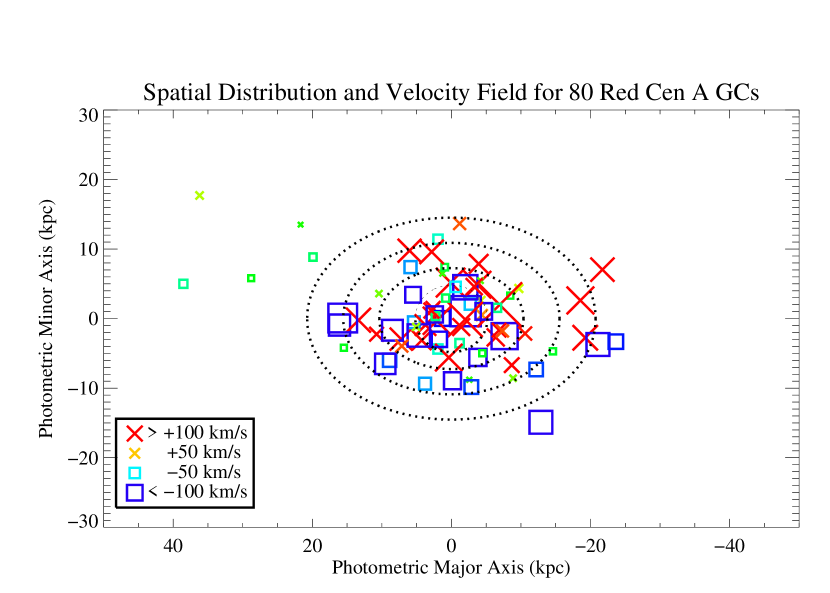
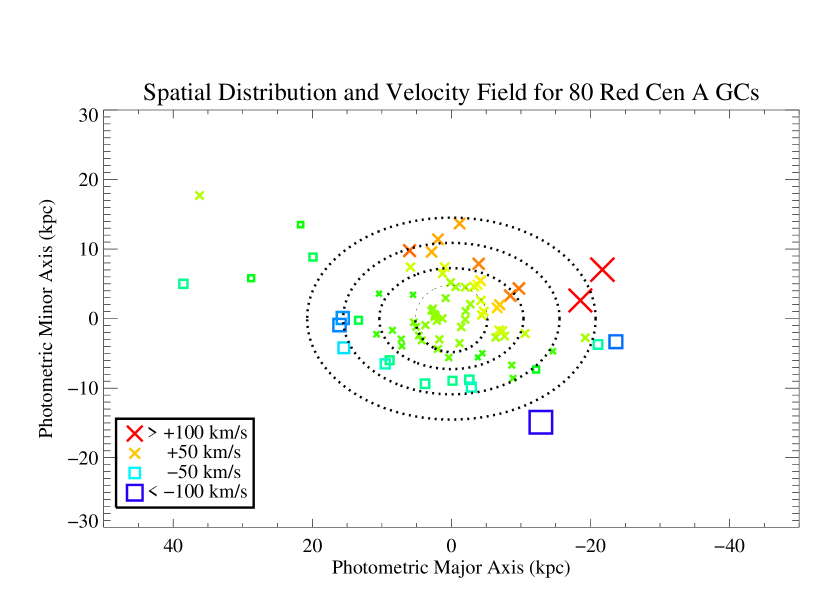
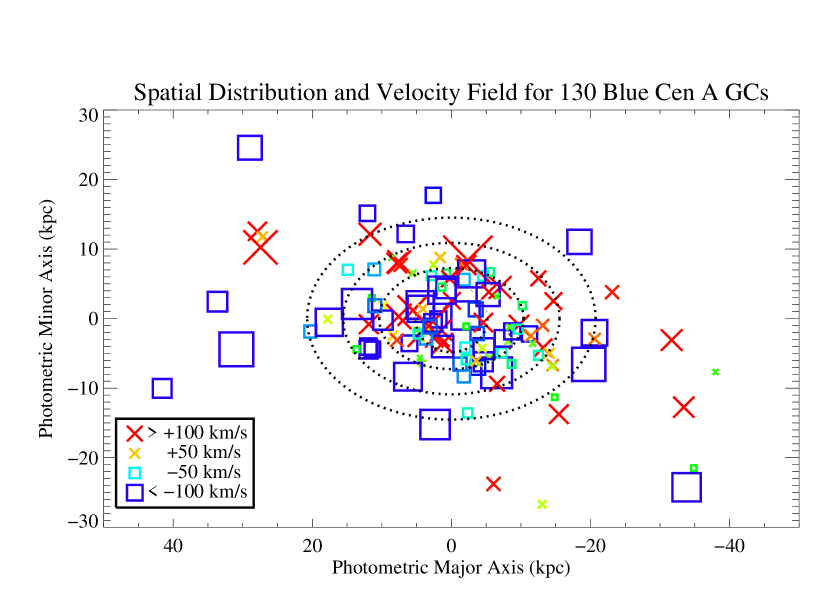
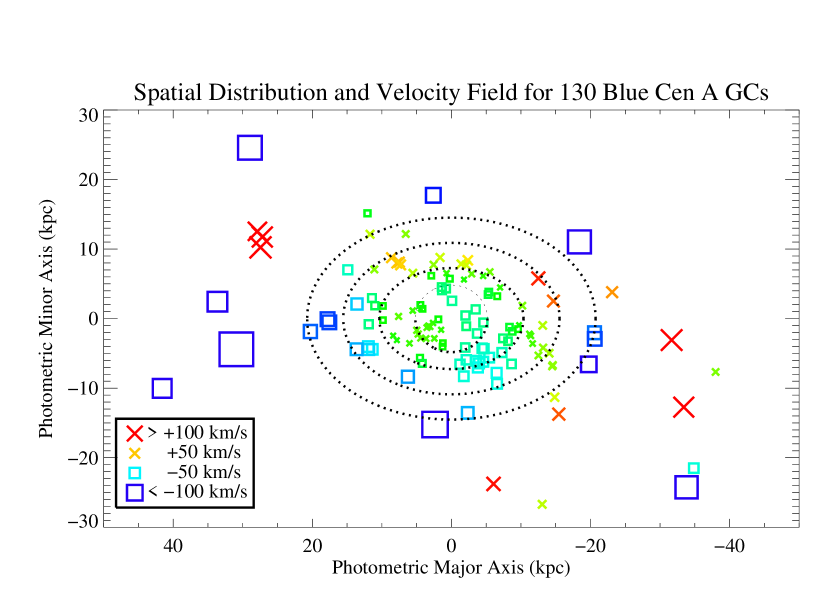
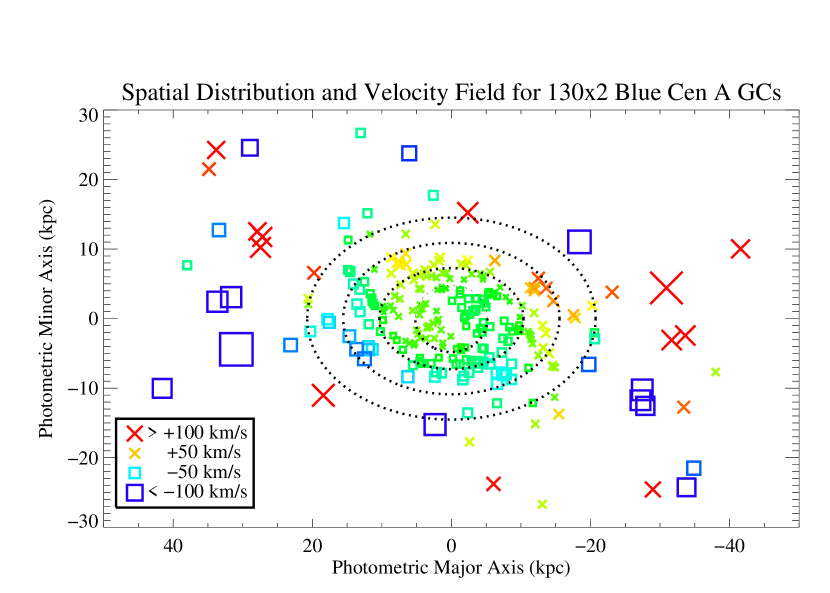
The smoothed velocity field of the red GCs (Figure 16b) shares many characteristics with that of the PNe, one of which is an ordered rotation about a misaligned kinematic axis. The velocity field of the blue GCs (Figure 16b) shows more complex structure. There is certainly ordered motion, some of which is in the same sense as for the red GCs and the PNe, but there is almost no rotation in the center and a higher velocity dispersion in the halo. As with the PNe, making the assumption of point symmetry in a triaxial potential allows us to reflect each GC through the origin and effectively double the number of velocity tracers. The reflected and smoothed velocity fields are shown in Figure 18.
When we do a rank-correlation analysis between the PNe and GC fields, we find that both are positively correlated with the PNe, but the reds are more so. With the null hypothesis being that they are uncorrelated, we find that the red GC velocity field rejects null at the level of , while the blue GC field rejects null at .
For the central regions ( kpc), where the density of GCs is high enough, we can also map the velocity dispersion field. Figure 19 shows the point symmetrized, kernel smoothed velocity dispersion field for all GCs within 20 kpc. The dispersion typically ranges from 75–150 km s-1, with there being two regions of distinct dynamical temperature. The “hottest” region is an elongated feature that lies roughly perpendicular to the line of zero velocity. This feature is seen in the dispersion fields for both the red and blue GCs, and is also seen in the PNe kinematics.
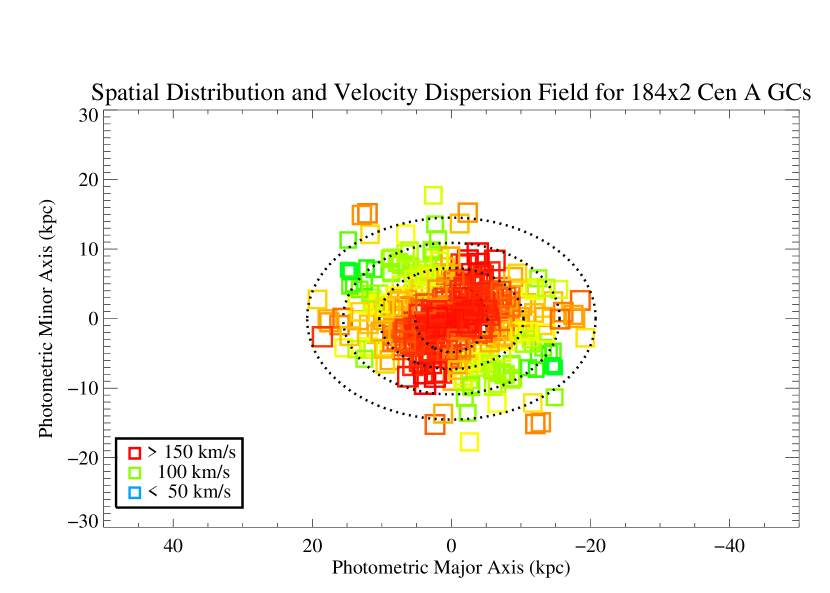
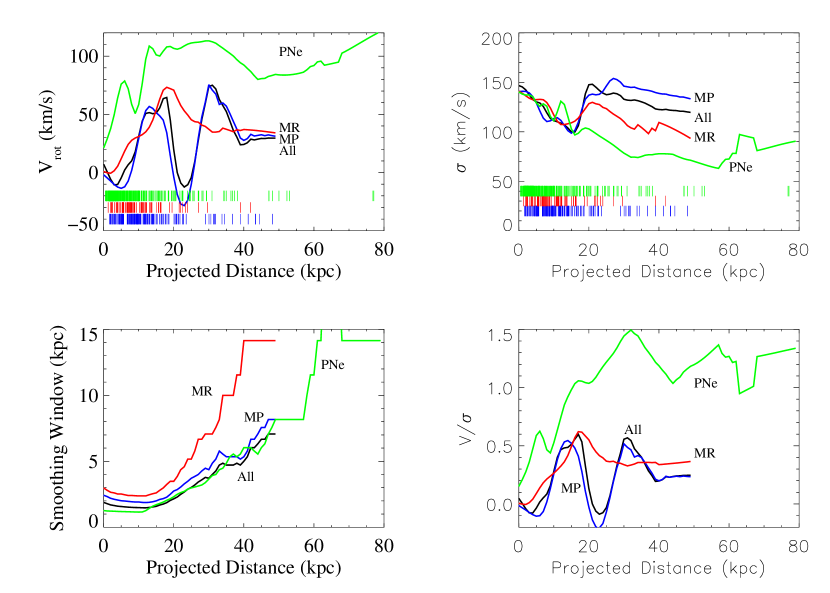
Because the velocity fields exhibits some degree of symmetry, we can try to collapse the kinematic information into one dimension. Despite the lack of spherical symmetry, we created a simple rotation curve and velocity dispersion profile. First, we changed the sign of the velocity for all GCs on one side of the line of zero velocity. Then, we calculated the projected semi-major axis distance for each GC (assuming constant ellipticity of the isophotes with radius). Figure 20 shows the resulting rotation curve and velocity dispersion profiles against projected semi-major axis distance. Also plotted for comparison are the smoothed rotation curve and velocity dispersion profile for the PNe. The last panel shows the used for the Gaussian smoothing kernel as a function of distance.
The PNe show a larger signature of rotation by a factor of two. This may partly be due to geometry, say if the GC system was rotation with an inclination of . However, since we have no way of determining the inclination of the GC rotation axis, we assume that we are viewing the system “edge-on”, as is nearly the case for the PNe. For the PNe, we have enough objects that we only used PNe along the major axis to construct the one dimensional kinematics, whereas the GCs are averaged over the entire annulus. The PNe rotation curve flattens at km s-1 as opposed to km s-1 for the GCs. The rotational velocity of the red GCs rises gradually to 20 kpc before flattening. Within 20 kpc, which is where most of the red GCs are, the mean velocities are consistent with solid-body rotation. The blue GCs also exhibit rotation at the level of km s-1, but again in a noisier fashion.
The velocity dispersion profile for all populations are indistinguishable within 15 kpc. They all have a central dispersion of 140 km s-1 that slowly declines to 100 km s-1. Outside of 15 kpc, the PNe dispersion continues to decline to 75 km s-1, while the GCs maintain a higher dispersion. The red GCs formally have a lower dispersion than the blue GCs, but it is difficult to make comparisons at larger radii because the low numbers of GCs.
6. Mass Estimates
Along with PNe, globular clusters are also useful tracers of a galaxy’s total mass. GCs are luminous, discrete objects that are relatively easy to identify. They are also found at large radii from the galaxy center. Because the formation environments of GCs and field stars may not be the same, GCs and PNe do not necessarily have similar kinematics. Thus, it is an important independent check to derive the galaxy’s mass from both sets of tracers.
As we discussed in our paper on the PNe (Peng et al. 2004a), there are numerous methods one can use to estimate the mass. Unfortunately, the GC system also exhibits many of the same complexities that the PNe do. Also, the lack of a clear disk-like feature precludes us from limiting our kinematic analysis to the major axis, as we did for the PNe. As a result, we choose to estimate the mass using the tracer mass estimator (TME; Evans et al. 2003).
The TME is optimized for the use of a “tracer” population, such as PN or GC, whose spatial distribution does not match the overall mass distribution. For this mass estimator, the mass enclosed within the outermost tracer particle is
where
the form of gravitational force field is , the space density of tracer particles goes as , and and define the range of radii from which the tracer objects are drawn. This mass estimate is only for pressure support, so the contribution from rotation must be added.
Fitting a power law to the surface distribution of GCs, we obtained a slope of . By assuming an isothermal halo potential (), we can estimate the total mass of NGC 5128 within a given radius. Our sample of GCs only obeys a power law outside of 5 kpc (because of incompleteness) so we limit our analysis to the GCs between 5 and 40 kpc. Assuming an isotropic velocity distribution and obtaining statistical errors via the bootstrap, we obtain a mass within 40 kpc of . This is statistically identical to the mass of that we obtained from the PNe for the same range of radii. It is likely, however, that a significant number of our GCs and PNe are beyond 40 kpc (Evans et al. 2003), as we detect PNe out to 80 kpc. If we extend the outer radius to this distance, we obtain masses of and for the GCs and PNe, respectively. The close agreement of these two mass estimates suggest that the orbital anisotropy for both populations is likely to be very similar.
7. Discussion: The Formation of NGC 5128
Ever since its association with the radio source Centaurus A, NGC 5128 has been the target of numerous studies. Naturally, a role has often been proposed for the radio jet in determining the observed optical structure — young stars and ionized gas along the edge of the northeast jet (e.g. Blanco et al. 1975; Graham 1998; Fassett & Graham 2000) are believed to be a result of the interaction of the jet with dense H I clouds in the halo (Schiminovich et al. 1994). However, while this process surely contributes to the stellar content of the galaxy (Rejkuba et al. 2002), it does not appear that jet-induced star formation could have formed the bulk of the galaxy. Rather, it is likely that one or more merger events caused the galaxy’s current morphology, and is what supplied the gas that feeds the massive black hole likely to reside in the nucleus.
7.1. An Elliptical-Spiral Merger?
Early on, Baade and Minkowski (1954) proposed that NGC 5128 was the product of a collision between an elliptical and spiral galaxy, and this has been the traditionally favored view. Graham (1979) used the radial velocities of the H II regions in the dust lane to show that this feature was a rapidly rotating disk. Malin, Quinn, & Graham (1983) showed that the shells in NGC 5128 could be due to phase-wrapping of stars from a captured disk galaxy with the size of M33. It has also been shown that both the central dust lane and the H I shells can be explained by a thin, warped disk of gas and dust that is still settling into the potential (e.g. van Gorkom et al. 1990, Sparke 1996). We note that the H I shells in the halo have velocities that are similar to those of the PNe in the regions that they occupy (even the one shell that crosses the line of zero velocity).
While the merger of an elliptical with a low-mass disk galaxy is not ruled out by any of the current observations, the scenario does have some problems. Measurements of the gas in the central disk from H II regions (Dufour et al. 1979), and nuclear CO absorption (Eckart et al. 1990) all indicate that it has near solar metallicity. This is also true for CO measurements of the gas shells in the halo observed by Charmandaris, Combes, & van der Hulst (2000). A less massive galaxy such as M33 would have lower elemental abundances, at least initially. Charmandaris et al. (2000) suggest that self-enrichment from nearby star formation as a possible mechanism to raise the metallicity in the shells, and this is similarly a possibility in the central disk where we observe copious ongoing star formation. They also point out that the amount of detectable gas in NGC 5128 is , a quantity comparable to that contained in either a early-type giant spiral galaxy or an irregular galaxy like the Large Magellanic Cloud.
Another problem with the low-mass disk merger scenario is the stellar populations of the shells. In the phase-wrapping scenario proposed by Quinn (1984), a satellite galaxy falls into a rigid potential and its stars create the over-densities in surface brightness that we see as shells. Therefore, if there is a substantial difference between the stellar populations of the two galaxies, we should observe them as color differences in the shells. However, our color maps of NGC 5128 show that, with one exception, the shells are identical in color to the main body of the galaxy (Peng et al. 2002). Rejkuba et al. (2001) also find that the color-magnitude diagram of stars in one shell is similar to that seen in the non-shell region. Sparke (1996) favors a dynamical age of 750 Myr for the central disk. If the capture happened on a similar timescale, then the stars in the shells should still be young enough to create detectable differences in the stellar populations.
These objections become less severe if the merger occurred with a larger spiral galaxy, and if it occurred more than 1–2 Gyr ago. Of course, because this scenario presupposes the existence of the elliptical, it does not offer insight into the formation of the old stellar component.
7.2. An Intermediate Age Population?
The ages we obtain for the metal-rich GCs show that they are significantly younger than the metal-poor GCs. With two-thirds of the metal-rich GCs having ages between 1 and 8 Gyr, these GCs are deemed “intermediate age”. There is mounting evidence that massive metal-rich star clusters are created in starbursts, and can survive to become GCs. For example, Whitmore et al. (1997, 2002) used imaging to show that the dynamically young elliptical NGC 3610 has a metal-rich population of GCs with an age of 4 Gyr. Goudfrooij et al. (2001) used spectroscopy to show that NGC 1316, a galaxy similar to NGC 5128, has 3 Gyr old GCs that are believed to be result of a recent merger. Forbes et al. (2001) also found evidence for possible intermediate age GCs in NGC 1399. Puzia (2002) studied the GC systems of a number of ellipticals and found that while metal-poor GCs are almost uniformly old, metal-rich GCs show a large spread in ages. However, not all metal-rich GCs are necessarily young. Studies of other GC systems, such as M87 (Jordán et al. 2002), M49 (Puzia et al. 1999), and the Galaxy, show the metal-poor and metal-rich GCs to be nearly coeval.
In NGC 5128 itself, there are many lines of evidence that point to the presence of an intermediate-age population. Alonzo & Minniti (1997) used optical-infrared photometry to determine that there are a number of “IR-enhanced” GCs in the central 3 kpc. These clusters have redder colors due to the presence of carbon stars along the asymptotic giant branch (AGB), a feature of stellar populations with ages of 1–4 Gyr (Aaronson & Mould 1982).
There is also evidence that the field star population has an intermediate age contribution. Using optical-IR color-magnitude diagrams, Rejkuba et al. (2001) found that there are a significant number of bright AGB stars in the field population — up to 10% of the field stars may be intermediate-age. Soria et al. (1996) and Marleau et al. (2000) came to similar conclusions using WFPC2 and NICMOS observations. This, however, is at odds with the WFPC2 work of Harris, Harris, & Poole (1999; HHP99) and Harris & Harris (2000; HH00) who argue that the contribution of intermediate-age stars to the halo of NGC 5128 is no more than 1%. It is possible that these discrepencies can be accounted for by a radial gradient in age as the HHP99 and HH00 fields are at 21 and 31 kpc, while the fields for the other studies are at radii between 8 and 14 kpc. There may be other spatial dependencies as well, depending on whether fields are observed along the major axis and the extended stellar disk — one Rejkuba et al. (2001) field was on the major axis, but both HHP99/HH00 fields were chosen to avoid it.
The integrated stellar populations of ellipticals also show a spread in ages. Trager et al. (2000) used Lick spectral indices to show that while cluster ellipticals were generally old, field ellipticals had a younger mean age with a spread of ages, modulo the contribution of metal-poor BHB stars (Maraston & Thomas 2000). This is consistent with a picture where interactions and mergers drive evolution, and where these processes, especially gaseous interactions, happen later in less dense environments. As a galaxy in a loose group, NGC 5128 would be considered a field elliptical.
Our observations of the metal-rich GCs and the observations others have made of the field star population support the conclusion that a significant fraction of the stars in NGC 5128 have intermediate ages. GCs systems are generally less centrally concentrated than their corresponding field stars, and it is possible that most intermediate-age field stars are either in the central regions, or perhaps localized along the major axis.
7.3. Multi-phase In Situ Formation
In some ways, the simplest scenario of galaxy formation is the monolithic collapse of a protogalactic gas cloud (Eggen, Lynden-Bell, & Sandage 1969). Forbes, Brodie, & Grillmair (1997) proposed a “multi-phase” collapse scenario in order to account for the bimodal metallicity distributions of GC systems. In this scheme, the initial formation epoch is truncated, perhaps by supernova winds, and the subsequent formation episodes occur when the enriched gas can again form stars.
When trying to recreate the metallicity distribution function (MDF) of field stars in NGC 5128, HH00 and HH02 found it necessary to invoke two-phases of chemical evolution. At early times, they used an “accreting-box” model which allowed for gas inflow, and at late times, they treated the galaxy as a “closed-box”, shutting off any gas inflow. Like in the Solar neighborhood, gas inflow is necessary to avoid an overabundance of metal-poor stars as compared to observations (the classic “G-dwarf problem”). In spirit, this is similar to the scenario proposed by Forbes et al. (1997), although it is not exclusive to their scenario.
In a multi-phase collapse scenario, one would expect that the metal-rich GCs and the PNe (field stars) would have similar kinematics since they were formed out of the same gas. The metal-poor GCs, having very few corresponding field stars, would not necessarily have correlated kinematics. While our data agrees with this in principle, we believe that a larger issue is not the agreement or disagreement between metal-poor GCs, metal-rich GCs, and PNe, but the fact that all three populations exhibit a significant amount of angular momentum in their halos. This is more likely to be a result of angular momentum transport than of a rapid dissipational collapse. In addition, in the case of NGC 5128, the delay between the two epochs of star formation must be many billion years. Because the timescale for the return of supernova heated gas to the cool ISM is still uncertain, this length of a delay may yet be plausible. Nevertheless, while a multi-phase in situ collapse may be a sufficient description of the galaxy’s chemical enrichment history, it will be important to determine a set of corresponding kinematic predictions.
7.4. NGC 5128 as a Result of a Disk-Disk Merger
The mergers of disk galaxies have been suggested as a possible formation mechanism for ellipticals for over thirty years (Toomre & Toomre 1972). A classic objection to this model was that ellipticals have many more GCs per unit light () than spirals, and that this would also be true for the sum of two spirals. Ashman & Zepf (1992) proposed that disk-disk mergers could produce new globular clusters that would make up for the perceived deficit of GCs in spirals per unit light as compared to ellipticals. Whether or not these newly formed GCs can actually raise the specific frequency of the resulting galaxy is still debated, but both observations and simulations show that these mergers can result in intense starbursts that eventually settle into hot stellar systems (Schweizer 1996, Barnes & Hernquist 1996). Hernquist & Spergel (1992) also show that major mergers can reproduce the shells seen in some ellipticals, and that leftover gas can re-accrete into a warped, rotating central gas disk (Mihos, private communication).
N-body simulations of disk-disk mergers also show that these can produce a wide variety in dynamical characteristics in the remnant. Equal-mass (1:1) mergers are likely to produce boxy, non-rotating remnants, while unequal-mass (3:1) mergers produce disky, rotating remnants (Bendo & Barnes 2000; Naab & Burkert 2001). The latter result is similar to what we observe in the spatial distribution and kinematics of the PNe.
Recently, Bekki, Harris, and Harris (2003; BHH03) simulated a disk-disk merger (without gas) in an effort to reproduce the NGC 5128 field star MDF in the outer halo. They found that most of the stars in the halo of their merger remnant originate in the outer disks of the progenitors, helping to explain why the observed MDF has a preponderance of relatively metal-rich stars. These disk stars gain orbital angular momentum from their parent galaxies and become more spatially extended, mixing with the traditional metal-poor stellar halo. By contrast, contributions from the bulges or any gas dissipation are confined to the central regions of the remnant.
On many accounts, the scenario by which at least the metal-rich component of NGC 5128 formed via a disk-disk merger is attractive. In this merger of two spirals of unequal mass, the larger galaxy’s angular momentum vector is parallel to the current photometric minor axis, with the extended stellar disk along the major axis being a remnant of this system. The smaller galaxy may have had an angular momentum vector perpendicular to the larger galaxy’s, with its stars following the x-tube orbits of the combined potential. An analysis of the H95 PNe data by Mathieu, Dejonghe, & Hui (1996) estimated that 75% of the PNe were on z-tube orbits (minor axis rotation) with the other 25% on x-tubes, a ratio of 3:1. This event, which occurred 3–8 Gyr ago, formed the bulk of the metal-rich GCs, and the gas that did not form stars, which would presumably have nearly solar abundance, accumulated in the central gas disk and H I shells. Forming out of gas that originally shared its kinematics with the progenitors’ disk stars, the metal-rich GCs then rotate in much the same way as the PNe. And while the metal-poor GCs may receive some angular momentum from the merger, they do not rotate as much as the PNe or metal-rich GCs because they never had as much initial angular momentum.
Problems with this scenario arise when one examines the number and spatial distributions of the GCs. BHH03 point out that their simulation provides no mechanism for metal-rich GCs to exist in the halo, only in the central regions. Yet, we do see a number of metal-rich GCs beyond . This is likely more a problem with the simulations, as the treatment of gas cooling and reheating is important for predicting the final spatial distribution of clusters. Another problem is that with over 60% of the known GCs classified as metal-poor, there are too many metal-poor GCs in NGC 5128 to have originated solely from the halo populations of two spirals such as the Milky Way and M31. Forbes et al. (2000) calculated that a dissipationless merger of all Local Group galaxies would eventually produce a faded remnant with an absolute magnitude of and have GCs. When compared to NGC 5128(, Dufour et al. 1979, H95), the luminosity does not pose a problem if the merger remnant only fades for 5 Gyr, although the total dynamical mass of the remnant would be larger (Evans et al. 2003). Also, the relatively low fraction of old, metal-rich GCs points to the possibility that the progenitor disks had relatively small bulges (and their associated bulge GC systems). Despite these issues, though, a disk-disk merger is a promising framework within which we can explain many of NGC 5128’s observed properties.
7.5. NGC 5128 as a Result of Hierarchical Merging
There is already ample evidence that NGC 5128 experienced one or many mergers in its recent past. For example, the young tidal stream is a resident example of the accretion of low mass objects. Hierarchical models of galaxy formation (e.g. Kauffmann, White, & Guiderdoni 1993) predict that merging should be commonplace in the universe, and should be one of the main drivers of galaxy evolution. Côté, Marzke, & West (1998) showed that hierarchical mergers involving little gas dissipation could still produce the bimodal metallicity distribution seen in GC systems. Using a semi-analytic galaxy formation prescription, Beasley et al. (2002) simulated the GC systems of ellipticals, including both gas-poor and gas-rich merging, and also found them to have bimodal metallicity distributions. The metal-rich GCs in Beasley et al. (2002) model are the result of gaseous merging, most of which happens between redshifts of 1 and 4 (8–12 Gyr ago in the standard cosmology), and have mean ages that are younger than the mean ages of the metal-poor GCs. These models are attractive in that they combine aspects of all the previously discussed scenarios.
Beasley et al. (2003) also explicitly applied their semi-analytic models to the task of reproducing the metallicity distribution functions of the field stars and GCs in NGC 5128. While most of the star formation in their model galaxies happens early, they do predict a relation between age and metallicity in the GCs, with many of the metal-rich GCs forming in merger-induced “bursts”. While a large number of intermediate-age GCs are not inconsistent with their models — in fact, some of their model galaxies experience significant bursts at late times — the existence of a single intermediate-age metal-rich population would be a rare event and inconsistent with their age-metallicity relation. The current data do not allow us to distinguish between these two possibilities, but higher quality data can be used to derive the age distribution of GCs and constrain this aspect of these models.
By viewing the formation of NGC 5128 in the context of multiple mergers, we can reconcile some of the issues we have raised. The relatively late gaseous merger () as compared to the Beasley et al. (2002) models can be attributed to the low density environment of NGC 5128. In the group environment, all merging is expected to happen later. The deficit of metal-poor GCs in a disk-disk merger can be accounted for by the accretion of dwarf elliptical (dE) galaxies. HH00 claim that because the halo MDF is predominantly metal-rich, it could not have been formed by accretion of dEs. However, it is only the metal-poor tail of the MDF that needs to originate from the dEs, not the entire MDF of the halo. HHP99 calculate the “metal-poor ” is 4.3, which is very much in line within the values of 3–7 for dEs in Virgo (Miller et al. 1998). Accretion of dIs, such as we see happening with the young tidal stream, can also contribute metal-poor GCs, but they have specific frequencies that are too low to have made up the bulk of the metal-poor halo.
If the metal-poor GCs are accreted, then how can they also show some co-rotation with the stars? Bekki et al. (2002) claim that any GCs that exist before a merger will gain angular momentum through dynamical friction. As for the ones that accrete later, they may also have preexisting angular momentum if the group environment itself rotates. Côté et al. (2001) found that the metal-poor GCs in M87 rotate as a solid body about the same axis as the cluster angular momentum. Thus it is also important to examine the kinematic environment of NGC 5128. Figure 21 shows the spatial and velocity distribution of galaxies in the Centaurus group with respect to NGC 5128 (data taken from Banks et al. 1999). There does not appear to be any obvious rotation of the group as a whole, but this does not necessarily present a problem, as observations show that the metal-poor GCs in fact have a higher velocity dispersion than the rest of the galaxy. This is perhaps due to the continuing late accretion of metal-poor systems.

8. Conclusions
While one must always be cautious about trying to infer too much from a sample of one galaxy, detailed studies of NGC 5128 can teach us much about the formation of giant elliptical galaxies. As the nearest gE galaxy, radio galaxy, and recent large merger, NGC 5128 is an accessible laboratory where we can study the processes that likely played important roles forming most elliptical galaxies at higher redshift.
The stellar populations and kinematics of NGC 5128 show its history to be consistent with a hierarchical scenario in which most metal-poor GCs formed early and merged with the galaxy or its progenitors over time. The major event that shaped the galaxy as we see it today was likely a disk-disk merger, perhaps with unequal masses, that produced a disky, rapidly rotating remnant with a metal-rich GC population. This occurred at intermediate times ( Gyr ago, or ), and may also be responsible for the gas currently in the galaxy, although a subsequent merger of another gas-rich system with the newly-formed elliptical is not ruled out. The gas that resulted from this merger currently feeds the active nucleus, which in turn triggers star formation in the halo.
Future work that increases the number of known GCs, and obtains better ages and metallicities for all GCs will be important for corroborating or extending this formation picture. As well, scenarios and simulations that provide chemodynamical predictions will be essential for making full use of these kinds of data sets. Ellipticals are likely to have diverse formation histories that are a function of their mass and environment. It will be desirable to extend detailed studies of GC and PN systems to a larger sample of galaxies in the nearby universe.
References
- Aaronson & Mould (1982) Aaronson, M. & Mould, J. 1982, ApJS, 48, 161
- Alonso & Minniti (1997) Alonso, M. V. & Minniti, D. 1997, ApJS, 109, 397
- Ashman & Zepf (1992) Ashman, K. M. & Zepf, S. E. 1992, ApJ, 384, 50
- Ashman, Bird, & Zepf (1994) Ashman, K. A., Bird, C. M., & Zepf, S. E. 1994, AJ, 108, 2348
- Baade & Minkowski (1954) Baade, W. & Minkowski, R. 1954, ApJ, 119, 215
- Barnes & Hernquist (1996) Barnes, J. E. & Hernquist, L. 1996, ApJ, 471, 115
- Beasley et al. (2002) Beasley, M. A., Baugh, C. M., Forbes, D. A., Sharples, R. M., & Frenk, C. S. 2002, MNRAS, 333, 383
- Beasley, Hoyle, & Sharples (2002) Beasley, M. A., Hoyle, F., & Sharples, R. M. 2002, MNRAS, 336, 168
- Bekki, Forbes, Beasley, & Couch (2002) Bekki, K., Forbes, D. A., Beasley, M. A., & Couch, W. J. 2002, MNRAS, 335, 1176
- Bekki, Harris, & Harris (2003) Bekki, K., Harris, W. E., & Harris, G. L. H. 2003, MNRAS, 338, 587 [BHH03]
- Bendo & Barnes (2000) Bendo, G. J. & Barnes, J. E. 2000, MNRAS, 316, 315
- Blanco, Graham, Lasker, & Osmer (1975) Blanco, V. M., Graham, J. A., Lasker, B. M., & Osmer, P. S. 1975, ApJ, 198, L63
- Bruzual A. & Charlot (1993) Bruzual A., G. & Charlot, S. 1993, ApJ, 405, 538
- Charmandaris, Combes, & van der Hulst (2000) Charmandaris, V., Combes, F., & van der Hulst, J. M. 2000, A&A, 356, L1
- Cohen, Blakeslee, & Ryzhov (1998) Cohen, J. G., Blakeslee, J. P., & Ryzhov, A. 1998, ApJ, 496, 808 [CBR98]
- Côté, Marzke, & West (1998) Côté, P., Marzke, R. O., & West, M. J. 1998, ApJ, 501, 554
- Côté et al. (2001) Côté, P. et al. 2001, ApJ, 559, 828
- Côté, McLaughlin, Cohen, & Blakeslee (2003) Côté, P., McLaughlin, D. E., Cohen, J. G., & Blakeslee, J. P. 2003, ApJ, 591, 850
- de Freitas Pacheco & Barbuy (1995) de Freitas Pacheco, J. A. & Barbuy, B. 1995, A&A, 302, 718
- Dufour et al. (1979) Dufour, R. J., Harvel, C. A., Martins, D. M., Schiffer, F. H., Talent, D. L., Wells, D. C., van den Bergh, S., & Talbot, R. J. 1979, AJ, 84, 284
- Eckart et al. (1990) Eckart, A., Cameron, M., Genzel, R., Jackson, J. M., Rothermel, H., Stutzki, J., Rydbeck, G., & Wiklind, T. 1990, ApJ, 365, 522
- Eggen, Lynden-Bell, & Sandage (1962) Eggen, O. J., Lynden-Bell, D., & Sandage, A. R. 1962, ApJ, 136, 748
- Evans, Wilkinson, Perrett, & Bridges (2003) Evans, N. W., Wilkinson, M. I., Perrett, K. M., & Bridges, T. J. 2003, ApJ, 583, 752
- Fassett & Graham (2000) Fassett, C. I. & Graham, J. A. 2000, ApJ, 538, 594
- Forbes, Brodie, & Grillmair (1997) Forbes, D. A., Brodie, J. P., & Grillmair, C. J. 1997, AJ, 113, 1652
- Forbes, Beasley, Brodie, & Kissler-Patig (2001) Forbes, D. A., Beasley, M. A., Brodie, J. P., & Kissler-Patig, M. 2001, ApJ, 563, L143
- Geisler, Lee, & Kim (1996) Geisler, D., Lee, M. G., & Kim, E. 1996, AJ, 111, 1529
- González (1993) González, J. J. 1993, Thesis (PH.D.)–UNIVERSITY OF CALIFORNIA, SANTA CRUZ, 1993.Source: Dissertation Abstracts International, Volume: 54-05, Section: B, page: 2551.
- Goudfrooij et al. (2001) Goudfrooij, P., Mack, J., Kissler-Patig, M., Meylan, G., & Minniti, D. 2001, MNRAS, 322, 643
- Graham (1979) Graham, J. A. 1979, ApJ, 232, 60
- Graham (1998) Graham, J. A. 1998, ApJ, 502, 245
- Habgood (2001) Habgood, M. J. 2001, Ph.D. Thesis, THE UNIVERSITY OF NORTH CAROLINA AT CHAPEL HILL, Source DAI-B 62/08, p. 3653, Feb 2002, 165 pages.
- Harris & Harris (2000) Harris, G. L. H. & Harris, W. E. 2000, AJ, 120, 2423 [HH00]
- Harris & Harris (2002) Harris, W. E. & Harris, G. L. H. 2002, AJ, 123, 3108 [HH02]
- Harris, Harris, & Poole (1999) Harris, G. L. H., Harris, W. E., & Poole, G. B. 1999, AJ, 117, 855 [HHP99]
- Hernquist & Spergel (1992) Hernquist, L. & Spergel, D. N. 1992, ApJ, 399, L117
- Hui, Ford, Ciardullo, & Jacoby (1993) Hui, X., Ford, H. C., Ciardullo, R., & Jacoby, G. H. 1993, ApJ, 414, 463
- Jablonka, Bica, Pelat, & Alloin (1996) Jablonka, P., Bica, E., Pelat, D., & Alloin, D. 1996, A&A, 307, 385
- Jordán, Côté, West, & Marzke (2002) Jordán, A., Côté, P., West, M. J., & Marzke, R. O. 2002, ApJ, 576, L113
- Kauffmann, White, & Guiderdoni (1993) Kauffmann, G., White, S. D. M., & Guiderdoni, B. 1993, MNRAS, 264, 201
- Kundu & Whitmore (2001) Kundu, A. & Whitmore, B. C. 2001, AJ, 121, 2950
- Larsen & Richtler (2000) Larsen, S. S. & Richtler, T. 2000, A&A, 354, 836
- Larsen et al. (2001) Larsen, S. S., Brodie, J. P., Huchra, J. P., Forbes, D. A., & Grillmair, C. J. 2001, AJ, 121, 2974
- Larsen et al. (2003) Larsen, S. S., Brodie, J. P., Beasley, M. A., Forbes, D. A., Kissler-Patig, M., Kuntschner, H., & Puzia, T. H. 2003, ApJ, 585, 767
- Malin, Quinn, & Graham (1983) Malin, D., Quinn, P., & Graham, J. 1983, ApJ, 272, L5
- Maraston & Thomas (2000) Maraston, C. & Thomas, D. 2000, ApJ, 541, 126
- Marston et al. (2003) Maraston et al. . 2003, MNRAS, in prep
- Marleau, Graham, Liu, & Charlot (2000) Marleau, F. R., Graham, J. R., Liu, M. C., & Charlot, S. 2000, AJ, 120, 1779
- Mathieu, Dejonghe, & Hui (1996) Mathieu, A., Dejonghe, H., & Hui, X. 1996, A&A, 309, 30
- Miller et al. (1998) Miller, B. W., Lotz, J. M., Ferguson, H. C., Stiavelli, M., & Whitmore, B. C. 1998, ApJ, 508, L133
- Naab & Burkert (2001) Naab, T. & Burkert, A. 2001, ApJ, 555, L91
- Neilsen, Tsvetanov, & Ford (1997) Neilsen, E. H., Tsvetanov, Z. I., & Ford, H. C. 1997, ApJ, 483, 745
- Peng, Ford, Freeman, & White (2002) Peng, E. W., Ford, H. C., Freeman, K. C., & White, R. L. 2002, AJ, 124, 3144
- Peng, Ford, & Freeman (2004a) Peng, E. W., Ford, H. C., & Freeman, K. C. 2004a, ApJ, 620, in press, astro-ph/0311236
- Peng, Ford, & Freeman (2004b) Peng, E. W., Ford, H. C., & Freeman, K. C. 2004b, ApJS, 150, in press, astro-ph/0311264
- Perrett et al. (2002) Perrett, K. M., Bridges, T. J., Hanes, D. A., Irwin, M. J., Brodie, J. P., Carter, D., Huchra, J. P., & Watson, F. G. 2002, AJ, 123, 2490
- Peterson et al. (2003) Peterson, R. C., Carney, B. W., Dorman, B., Green, E. M., Landsman, W., Liebert, J., O’Connell, R. W., & Rood, R. T. 2003, ApJ, 588, 299
- Puzia, Kissler-Patig, Brodie, & Huchra (1999) Puzia, T. H., Kissler-Patig, M., Brodie, J. P., & Huchra, J. P. 1999, AJ, 118, 2734
- Puzia (2002) Puzia, T. H. 2002, Extragalatic Globular Cluster Systems, ed. M. Kissler-Patig, Springer (astroph/0210418)
- Quinn (1984) Quinn, P. J. 1984, ApJ, 279, 596
- Rejkuba (2001) Rejkuba, M. 2001, A&A, 369, 812
- Rejkuba, Minniti, Silva, & Bedding (2001) Rejkuba, M., Minniti, D., Silva, D. R., & Bedding, T. R. 2001, A&A, 379, 781
- Rejkuba, Minniti, Courbin, & Silva (2002) Rejkuba, M., Minniti, D., Courbin, F., & Silva, D. R. 2002, ApJ, 564, 688
- Romanowsky et al. (2002) Romanowsky, A. J., Douglas, N. G., Kuijken, K., Merrifield, M. R., Gerssen, J., Arnaboldi, M., & Freeman, K. C. 2002, Galaxy evolution, theory and observations.
- Schiminovich, van Gorkom, van der Hulst, & Kasow (1994) Schiminovich, D., van Gorkom, J. H., van der Hulst, J. M., & Kasow, S. 1994, ApJ, 423, L101
- Schlegel, Finkbeiner, & Davis (1998) Schlegel, D. J., Finkbeiner, D. P., & Davis, M. 1998, ApJ, 500, 525
- Schweizer (1996) Schweizer, F. 1996, AJ, 111, 109
- Soria et al. (1996) Soria, R. et al. 1996, ApJ, 465, 79
- Sparke (1996) Sparke, L. S. 1996, ApJ, 473, 810
- Thomas, Maraston, & Bender (2003) Thomas, D., Maraston, C., & Bender, R. 2003, MNRAS, 339, 897
- Trager, Faber, Worthey, & González (2000) Trager, S. C., Faber, S. M., Worthey, G., & González, J. J. 2000, AJ, 120, 165
- van Gorkom, van der Hulst, Haschick, & Tubbs (1990) van Gorkom, J. H., van der Hulst, J. M., Haschick, A. D., & Tubbs, A. D. 1990, AJ, 99, 1781
- Vazdekis (1999) Vazdekis, A. 1999, ApJ, 513, 224
- Vazdekis & Arimoto (1999) Vazdekis, A. & Arimoto, N. 1999, ApJ, 525, 144
- Whitlock, Forbes, & Beasley (2003) Whitlock, S., Forbes, D. A., & Beasley, M .A. 2003, MNRAS, submitted (astro-ph/0307417)
- Whitmore, Miller, Schweizer, & Fall (1997) Whitmore, B. C., Miller, B. W., Schweizer, F., & Fall, S. M. 1997, AJ, 114, 1797
- Whitmore (2000) Whitmore, B. C. 2000, STScI Symposium Series 14, ed. M. Livio. (astro-ph/0012546)
- Whitmore, Schweizer, Kundu, & Miller (2002) Whitmore, B. C., Schweizer, F., Kundu, A., & Miller, B. W. 2002, AJ, 124, 147
- Worthey (1994) Worthey, G. 1994, ApJS, 95, 107
- Worthey & Ottaviani (1997) Worthey, G. & Ottaviani, D. L. 1997, ApJS, 111, 377
- Yi et al. (2001) Yi, S., Demarque, P., Kim, Y., Lee, Y., Ree, C. H., Lejeune, T., & Barnes, S. 2001, ApJS, 136, 417
- Yi (2003) Yi, S. K. 2003, ApJ, 582, 202
- Yi et al. (2003) Yi, S. K., Peng, E. W., Ford, H. C., Kaviraj, S., Yoon, S.-J. 2003, MNRAS, submitted
- Zepf et al. (2000) Zepf, S. E., Beasley, M. A., Bridges, T. J., Hanes, D. A., Sharples, R. M., Ashman, K. M., & Geisler, D. 2000, AJ, 120, 2928