Sunyaev-Zeldovich Observations of Massive Clusters of Galaxies
Abstract
We present detections of the Sunyaev-Zeldovich Effect (SZE) at 150GHz and 275GHz for the X-ray luminous z=0.299 cluster 1E0657-67. These observations were obtained as part of an X-ray, weak lensing, and SZE survey of nearby X-ray bright clusters. The SZE maps were made with the ACBAR (150, 210, 275 GHz) bolometer array installed at the Viper telescope located at the South Pole. We also present preliminary results from a blind SZE cluster survey.
1 Introduction
We are undertaking a multiwavelength study of the physical properties of a sample of X-ray bright galaxy clusters. These clusters were selected from the REFLEX survey of southern X-ray clusters ( Böhringer et al. (2001)). They conform to the following criteria: L erg/s [0.1-2.5 keV] and . In this study, we will combine new and archival X-ray data with weak lensing observations and new Sunyaev-Zeldovich Effect (SZE) measurements.
The rationale behind combining these multiwavelength observation is the fact that they probe the cluster components in different ways. For instance, X-ray and SZE data probe the gas density and temperature distributions, whereas weak lensing observations probe the total mass distribution. The combination of X-ray and SZE data provides three observables (X-ray surface brightness, SZE decrement, and projected temperature) which constrain the variation of density and temperature throughout the target cluster. Comparing weak-lensing mass distributions with X-ray and SZE gas distributions in the same clusters allows a detailed test of usual assumptions (hydrostatic equilibrium, spherical symmetry, and the lack of significant substructure) on which estimates for the amount and distribution of dark matter in clusters are based.
This study will attempt to: 1) characterize the density, temperature, and dynamical state of the gas in each cluster. 2) compare the mass estimates derived from the SZE and X-ray observations with the more direct weak lensing mass. This study is paramount to determine whether, and to what level, future cosmological parameter estimates from SZE and X-ray cluster surveys might be biased by non-thermal cluster physics and/or by non standard cluster geometries (e.g., Holder et al. (2001)).
1.1 Sunyaev-Zeldovich Effect Observations with ACBAR
The SZE describes the inverse Compton scattering of Cosmic Microwave Background (CMB) radiation photons by hot electrons in the intra-cluster plasma. There are two SZ effects: the kinetic and thermal effects. The thermal effect is due to the random thermal motion of the cluster electrons and shifts lower energy CMB photons to higher energy while the kinetic effect is due to the bulk flow motion of the cluster. Since photon number is conserved in the process, the net effect of the thermal effect is to distort the CMB spectrum such that there is a null at about 215 GHz, an increment at shorter wavelengths, and a decrement at longer wavelengths. This spectral distortion allows multi-frequency instruments that span this null to separate the SZE from intrinsic CMB anisotropies. Except at frequencies close to the thermal null, the thermal effect dominates the kinetic effect by an order of magnitude.
We have performed cluster SZE observations with the Arcminute Cosmology Bolometer Array Receiver (ACBAR) mounted at the Viper telescope ( Peterson et al. (2000)). This millimeter/submillimeter telescope consists of 4 mirrors arranged in an off-axis configuration. The radiation from an object collected by the 2.15m diameter primary and the secondary (which form an aplanatic Gregorian system) is reflected by a flat chopping tertiary mirror and focused by a hyperbolic condenser onto the focal plane of the telescope. Note that the tertiary mirror is located at the exit pupil of the system. Therefore, any motion of the chopping mirror is equivalent to a motion of the primary mirror. This allows us to perform fast raster scans of up to 3 ∘ in azimuth at a fixed elevation.
The ACBAR instrument (Runyan et al. (2003)) consists of 16 micro-lithographed ‘spider-web’ bolometers arranged in a array. The detectors are spaced by 16 arcmin and have beams that can be modeled as 4.5 arcmin FWHM Gaussians (Kuo et al. (2003)). A more extensive review of the instrument and its capabilities can be found in Runyan et al. (2003). For the 2001 season, observations were made at 150, 220, 275, and 345 GHz (band widths of 30, 30, 50, and 25 GHz respectively), with a column of four detectors per frequency. These frequencies take full advantage of the atmospheric windows available at the Pole. They bracket the null in the thermal SZE spectrum and allow ACBAR to produce both SZE decrement and SZE increment images. For the 2002 observing season, ACBAR was modified so that each row performed observations at the same frequency. In addition, the number of 150GHz filters was doubled, by removing the 345 GHz channels.
During an observation, the chopping motion of the tertiary mirror sweeps each bolometer beam across the sky in the azimuth direction at an approximately constant elevation. The design of the telescope keeps the illumination pattern on the primary almost constant during the chopping; however, this is not the case over the secondary mirror. This introduces a systematic offset into the data because the emissivity over the secondary is not constant due to snow accumulation, ice, and temperature variations. To remove these offsets, we used a Lead-Main-Trail technique. The method is as follows: The main field sweeps (where the target is centered) are led and trailed by similar sets of raster scans (lead and trail scans) of the sky at the same elevation but spaced in azimuth by half a degree. The lead and trail observations are then subtracted from the main observation to correct for the offset. Note that the observing time in the lead and trailed stares is half the exposure time of the lead stare (typically, the Lead and Trail fields are observed for 30 sec while the Main field is observed for 60 seconds). This guarantees that the L-M-T observing sequence is performed fast enough so that we minimize the effects of any temporal variation in the offsets.
Note that for the cluster observations, we set the chopper throw to be 1.5 degrees. With a sampling rate of 300 Hz, this produced. 200 samples per arcmin per stare. In order to make a 2d-map of a cluster, we take several stares (set of L-M-T field observations) spaced in elevation by 1 arcmin such that we cover the cluster in its entirety (e.g., for a 0.05 cluster, we map a region that is 1 degree in elevation). In addition, we combine several (30 50) of these raster scans in order to integrate long enough to build up signal to noise.
2 Observation of Unresolved Galaxy Clusters
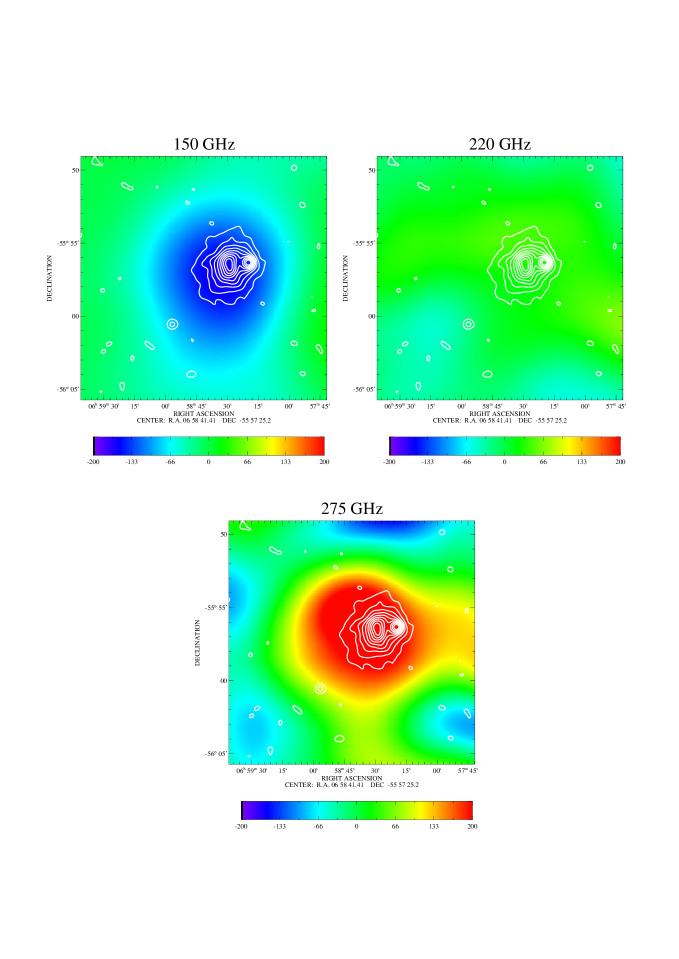
During the 2001-2002 observing season we observed two 0.3 clusters: Abell S1063 (0.347) and 1E0657-67 (0.299). These two clusters are the X-ray brightest clusters in the REFLEX catalog that could be observed from the South pole. We detected the thermal Sunyaev-Zeldovich effect from 1E0657-67 at 150 GHz and 275GHz (Figure 1). These are the first 2d-maps of the SZE at either side of the thermal null obtained for a cluster with the same instrument. Moreover, we also report a non-detection at 220 GHz consistent with the thermal SZE. This cluster was first discovered by the Einstein satellite ( Tucker et al. (1995)). A ROSAT image of this cluster confirmed this previous detection and also revealed the presence of bimodality. Detailed Chandra X-ray and temperature maps derived by Markevitch et al. (Markevitch et al. (2002)) showed that this cluster is a recent merger. In fact, the merger is so recent that the bulk shock produced by the core crossing is still strong (Mach number of 2-3) and there is significant temperature substructure in the system with temperature ranging from 8 keV to more than 20keV. Our observations revealed a peak decrement of 180 K/beam (with an error of 9 K/beam), a peak increment of 180 K (with an error of 66 K/beam), and a negligible signal at 220 GHz. Note that our 150GHz and 275GHz detections confirm an early SZE detection obtained by Andreani et al. ( Andreani et al. (1999)). We have also detected, for the first time, a thermal SZE signature from Abell S1063. At 150 GHz the cluster was detected with a signal-to-noise of 3.5.
3 Observation of Resolved Galaxy Clusters
In addition, we also observed the 5 brightest nearby (0.1) clusters accessible from the South Pole: Abell 3667, Abell 3266, Abell 3158, Abell 3827, and Abell 3112. They have been observed to different levels of sensitivity (typical noise in the central region at 150GHz are: 18K/beam, 38K/beam, 6K/beam, 11K/beam, and 19K/beam respectively).
As expected, the maps of nearby clusters (0.1) were contaminated by primary CMB anisotropies. This contamination was especially pronounced in the 150 GHz maps, where the CMB noise dominated the random noise. However, our multifrequency observations and our knowledge of the spectrum of the physical mechanism responsible for the thermal SZE allows us to spectrally filter out the CMB primary anisotropy ( Gomez and et al (2004)). Intuitively, this method is very simple as it can be shown that at 150 GHz we detect the CMBR minus the cluster signal; at 220 GHz -the thermal SZE null- the CMBR dominates the map; and at 275 GHz we detect the CMBR plus the cluster signal. So, naively subtracting the 150 GHz data from the 275 GHZ data would retrieve the cluster signal and cancel out the CMBR data. In practice, we construct a linear combination of the 150, 220, and 275 GHz images designed to maximize the SZ signal and minimize the CMBR signal at the RJ limit that takes into account the shape of the SZE spectrum. In 2004 we plan to complete our multi-frequency ACBAR observations of a sample of 10 nearby clusters ( 0.1)
4 Sunyaev-Zeldovich Effect Blind Cluster Survey
To date, 10 deg2 of sky have been mapped by ACBAR to a sensitivity of 5uK/beam at 150 GHz. A further 10 deg2 have been mapped to a sensitivity of 11 uK/beam at 150 GHz. These survey regions were centered on the radio bright quasars, allowing us to register the individual raster scans and refine the pointing model to within an arcminute. An analysis of the CMBR power spectrum using these data has been presented in Kuo et al. 2003 ( Kuo et al. (2003)) and Goldstein et al. ( Goldstein et al. (2003)). We have also used these maps to search for previously undetected clusters of galaxies by applying an optimal filtering to remove CMBR and instrument noise (see Runyan 2003 Runyan (2003)).
In this way, we have uncovered more than 40 high significance cluster candidates in our survey fields (over 3). The ACBAR detections differ from previous detections of the SZE at high redshift as these have come from pointed searches toward known ( LaRoque et al. (2003)) clusters. The ACBAR Blind Cluster Survey selection function is well understood, so we should ultimately be able to use the ACBAR SZE clusters to constrain cosmological parameters once candidates are confirmed and redshifts.
We have performed an optical followup to these cluster candidates with the MOSAIC camera mounted on the 4m Blanco telescope at CTIO. We have obtained Sloan , , and images for most of the candidates and identified red-sequences in 6 of them that appear to be consistent with clusters at 0.5. Once confirmed spectroscopically, these will be the first clusters to have been discovered via their SZ signal alone (rather than via optical, radio or X-ray signatures).
References
- Böhringer et al. (2001) Böhringer, H., Schuecker, P., Guzzo, L., and et al, Astronomy & Astrophysics, 369, 826–850 (2001).
- Holder et al. (2001) Holder, G., Haiman, Z., and Mohr, J. J., Astrophysical Journal Letters, 560, L111–L114 (2001).
- Peterson et al. (2000) Peterson, J. B., Griffin, G. S., Newcomb, M. G., and et al, Astrophysical Journal Letters, 532, L83–L86 (2000).
- Runyan et al. (2003) Runyan, M. C., Ade, P. A. R., Bhatia, R. S., and et al, Astrophysical Journal (accepted) (2003).
- Kuo et al. (2003) Kuo, C. L., Ade, P. A. R., Bock, J. J., and et al, Astrophysical Journal (accepted) (2003).
- Tucker et al. (1995) Tucker, W. H., Tananbaum, H., and Remillard, R. A., Astrophysical Journal, 444, 532–547 (1995).
- Markevitch et al. (2002) Markevitch, M., Gonzalez, A. H., David, L., Vikhlinin, A., Murray, S., Forman, W., Jones, C., and Tucker, W., Astrophysical Journal letters, 567, L27–L31 (2002).
- Andreani et al. (1999) Andreani, P., Böhringer, H., dall’Oglio, G., Martinis, L., Shaver, P., Lemke, R., Nyman, L.-Å., Booth, R., Pizzo, L., Whyborn, N., Tanaka, Y., and Liang, H., Astrophysical Journal, 513, 23–33 (1999).
- Gomez and et al (2004) Gomez, P. L., and et al, “Physical Properties of the Gas in A3266 as Determined from X-ray, Weak Lensing, and new Sunyaev-Zeldovich Observations,” in the ASP Conf. Ser.: ”Matter and Energy in Clusters of Galaxies,” April 2002, Taiwan, editted by S. Bowyer and C.-Y. Hwang, (astro-ph/0301024), 2004.
- Goldstein et al. (2003) Goldstein, J. H., Ade, P. A. R., Bock, J. J., and et al, Astrophysical Journal (accepted) (2003).
- Runyan (2003) Runyan, M. C., Ph.D. Thesis (2003).
- LaRoque et al. (2003) LaRoque, S. J., Joy, M., Carlstrom, J. E., and et al, Astrophysical Journal, 583, 559–565 (2003).