Abstract
During 2001 and 2002, observations of several X-ray bright clusters of galaxies were conducted using the ACBAR Bolometer Array on the South Pole Viper telescope. A multi-frequency analysis of these clusters is currently underway. This multi-frequency analysis includes 150, 220 and 275 GHz data from ACBAR, X-ray imaging and spectroscopy from Chandra and XMM-Newton, and weak lensing data from the CTIO 4m Blanco telescope. We describe here how ACBAR can be used to create fully sampled cluster images and present such images for four of the clusters in our sample; Abell 3266, Abell 3827, Abell S1063 and 1E0657-56. In these images, the Sunyaev-Zel’dovich Effect is clearly detected.
Chapter 0 Imaging the Sunyaev Zel’dovich Effect using ACBAR on Viper
1 Introduction
The Arcminute Cosmology Bolometer Array Reciever instrument (ACBAR; Runyan et al. 2003) has been operating on the 2.1m millimeter/submillimeter Viper telescope since January 2001. The Viper telescope (Peterson et al. 2000) is located at one of the best sites in the world for millimeter/submillimeter astronomy (Peterson et al. 2002), the South Pole Martin A. Pomeranz Observatory. The ACBAR focal plane is tiled with 16 microlithographed “spider-web” bolometers arranged in a array. Each bolometer has a Gaussian beam with a FWHM (see Figures 2 and 12 in Runyan et al. 2003). Adjacent beams are separated on the sky by . During the 2001 observing season, the array was arranged so that each column of four bolometers was sensitive to one of the following mean frequencies; 150, 220, 275 and 345 GHz. During the 2002 season, the 345 GHz bolometers were replaced by 150GHz bolometers. The array was also re-arranged so that now each row, rather than each column, was sensitive to the same frequency. Two rows of 150GHz bolometers, and one row each of 220 and 275 GHz bolometers, were used. The ACBAR observing frequencies straddle the peak in the CMB spectrum and the 220 GHz “null” point in the thermal Sunyaev-Zel’dovich effect (Sunyaev & Zel’dovich 1972; SZE hereafter). The primary calibrators for the 2001 and 2002 seasons were Mars and Venus respectively. During the periods when these planets were not accessible from the South Pole, various Galactic sources were used to monitor variations in the calibration. The total calibration uncertainty is estimated to be 10% (Runyan et al. 2003). The Galactic source observations were also used to determine the telescope pointing model. The overall pointing error for the 2001 season was in right ascension and in declination. For the 2002 season, a mechanical chopper encoder was replaced with an optical encoder and the pointing error in the right ascension direction improved to .
To date, ACBAR data have been applied to three different projects. First, to determine the Cosmic Microwave Background (CMB) power spectrum over the range with a resolution of (Kuo et al. 2003). This spectrum has yielded constraints on a variety of cosmological parameters (Goldstein et al. 2003, Spergel et al. 2003). Second, we are using the 150 GHz maps generated for the CMB anisotropy project to search for high redshift clusters of galaxies via the SZE (Runyan 2002). Several cluster candidates have been selected using a matched spatial filtering technique. These candidates are being followed up with optical and X-ray imaging to confirm their identification and to measure redshifts. Ultimately, the high redshift, or “blind”, ACBAR cluster survey will be used to derive complimentary (to the CMB power spectrum) constraints on cosmological parameters. Finally, we are using ACBAR, in conjunction with data from X-ray and optical telescopes, to study a small sample of well known, X-ray bright, clusters. We report on the recent progress of this cluster study below.
2 The Viper Sunyaev-Zel’dovich Survey
The Viper Sunyaev-Zel’dovich Survey (VSZS) aims to collect SZE, X-ray and weak lensing data for a complete sample of X-ray clusters. The aims of the VSZS include a thorough investigation into systematic biases associated with the computation of the Hubble Constant from SZE measurements. We will also explore the physical origin of small scale X-ray surface brightness and/or temperature fluctuations in the clusters. By comparing ACBAR and X-ray data in those regions, we should be able to distinguish between contact discontinuities and shocks in the intracluster gas. Moreover, with access to high quality X-ray, SZE and weak lensing data, we can measure masses (both total and baryonic) for the VSZS clusters in a variety of ways. We can therefore predict the accuracy to which future SZE or X-ray surveys will be able to measure cluster masses from a single observable such as SZE signal or X-ray luminosity. These surveys will be based on new X-ray data (e.g. the XMM Cluster Survey, Romer et al. 2001) and new SZE facilities (e.g. the ACBAR Blind Survey, Runyan 2002; the Planck Satellite, White 2003; the SZ Array and the South Pole 8m telescope, Carlstrom et al.. 2003). Their success will be determined by their ability to measure the evolution in the cluster number density as a function of halo mass.
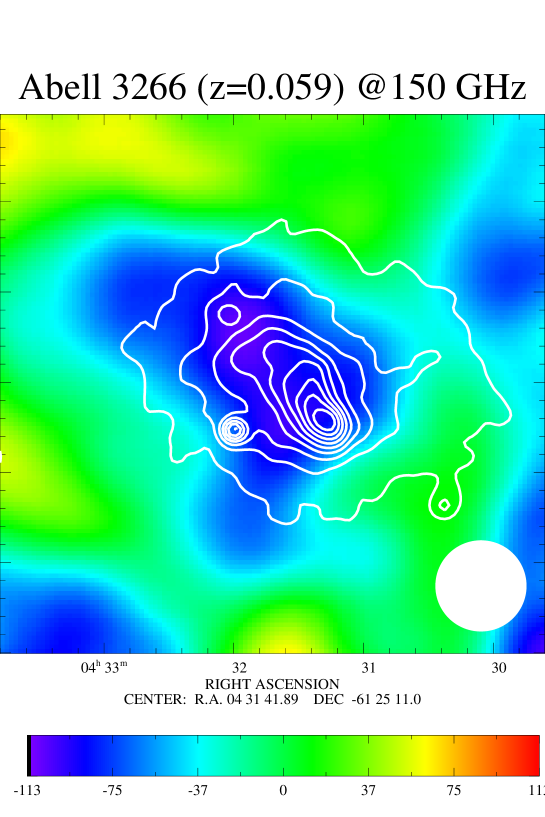
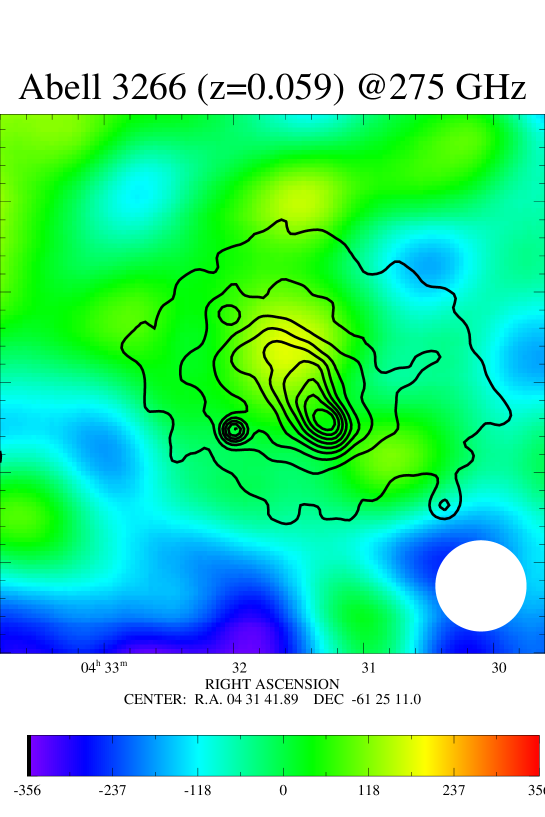
All our scientific goals require that we remove signals due to CMB primary anisotropies from our cluster images. For the low redshift clusters in our sample (see below for a list) we are able to use the three ACBAR observing frequencies (150, 220, 275 GHz) to remove the CMB. Intuitively, this method is very simple as it can be shown that at 150 GHz we detect the CMB minus the cluster thermal SZE signal, at 220 GHz we detect just the CMB, and at 275 GHz we detect the CMB plus the cluster signal. In practice, we construct a linear combination of the 150, 220 and 275 GHz that maximizes the contrast of the SZE over the CMB and noise. For the higher redshift clusters in our sample, we can use spatial filtering to make CMB free maps at both 150 and 275GHz; the CMB anisotropy power spectrum peaks on degree scales whereas the high redshift clusters cover only a few square arcminutes (see Figures 4 and 5).
The VSZS cluster sample comprises of two subsamples. The low redshift subsample contains the seven clusters in the REFLEX cluster catalog (Bohringer et al. 2001) that are brighter than (0.1-2.4 keV), have declinations less than and redshifts less than ; Abell 3367, A3827, A3266, A3112, A3158, A3921 and A3911. The high redshift subsample currently111We plan to extend this sample to include lower luminosity REFLEX clusters, ACBAR Blind cluster candidates and southern MACS (Ebeling et al. 2000) clusters during the 2003 & 2004 seasons. contains the three REFLEX clusters with , and ; Abell S1063, 1E0657-56 and AS520. To date, all but A3921 and A3911 have been observed with ACBAR and all but AS1063 and A3911 have been observed with XMM and/or Chandra. Weak lensing observations from the Mosaic camera on the CTIO 4m Blanco telescope are also available for all clusters bar AS1063 and A3112.
3 Imaging VSZS Clusters with ACBAR
To build up an image of a cluster using ACBAR one uses a raster scan technique. The sixteen instrument beams are swept across the sky in co-elevation (which is essentially co-declination at the South Pole) using a flat tertiary mirror. The tertiary mirror chops back and forth by up to 3 degrees in a fraction of a second (0.7 Hz in 2001 and 0.3 Hz in 2002). After a certain number (84 in 2001 and 36 in 2002) of chopper cycles, the elevation is shifted slightly and the process repeated. During 2001, we experimented with a variety of different cluster mapping strategies. For the 2002 cluster observations, we adopted a single strategy. For each cluster we created square maps by setting the chopper throw to 1.5 degrees and using 90 one arcminute elevation shifts.
As part of every cluster observation we made observations of leading and trailing fields. These “lead” and “trail” observations were interleaved with the “main” observations. At any given elevation setting, the observing time in the lead and trail fields was set to half of that in the main field. Typically, the main would be observed for 60 seconds and the lead and trail for 30 seconds each. These observations were used during the data analysis to remove chopper synchronous offsets. These offsets originate from non-astronomical sources of microwave radiation such as the sky, the ground and the telescope optics.
The data from each bolometer element is stored as a time stream of voltages. To create maps from these time streams, we first bin the data by chopper position and then subtract the chopper synchronous offset. Next, we convert from units of voltage (as a function of chopper position and elevation) to temperature (as a function of celestial coordinates) using the instrument calibration and telescope pointing models. At this stage, certain scans are discarded because they have anomalously high chopper synchronous offsets. This is an indication of snow accumulation on the mirrors; snow boosts the offset signal and attenuate the astronomical signal and makes it very hard to maintain an accurate calibration. Finally all the scans at a certain frequency are projected onto a template grid of the sky so they can be co-added in a noise weighted fashion to produce a fully sampled image.
4 ACBAR Cluster Images
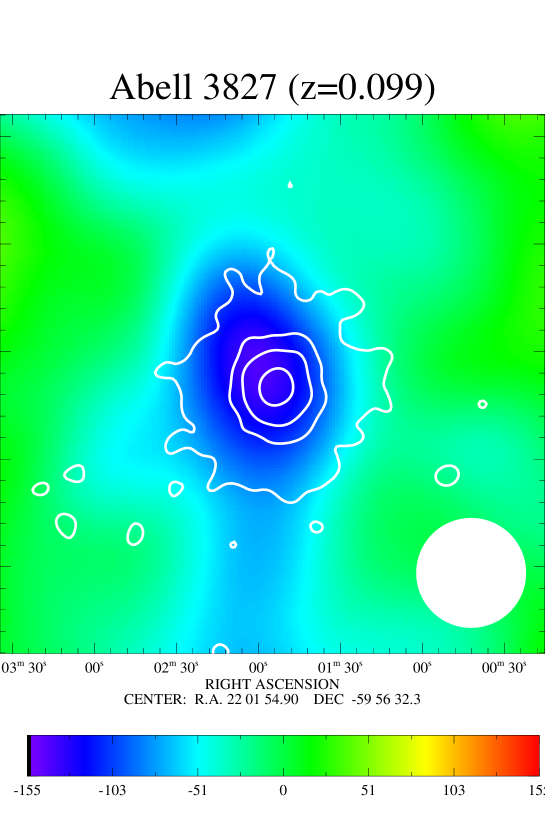
In Figures 1 through 5 we present ACBAR images of four VSZS clusters; Abell 3266, Abell 3827, Abell S1063 and 1E0657-56. The clusters are presented in order of increasing redshift, from A3266 at to AS1063 at . Figure 2 shows a 275 GHz image of A3266. In this image, the cluster shows up as a hot region, as expected because we are observing at at frequency above the null in the thermal SZE spectrum. All the other Figures show 150GHz images. In these, the cluster appears as a cold region (150GHz lies below the thermal null). The ACBAR beam size (FWHM) is indicated by a solid white circle in the bottom right corner of each image. To illustrate how the X-ray and SZE properties of these clusters compare, we have overlaid ROSAT X-ray surface brightness contours on the ACBAR images. For A3266, A3827, 1E067-56 the contours are based on data from the ROSAT pointing archive; a 13ks PSPC observation, a 13ks HRI observation and a 58ks HRI pointing respectively. The contours on Figure 5 represent ROSAT All-Sky Survey data (ROSAT pointing data are not available for AS1063).
A more detailed analysis of the SZE and X-ray observations of these, and other ACBAR, clusters will be presented in Gomez et al 2003 (in preparation).
Acknowledgments
The ACBAR collaboration comprises of P.A.R. Ade, J.J. Bock, C.M. Cantalupo, M.D. Daub, J.H. Goldstein, W.L. Holzapfel, C.L. Kuo, A.E. Lange, M. Lueker, M. Newcomb, J.B. Peterson, C. Reichardt, J.E. Ruhl, M.C. Runyan and E. Torbet. We acknowledge the REFLEX collaboration for providing the redshift for AS1063 pre-publication. We thank William Chase for assistance with data reduction. AKR and PLG acknowledge financial support from the NASA LTSA grant NAG5-7926. Computer equipment for this project was purchased using two AAS small research grants. Additional computing resources were kindly made available to us by the PICA group (picagroup.org). ACBAR has been supported by the NSF Center for Astrophysics Research in Antartica and by NSF grants OPP-8920223 and OPP-0091840.
References
- [1] Böhringer, H. et al. 2001, A&A, 369, 826
- [2] Carlstrom, J. E., Holder, G. P., & Reese, E. D. 2002, ARA&A, 40, 643
- [3] Goldstein, J. H. et al. 2003, ApJ in press (astro-ph/0212517)
- [4] Kuo, C. L. et al. 2003, ApJ in press (astro-ph/0212289)
- [5] Peterson, J. B. et al. 2000, ApJ , 532, L83
- [6] Peterson, J. B., Radford, S. J. E., Ade, P. A. R., Chamberlin, R. A., O’Kelly, M. J., Peterson, K. M., & Schartman, E. 2003, ApJ in press (astro-ph/0211134)
- [7] Romer, A. K., Viana, P. T. P., Liddle, A. R., & Mann, R. G. 2001, ApJ , 547, 594
- [8] Runyan, M. C. 2002, PhD Thesis, Caltech.
- [9] Runyan, M. C. et al. 2003, ApJ in press (astro-ph/0303515).
- [10] Spergel, D. N. et al. 2003, ApJ submitted (astro-ph/0302209)
- [11] Sunyaev, R.A. & Zel’dovich, Ya. B., 1972, Comm. Astrophys. Sp. Phys., 4, 173.