Dark Matter in Dwarf Galaxies: High Resolution Observations
Abstract
We present observations and analysis of rotation curves and dark matter halo density profiles in the central regions of four nearby dwarf galaxies. This observing program has been designed to overcome some of the limitations of other rotation curve studies that rely mostly on longslit spectra. We find that these objects exhibit the full range of central density profiles between (constant density) and (NFW halo). This result suggests that there is a distribution of central density slopes rather than a unique halo density profile.
Radio Astronomy Laboratory and Department of Astronomy, University of California at Berkeley, 601 Campbell Hall, Berkeley, CA 94720, USA
1. Introduction
The last few years have seen a flurry of activity in the field of precision measurements of central density profiles in dark matter halos, as demonstrated elsewhere in these proceedings. Most of this activity has concentrated on addressing two questions: is there a unique central density profile slope?, and, more to the point, do the measurements agree with the predictions of the simulations? In fact, the observations appear to point to a substantial disagreement between the central density profiles measured in low mass, low surface brightness dwarf galaxies (e.g., de Blok et al. 2001) and the predictions of most Cold Dark Matter simulations (e.g., Navarro, Frenk, & White 1996, hereafter NFW; Moore et al. 1999; Jing & Suto 2000). The significance of this discrepancy, however, is a matter of debate. Some authors ascribe it to intrinsic systematic problems in the observations, which conspire to poorly constrain the central density slopes (e.g., Swaters et al. 2003a), while others acknowledge these problems but argue that the data provide strong enough constraints to rule out universal slopes as steep as those predicted by the simulations (e.g., de Blok, Bosma, & McGaugh 2003).
Can observations be used to test the predictions of cosmological simulations? In the current era of “precision cosmology” the answer should be most emphatically yes! Close attention needs to be paid to the potential systematic effects, however, in order to minimize their importance. In this paper we present a series of studies of high resolution velocity fields of dwarf galaxies which we have designed to remove as much as possible the impact of systematic uncertainties. Our overall conclusion is that (as also suggested by de Blok et al. 2003) these objects appear to exhibit a range of central density profiles rather than a unique value. The discrepancy between observations and simulations is thus real, and perhaps related to the absence of baryons and their related astrophysics in the simulations (although other explanations are also possible; e.g., Ricotti 2003). In this regard, these observations should be taken as a reality check on future simulations that incorporate all the physics relevant on the small spatial scales.
2. Experimental Design
Several systematic problems have been identified in the literature as potential causes of artificially shallow central density profiles. A problem that plagued several earlier studies based on HI observations was the lack of angular resolution and the consequent smearing of the possible central density cusp. To avoid this pitfall, and to attain the best possible angular and spatial resolution, our program targets nearby dwarf galaxies with a combination of high resolution millimeter interferometry (obtained at BIMA) and optical spectroscopy. The use of two wavelengths allows us to avoid the limitations inherent to one or another tracer: because CO emission is faint and patchy, millimeter CO interferometry is signal–to–noise limited and can only be used on a few objects. However, it does provide 2D velocity fields and it is positionally extremely accurate. Conversely, H spectroscopy can be adversely affected by obscuration and positioning problems. In particular, incorrect or inaccurate slit positioning in longslit spectra can cause artificially flat rotation curves. To overcome this problem we acquire integral field H spectroscopy of our targets using the DensePak multifiber spectrograph at the WIYN telescope. To increase the positional accuracy of the resulting H velocity field we cross–correlate the integrated intensity from the individual DensePak footprints with a narrow–band H image of the target. The 2D spectroscopic data allows us to study in detail the kinematics of the galaxies, and in particular to look at the harmonic decomposition of the velocity field in order to characterize their noncircular motions. Finally, we use multiband optical and near–IR photometry to model and remove the contribution of the stellar disk to the overall kinematics.
Once the velocity fields are obtained, the data analysis proceeds as follows. The galaxy is deprojected and divided in concentric tilted rings, with center, position angle, and axis ratio determined using the available multiband photometry. A function of the form (where is the deprojected position angle measured from the major axis) is fitted to each ring, representing the effects of the systemic, circular, and radial velocities. After making sure that the kinematics traced by the radio and optical data agree, both datasets are combined to obtain an overall velocity field.
A crucial part of any rotation curve study is to quantify the errors, which have direct bearing on the strenght of the constraints placed on the shape of the density profile. We use bootstrap simulations to estimate the final errors in the center position, position angle, and inclination of the galaxy; these errors then are obtained from the data itself, and not derived from the fitted uncertainties of the individual velocity measurements which can be unrealistically small. Finally, a Monte Carlo simulation with the actual velocity field and these errors as input parameters is used to determine the final uncertainties in the individual points of the rotation curve. The rotation curve thus produced is the starting point of the kinematic study.
The azimuthally averaged IR photometry of the galaxy is used to model the potential of an infinitely thin stellar disk using Toomre’s method. The circular velocity due to this disk is then subtracted in quadrature from the measured rotation curve. The mass–to–light ratio of the stellar disk can in principle be obtained from the colors of the stellar population, either via population synthesis models (such as the popular Starburst99), or using empirical relationships (e.g., Bell & de Jong 2001). Similar procedures are followed to estimate the contributions of the gaseous disk to the rotation, when data are available. The rotation curve obtained after removing the disk contributions is used to obtain the dark matter density profile. The density profiles quoted here assume spherical halos.
3. Results
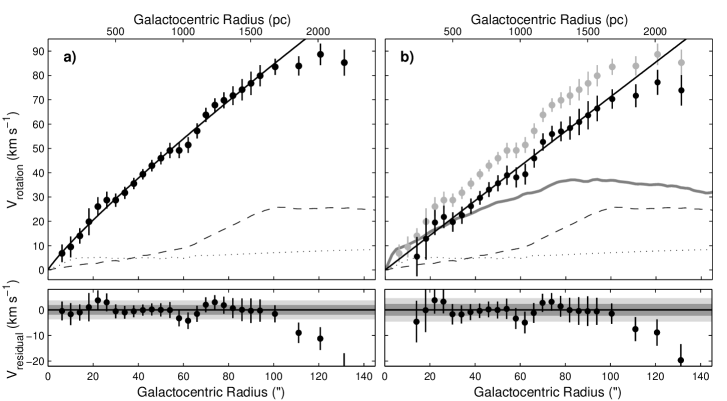
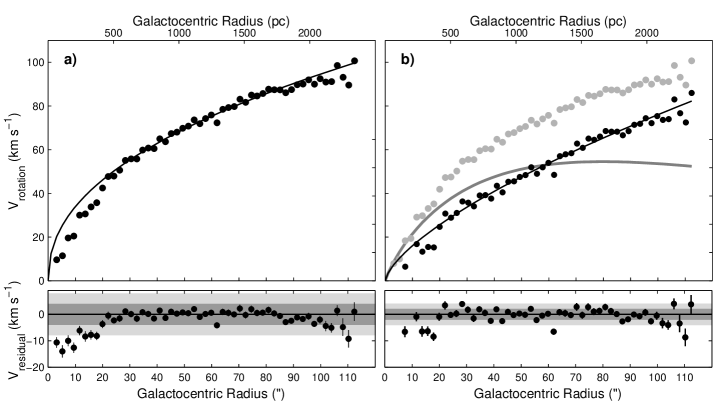
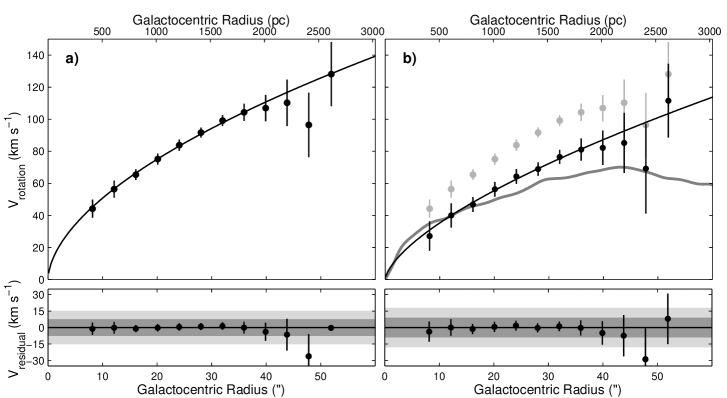
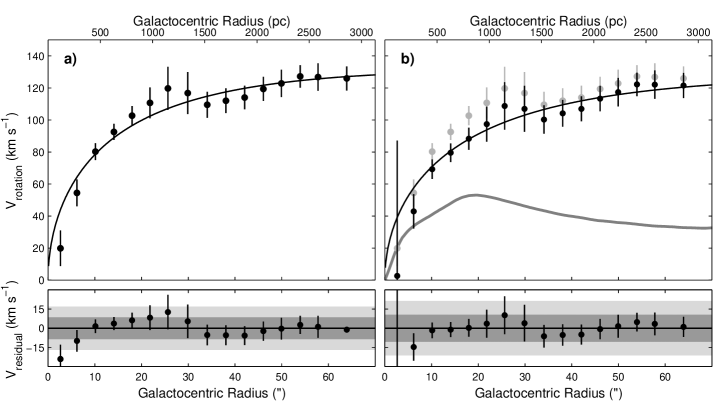
We have completed the type of study described above in five nearby dwarf galaxies: NGC 2976 (Simon et al. 2003; Fig. 1), NGC 4605 (Bolatto et al. 2002; Fig. 2), NGC 5949 (Fig. 3), NGC 5963 (Fig. 4), and NGC 4625. The latter galaxy is part of an interacting pair with the associated problems in interpreting its velocity field (in hindsight, a poor choice). In the other four cases, however, we have been able to measure central density profiles. Two of these galaxies (NGC 2976 and NGC 4605) have measurable terms that are usually associated with the presence of bars. Analysis of the multicolor images, surface photometry, and higher order harmonic decomposition of the kinematics of NGC 2976, however, show no evidence for a bar. The radial motions in NGC 4605 are comparatively less important, and it appears unlikely that it hosts a bar (because of its higher inclination, however, this case is less clear than that of NGC 2976). Neither NGC 5949 nor NGC 5963 show measurable radial motions ( km s-1), although from the images the latter may contain a small bar.
4. Conclusions
The four galaxies in this series of studies for which we were able to retrieve reliable central density profiles appear to span the full range of behaviors; from constant density cores to NFW halos. In particular, the data for NGC 2976 clearly do not allow an NFW halo. Because we have tried to eliminate most of the systematics present in this type of measurement, we believe that this range of central density slopes is real and reflects an underlying distribution, although the caveats associated with a small sample certainly apply. To study this distribution we plan to expand the sample of observed galaxies to 10–15 objects in the near future. This larger sample will also allow us to look for correlations between central density slopes and other parameters, such as galaxy mass or the magnitude of noncircular motions.
Perhaps the most important conclusion, however, is that measurements of the central density profiles of dwarf galaxies can be accurate. Multiwavelength imaging spectroscopy is key to minimize the vulnerability of these observations to potential systematic problems, such as erroneous positioning of the spectrograph slit. At the same time, 2D high–resolution data also provides a wealth of kinematic information that would be otherwise unavailable.
Finally, the presence of measurable radial motions in two out of the four galaxies studied presents a bit of a mystery; are we observing the remnants of the processes that erased the original central cusps? There does not appear to be a clear link to asymmetries or bars in our small sample, and maintaining such motions over long time periods appears very difficult in these small objects. Furthermore, it is unclear what the effect of these motions is on the inversion the rotation curve to obtain the density profile (we explicitly assumed that they provide no “support”, which is equivalent to ignoring them). Expanding the sample of studied objects will allow us to determine how general this phenomenon is.
References
Bell, E. F., & de Jong, R. S. 2001, ApJ, 550, 212.
de Blok, W. J. G., McGaugh, S., Bosma, A., & Rubin, V. 2001, ApJ, 552, L23
de Blok, W. J. G., Bosma, A., & McGaugh, S. 2003, MNRAS, 340, 657.
Bolatto, A. D., Simon, J. D., Leroy, A., & Blitz, L. 2002, ApJ, 565,238.
Jing, Y. P., & Suto, Y. 2000, ApJ, 529, L69
Moore, B., Quinn, T., Governato, F., Stadel, J., & Lake, G. 1999, MNRAS, 310, 1147
Navarro, J. F., Frenk, C. S., & White, S. D. M. 1996, ApJ, 462, 563.
Ricotti, M. 2003, MNRAS, 344, 1237.
Simon, J. D., Bolatto, A. D., Leroy, A., & Blitz, L. 2003, ApJ, 596, 957.
Swaters, R. A., Madore, B. F., van den Bosch, F. C., & Balcells, M. 2003a, ApJ, 583, 732.