UBVI photometry of the intermediate age open cluster NGC 6939
Abstract
We present CCD photometry of the nearby, intermediate age open cluster NGC 6939. Using the synthetic Colour - Magnitude Diagrams technique we estimate the following parameters: age between 1.3 and 1.0 Gyr (depending on whether or not overshooting is considered), reddening 0.34 0.38 and distance modulus 11.3 11.4.
keywords:
Hertzsprung-Russell (HR) diagram – open clusters and associations: general – open clusters and associations: individual: NGC 69391 Introduction
A vast amount of information on the formation and evolution of our Galaxy can be gathered from the study of open clusters (OCs). In particular, old OCs may be useful to derive information not only on the present day situation, but also on the time evolution of the disc, since their ages cover the whole existence of the disc, reaching to about 10 Gyr (Friel 1995). In order to fully exploit the information provided by OCs we must derive for them in a homogeneous way: accurate absolute ages (and a consistent age ranking), distances, reddenings, and metal content. With this aim we are studying a number of old OCs (see Bragaglia & Tosi 2003 and Sandrelli et al. 1999 for references), and we now add another cluster to our sample.
Given its relative proximity, NGC 6939 (C2030+604) has been the target of several studies in the past: the first bibliographic entry is 80 years ago (Kustner 1923) but, surprisingly, the first CCD data appeared only in 2002 (Rosvick & Balam 2002, hereafter RB02). As usual, the cluster parameters found in literature do not agree with each other, and we present in this paper new and improved determinations for this intermediate age open cluster located at RA(2000) = 20:31:32, DEC(2000) = +60:39:00, or l = 95.88, b = 12.30.
Photometry has been previously presented by several authors, but old photographic photometry only reached about one magnitude below the main sequence Turn-Off. Mermilliod, Huestamendia, & del Rio (1994) took UBV photoelectric photometry of 37 member stars all in the red clump phase, with the intent of discriminating between different evolutionary models (with or without overshooting) by comparison with theoretical isochrones. It turned out that most of the bright stars lying in the cluster direction are indeed cluster members (their Table 1 lists only 4 non-members among 45 objects). The recent work by Rosvick & Balam (2002) has presented the first deep BVI CCD data. They used the 1.85m Dominion Astrophysical Observatory telescope, covering the central part of NGC 6939 (more or less our field A, see later). Their CMDs show considerable scatter, which they do not attribute to contamination from field stars (even if they could not prune their diagrams on the main sequence, since no proper motion survey on this cluster has reached so deep), but to differential reddening [ = 0.29 to 0.41], which also influences the distance derivation [ = 12.21 to 12.39]. Using the Girardi et al. (2000) solar metallicity isochrones, they obtain a cluster age of 1.6 0.3 Gyr
Canterna et al. (1986) give a metal abundance of [Fe/H] = –0.1 based on Washington photometry, a value confirmed by the revision of this method done by Geisler, Clariá & Minniti (1991), who give –0.13. Thogersen, Friel & Fallon (1993) determine a cluster mean radial velocity of kms-1, and [Fe/H]=–0.140.13, from low resolution spectra of four cluster giants. The metallicity has recently been revised to [Fe/H]=–0.190.09 by Friel et al. (2002). Other measures of radial velocities were given by Geisler (1988), who found based on medium resolution spectroscopy of 8 stars; by Milone (1994) who, on the basis of higher resolution spectra of 26 giants, found a mean cluster radial velocity of kms-1; and by Glushkova & Rastorguev (1991), who derived as average for 29 cluster members. These last also determined proper motions (hence membership) for 136 stars in the cluster vicinity. Zhao et al. (1985) determined membership probabilities based on proper motion for more than 200 stars in the cluster field, and we used their information to confirm the turn-off and red clump positions in our data.
Dutra and Bica (2000) cite a reddening =0.39 based on the Schlegel, Finkbeiner & Davis (1998) maps.
At least two groups used existing literature data to re-derive relevant properties. Twarog, Ashman & Anthony-Twarog (1997), in their work trying to derive on homogeneous grounds the properties of Galactic open clusters, found = 0.45 to 0.49, [Fe/H] = 0.03, distance modulus, = 12.45.111The value listed in their Table 2 is 13.05, but Bruce Twarog kindly informed us that their correct modulus is 12.45, because, due to a typo, 13.05 is actually not the modulus but the mean visual magnitude of the red clump. Carraro, Ng & Portinari (1998) derived, using the synthetic CMD techniqe with the Padova tracks and the Thogersen et al. (1993) metallicity, an age of 1.4 Gyr, and RGC = 9.7 kpc.
Finally, Robb & Cardinal (1998) tried to detect variables in this cluster and actually found six, of which at least two are eclipsing variables.
We describe our data in Section 2, and the resulting colour - magnitude diagrams in Section 3. Section 4 is devoted to the derivation of the cluster parameters, while summary and conclusions are presented in Section 5.


2 Observations and data reduction
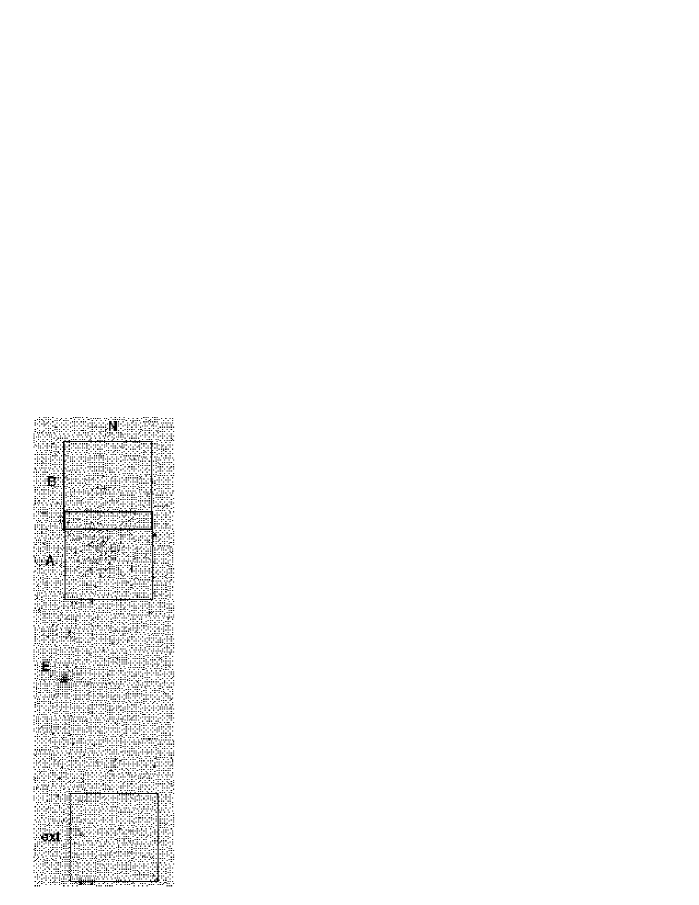
Our data were acquired at the Telescopio Nazionale Galileo, on the Canary Islands, using DOLORES (Device Optimized for the LOw RESolution), a focal reducer capable of imaging and low resolution spectroscopy, on UT 2000 November 24, 25, and 26. A few additional images of very short exposure time were kindly obtained by M. Bellazzini on UT 2001 August 17 and 18. In both cases DOLORES mounted a 2k Loral thinned and back-illuminated CCD, with scale of 0.275 arcsec/pix, and a field of view 9.4 9.4 arcmin2. We observed three fields (see Fig. 1), one centered on the cluster (field A), one slightly North of it (field B), and one about 30 arcmin away, to be used for field stars decontamination. This distance was judged reasonably safe, since the cluster diameter was given as 10 arcmin in the BDA compilation (Mermilliod et al. 1995).
In particular we used the region in common between the fields A and B to obtain a homogeneous calibration for the whole cluster sample. For each field, Table 1 lists the date of the observation together with the filters used and the corresponding ranges of exposure time (in seconds). Of the three nights, the first was photometric; seeing conditions were not optimal for the site, but were reasonable during the observations of fields A and B (1.1 to 1.8 , with a mean value around 1.4 ), and degraded (2 to 3) only for the external field, the less crowded one.
| Field | Equat. coords (2000) | UT dates | tU | tB | tV | tI |
|---|---|---|---|---|---|---|
| Field A | 20:31:31 +60:29:21 | 2000 Nov 24, 25 | 60-1200 | 600-20 | 300-60 | 300-10 |
| 2001 Aug 17 | 5-2 | 10-2 | 5-2 | |||
| Field B | 20:31:30 +60:46:51 | 2000 Nov 26 | 600-40 | 300-20 | 300-20 | |
| 2001 Aug 18 | 5-2 | 5-2 | 5-2 | |||
| external | 20:31:32 +60:09:23 | 2000 Nov 25 | 600-20 | 300-10 | 300-20 |
2.1 Data reduction
Corrections to the raw data for bias, dark and flat-fielding were performed using the standard IRAF routines. Subsequent data reduction and analysis was done following the same procedure for the three data-sets and using the DAOPHOT-ALLFRAME packages (Version 3, Stetson 1997) with a quadratically varying point spread function (PSF). In particular the deep I images of each field were used to find the objects 4 above the background; the identified candidates were measured on each of the individual I, V, B and U frames of each field. Two final catalogs including all the objects in all the filters have been created: one comprises only stars in fields A and/or B, the other only stars in the external field. As we observed with very different exposure times (see Table 1), we decided to include in our final catalog also the objects for which we had only one measure available (i.e., the brightest stars, which are saturated in all frames except the shortest ones). The objects in common between the fields A and B were used to homogenize the photometry of the cluster (computing the weighted average of magnitudes in each filter). The final cluster catalog includes 4547 objects identified in at least one filter.
2.2 Photometric calibration
We observed the standard areas PG0231+051 and Rubin 149, plus two isolated stars, G156–31 and G26–7 (Landolt 1992), several times during the two nights. The 16 stars retained in our calibrations have colours , that generally well match the ones for cluster stars, and require some extrapolation only at the red limit, i.e., for the fainter stars.
The calibration equations were derived assuming the average extinction coefficients for the site, as given in the site web pages (www.tng.iac.es: ) and are in the form:
where u, b, v, i, are the aperture corrected instrumental magnitudes, after further correction for extinction and for exposure time, and U, B, V, I are the output magnitudes, calibrated to the Johnson-Cousins standard system.
We checked our calibration in two ways. First we compared the equations with the average ones given for the site and instrument, found in the TNG web pages; they are not strictly identical, but the coefficients have the same signs and similar values. Of course when we apply the two different equation sets, we do not obtain the same magnitudes (differences are of about 0.2 - 0.3 mag for the average colours of our stars) but we did not expect more than a general agreement, and we will stick to the equations presented here, derived exactly for the nights of our observations.
Second, for 24 stars in common, we directly compared our U, B, V magnitudes with the photoelectric values given in Mermilliod et al. (1994), and results are presented in Fig. 2. No trend is present, but only a shift; in particular: ( = 0.086), ( = 0.081), ( = 0.069). We then decided to correct our magnitudes using these values; nothing could be done with I, not present in the photoelectric catalogue, but our calibration seems reasonable anyway (see the comparison with RB02 in the next Section).
Finally, we note that we did not have any problem with shutter timing, since they arise only below 0.1 seconds with this instrument, and our shortest exposure was 10 times more for the standard stars (and 20 times more for NGC 6939).
3 Data analysis
3.1 The colour - magnitude diagram
The final, calibrated sample of the cluster consists of: 3796 objects simultaneously identified in the filters V and I, 3804 objects identified in the filters B and V, and 1276 objects identified in the filters U and B. The corresponding CMDs are shown in Figs. 3 and 4, where the mean errors per interval of magnitude are also plotted.
The CMDs show: i) a very clear MS extending down to V 24, nearly 5 mag deeper than the only previous CCD photometry (see RB02); ii) a prominent red giant clump, including 40 stars. What we claim is a fairly well defined White Dwarf (WD) cooling sequence extending down to V 23.5.
In principle, the WD cooling sequence may be used to get information about a number of astrophysical questions. Stellar evolution theory predicts that all single stars having a MS mass lower than 8 M⊙ end their lives as WDs. Cluster WD cooling sequences could be thus used to give an estimate of the initial mass - final mass relationship between the stellar progenitor mass from near 8 M⊙ to the current-day TO mass, and thus about the amount of mass lost from stars during their evolution through stellar winds and planetary nebula ejection. Since the WDs cool at a well-known rate, their cooling sequence may also be used to estimate the cluster age.
However, to use WDs as age estimators one needs a) a large sample of WDs to define the WD luminosity function sufficiently well and estimate the turndown of the WD luminosity function with a precision equivalent to a Gyr of cooling time; b) to separate the cluster WDs from the very high number of blue galaxies mixing with WDs at such faint magnitudes. By looking at the WDs cooling sequence appearing in the NGC 6939 CMDs it is evident that, in our case, it is not well enough sampled and well defined down to the faint end to use this feature of the CMD as an age estimator.
From the CMDs a contamination from field stars is also evident, especially in the fainter parts. In order to account for field stars contamination, we used data from the field observed far enough from the cluster so that the contamination by cluster members - if any - is minimal. Figure 5 shows the V, V-I and V, B-V CMDs for 1007 objects simultaneously identified in the filters I and V (left panel) and 1029 in the filters B and V (right panel) for our external field.
Ideally, one would like to eliminate the contamination from the stars of the galactic field using the information contained in the proper motions of the stars. Unfortunately, no proper motion survey to date reaches the faint limits required to completely clean our CMD’s, but we can at least obtain information on the bright part and isolate bona fide cluster TO and red clump stars. To do that, we identified 119 objects in common with the catalog of Zhao et al. (1985), that gives membership probabilities according to proper motion. The results are shown in Fig. 6 where filled points represent the objects of our catalog for which the probability to be a member of the cluster is 0.9.


3.2 Completeness analysis
Incompleteness factors were determined for each field by carrying out artificial star tests separately on all the , , and frames, in order to be able to estimate the overall completeness of our final CMD.
Artificial stars were first added randomly to the , , and images taken as reference in the original photometry. We followed the observed luminosity function to define the artificial stars magnitudes, paying attention to add only a few percent ( 10 ) of the total number of stars actually present in the corresponding magnitude bin to avoid a significant enhancement of the image crowding. Then the same stars were added to the other , , and frames in the same positions of the reference frames, and with the same magnitudes. Finally, all frames were treated with the same analysis adopted for the original ones, and for each filter and in each magnitude bin a final catalog of artificial stars has been created.
If a star in the output catalog was found with output values consistent with the input ones ( pixel, 0.75), it was added to the list of recovered objects. The ratio of the recovered over added stars, = Nrec/Nadd (the completeness factor) was then derived after 12 to 15 trials for each filter and each magnitude bin, for a total of about 12000 artificial stars. The estimated completeness factors for the three fields are listed in Table 2. The quite different completeness fractions found for the central fields and the external one are due to the seeing: we observed the external field in much worse seeing conditions.
| Field A | Field B | External | |||||||||||
|---|---|---|---|---|---|---|---|---|---|---|---|---|---|
| U | B | V | I | cU | cB | cV | cI | cB | cV | cI | cB | cV | cI |
| 15.01 | 16.99 | 16.03 | 15.71 | 1.00 | 1.00 | 1.00 | 0.98 | 1.00 | 1.00 | 1.00 | 1.00 | 1.00 | 1.00 |
| 15.51 | 17.49 | 16.53 | 16.21 | 0.98 | 1.00 | 1.00 | 0.96 | 1.00 | 1.00 | 1.00 | 1.00 | 1.00 | 1.00 |
| 16.01 | 17.99 | 17.03 | 16.71 | 1.00 | 0.90 | 0.92 | 0.98 | 0.90 | 0.90 | 1.00 | 0.90 | 1.00 | 0.97 |
| 16.51 | 18.49 | 17.53 | 17.21 | 0.98 | 0.88 | 0.94 | 0.99 | 0.90 | 0.96 | 1.00 | 0.80 | 1.00 | 0.98 |
| 17.01 | 18.99 | 18.03 | 17.71 | 1.00 | 0.86 | 0.96 | 0.96 | 0.88 | 0.98 | 0.99 | 0.88 | 0.98 | 0.92 |
| 17.51 | 19.49 | 18.53 | 18.21 | 1.00 | 0.86 | 0.94 | 0.94 | 0.90 | 1.00 | 0.98 | 0.82 | 0.97 | 0.96 |
| 18.01 | 19.99 | 19.03 | 18.71 | 0.90 | 0.83 | 0.96 | 0.95 | 0.90 | 0.99 | 0.94 | 0.80 | 0.86 | 0.86 |
| 18.51 | 20.49 | 19.53 | 19.21 | 0.95 | 0.80 | 0.94 | 0.92 | 0.88 | 0.98 | 0.98 | 0.85 | 0.93 | 0.96 |
| 19.01 | 20.99 | 20.03 | 19.71 | 0.99 | 0.84 | 0.89 | 0.88 | 0.90 | 0.97 | 0.97 | 0.81 | 0.90 | 0.82 |
| 19.51 | 21.49 | 20.53 | 20.21 | 0.97 | 0.78 | 0.95 | 0.86 | 1.00 | 0.99 | 0.93 | 0.77 | 0.87 | 0.72 |
| 20.01 | 21.99 | 21.03 | 20.71 | 0.87 | 0.77 | 0.95 | 0.75 | 0.84 | 0.96 | 0.94 | 0.73 | 0.65 | 0.51 |
| 20.51 | 22.49 | 21.53 | 21.21 | 0.89 | 0.83 | 0.95 | 0.59 | 0.89 | 0.93 | 0.83 | 0.61 | 0.58 | 0.25 |
| 21.01 | 22.99 | 22.03 | 21.71 | 0.66 | 0.79 | 0.89 | 0.30 | 0.85 | 0.88 | 0.62 | 0.44 | 0.46 | |
| 21.51 | 23.49 | 22.53 | 22.21 | 0.50 | 0.62 | 0.78 | 0.84 | 0.95 | 0.22 | 0.22 | 0.23 | ||
| 22.01 | 23.99 | 23.03 | 23.71 | 0.29 | 0.43 | 0.63 | 0.66 | 0.80 | |||||
3.3 Comparison with RB02
NGC 6939 has three photographic photometries published, and only one CCD (RB02). We have compared our B, V, I values with the last one, since it is the most recent and deepest one. We have cross-identified stars in the two catalogues using a software written by P. Montegriffo at the Bologna Observatory, and found 540 objects in common. The comparison of ours and their magnitudes shows that no obvious trend is present over the whole magnitude range. The magnitude differences between the two catalogues (discernible only at the bright ends) range between 0.013 and 0.020, which is about the size of our photometric errors (see Fig. 7).
RB02 find indications of differential reddening for this cluster (see Introduction), but from our data we cannot confirm it. To look for this effect we have divided the central field into 9 parts (about 700 700 pixel each) and plotted the relative CMDs. Of course the number of stars is quite small except for the very central part of the cluster, but we find that the TO position seems to be the same in all cases, both in magnitude and colour. If differential reddening is present, it is not at the level claimed by RB02. Furthermore, also the synthetic CMDs do not support this hypothesis (see Section 4).

4 Cluster parameters
Age, reddening and distance of NGC 6939 have been derived applying the synthetic CMD method (Tosi et al. 1991) to the empirical CMD obtained from the photometry described above. The best values of the parameters are found by selecting those providing synthetic CMDs with morphology, number of stars in the various evolutionary phases and luminosity functions (LF) in best agreement with the empirical ones.
As already done in the previous papers of this series (Bragaglia & Tosi 2003, Di Fabrizio et al. 2001, Sandrelli et al. 1999 and references therein), to estimate the error on the parameters resulting from the intrinsic uncertainties on stellar evolution theory, the method has been applied adopting various sets of stellar models, computed by different groups with different assumptions. Since the metallicity attributed to NGC 6939 ranges between solar and slightly sub-solar (see Introduction), we have computed the synthetic CMDs assuming various metallicities to check which ones provide stellar distributions (i.e. morphology and number counts) in the CMD in best agreement with the data. The adopted sets of stellar tracks are listed in Table 3, where the corresponding references are also given, as well as the model metallicity and the information on whether or not they take overshooting from convective zones into account.
| Set | metallicity | overshooting | Reference |
|---|---|---|---|
| BBC | 0.02 | yes | Bressan et al. 1993 |
| BBC | 0.008 | yes | Fagotto et al. 1994 |
| FRA | 0.02 | no | Dominguez et al. 1999 |
| FRA | 0.01 | no | Dominguez et al. 1999 |
| FST | 0.02 | =0.02 | Ventura et al. in prep. |
| FST | 0.02 | =0.03 | Ventura et al. in prep. |
| FST | 0.006 | =0.02 | Ventura et al. in prep. |
| FST | 0.006 | =0.03 | Ventura et al. in prep. |
The FST models have been kindly provided in advance of publication. A description of the corresponding stellar evolution code and assumptions is given by Ventura et al. (1998).

Having proper motion information (Zhao et al. 1985) on the cluster membership only for 119 relatively bright stars, to maximize the probability of examining only likely members, we have considered only the stars located within a 6 radius from the cluster centre. Since the external field, observed for background/foreground decontamination, has a magnitude limit of V=22, we have also limited the simulations to stars brighter than this magnitude. The corresponding observational CMDs adopted for the comparison with the synthetic ones are shown in Fig. 8. Of these 1439 stars, 638 are considered cluster members because they are located on the MS, TO, subgiant and clump regions of the CMD.
The synthetic CMDs therefore contain 638 stars down to V=22, extracted with a MonteCarlo procedure from the adopted sets of stellar evolution tracks and selected according to the B, V and I completeness factors listed in Section 3.2. To these stars we attributed the same photometric errors as the actual data. The transformations from the theoretical luminosity and effective temperature to the Johnson-Cousins magnitudes and colours have been performed using Bessel, Castelli & Pletz (1998) conversion tables and assuming = 1.25 (Dean et al. 1978) for all the sets of models. Hence the different results obtained with different stellar models are only attributable to the models themselves and not to the photometric conversions.
In all cases we have found a small internal inconsistency between the B–V and V–I colours. When the observed B–V colours are reproduced, the synthetic V–I are systematically too blue by about 0.02. This problem is not solved by adopting different / ratios. The turn-off B–V colours can be brought into perfect agreement with the V–I ones if one considers that reddening is not the same for all stars but depends on their colour (e.g. Twarog, Ashman & Anthony-Twarog 1997). However, the dependence suggested by Fernie (1963) and adopted by Twarog et al. leads to a steepening of the synthetic main-sequence (MS) that makes the MS shape and the colours of its faint stars too blue and even more inconsistent with the data. On the other hand, it is very likely that the colour offset is simply due to the circumstance that the calibration of our I frames is less robust than that in the other bands, because there were no photoelectric measurements available in I. In the selection of the best cluster parameters, we then give higher weight to the V, B–V diagrams than to the V, V–I ones, and to the upper MS and clump regions than to the lower MS (disagreement between this last and the theoretical predictions is not uncommon, see next Section).
The synthetic CMDs have been computed either assuming that all the cluster stars are single objects or that a fraction of them are members of binary systems with random mass ratio. We find that a binary fraction around 30% well reproduces the observed distribution and spread of the cluster upper main sequence. The lower main sequence of the synthetic diagrams comes out systematically thicker than the observed one, but this inconsistency is independent of the assumed fraction of binaries and seems rather to suggest that we have overestimated the photometric errors at faint magnitudes. Vice versa, the TO and clump regions of the synthetic CMDs are always tighter that the observed ones. This is partially ascribable to field contamination and, as far as the clump is concerned, to variable mass loss rates affecting the actual stars and not included in the simulation code.
We have checked the suggestion by RB02 of a significant differential reddening. Synthetic CMDs (with or without binaries) are consistent with the observed MS width only if 0.03. Beyond this difference the MS widens too much and the TO region splits into separate portions.
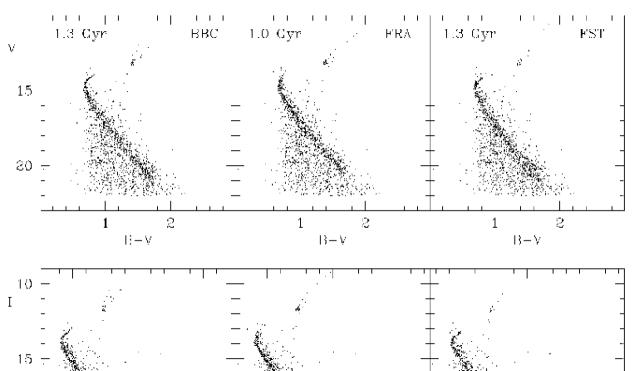
The best synthetic CMDs are chosen on the basis of the morfology and the number counts of the various evolutionary phases ( e.g. MS slope, TO and clump shape, luminosity functions). The synthetic CMDs in best agreement with the data for each source of stellar models are shown in Fig. 9, where the plotted stars are the 638 synthetic ones (30% of which in binary systems) plus the 801 stars of the external field of equal area and mag limit. These models are computed without differential reddening. The adoption of = 0.03 would simply widen their TO region, leaving them in agreement with the data. Fig. 10 presents an example of the observed and synthetic luminosity functions (LFs): it compares the V band LF corresponding to the top left-hand panel CMD of Fig. 9 with that derived from the reference CMD of Fig. 8. Similar LFs have been obtained for the other synthetic CMDs consistent with the data. It is apparent that the synthetic LF is consistent with the observational one, but not in perfect agreement. However, the differences (at bright magnitudes) are completely ascribable to the observed blue stars brighter than the turn-off, either blue-stragglers or non members not present in our external field.
All the cases in best agreement with the data turn out to have solar metallicity. For the different sources of stellar tracks the best combination of parameters is: age 1.3 Gyr, distance modulus = 11.3 and reddening = 0.34 for the BBC models; age 1.3 Gyr, = 11.4 and = 0.36 for the FST models with =0.02; age 1.0 Gyr, = 11.3 and = 0.38 for the FRA models. Bearing in mind that the former two sets of tracks take overshooting into account while the latter does not, and that overshooting makes stellar models brighter, the resulting ages are perfectly consistent with each other. The FST models with larger overshooting, =0.03, provide older ages (1.5 Gyr) and do not reproduce equally well clump and upper main sequence.
By considering all the involved uncertainties, we thus assign to NGC 6939 an age of 1.3 0.1 Gyr or 1.0 0.1 Gyr (depending on whether or not overshooting should be assumed), a reddening of 0.34 0.38 and a distance modulus of 11.3 11.4.
Models with increasingly lower metallicity predict turn-off shapes and main sequence slopes increasingly different from the observed ones. For this reason, even if the solar metallicity models are not perfect either, we do not consider adequate enough those with Z0.01. This result is consistent with the literature abundances quoted in the Introduction, corresponding to 0.012 Z 0.019.
5 Summary and discussion
We have examined UBVI CCD data of the open cluster NGC 6939, and determined its distance, reddening, age and (approximate) metallicity making use of the synthetic CMDs technique and three different sets of theoretical tracks. We found that the best combination of the cluster parameters is: solar abundance, 0.34 0.38, 11.3 11.4, 1.0 Gyr age 1.3 Gyr. We also found indication of the presence of binary systems.
Our findings do not agree completely with literature data, although quite similar in some cases (see Introduction). For instance, when comparing with RB02, we do not find a substantial differential reddening and our age is slightly lower than theirs. The age difference is likely due to the use of different versions of the Padova tracks: they adopt the Girardi et al. (2000) solar metallicity isochrones, while we prefer the older BBC tracks . This seems to be confirmed by our best concordance with Carraro et al. (1998) results, based on our same BBC tracks. Our intrinsic distance modulus is slightly larger than that (10.95) derivable from the corrected = 12.45 of Twarog et al. (1997) assuming their mean reddening = 0.47. However, if our mean reddening = 0.36 is applied to their , the resulting intrinsic modulus is 11.3, identical to ours.
Regarding the differential reddening claimed by RB02, we cannot substantiate their values. When looking at the CMDs we derive from our data (Sect. 3.3) we do not see any clear indication of its presence. Furthermore, the synthetic CMDs are able to reproduce the cluster sequences without invoking differential reddening; we think that a E(B-V) as large as suggested by RB02 would have broadened the MS much more than observed. We agree, however, that a small variation of 0.03 over the field may allow us to well reproduce the TO morphology. We suggest that the presence of a fraction around 30% of binary stars in the cluster would further improve the CMD reproduction. Indeed, the broadening effect on the MS of binaries and of differential reddening differ from each other. Binarism affects both magnitudes and colours and leads to an increasing widening of the MS towards fainter magnitudes, with the binary MS converging on the single MS at the TO region. Vice versa, differential reddening shifts the colours by the same amount at all magnitudes, thus making the effect much more evident in the brighter, tighter TO regions.
The rather poor fit of the lower MS obtained for all the models employed is not unheard of, and cannot be taken as a general failure to measure cluster properties. Very recently Grocholski & Sarajedini (2003) presented a comparative study of isochrone fits to CMDs in the visual and infrared filters. They took five sets of theoretical models, compared them in the luminosity - temperature plane, and proceeded to fit the observed CMDs of six open clusters of assorted ages and metallicities with the isochrones transformed into the observational planes. The soundness of the comparison of different evolutionary codes is probably undermined by the fact that Grocholski & Sarajedini (2003) use the isochrones as transformed from the theoretical plane (luminosity and temperature) to the observational one (magnitudes and colours) by each group, i.e. following quite different prescriptions. This introduces additional effects, which we prefer to avoid using a single transformation for all tracks. Unfortunately, we have no theoretical set in common with them (they use yet another version of the Padova tracks, by Girardi et al. 2002), but their results are quite interesting: there is no single set that is able to match all CMDs in all colours, at all ages, and for all metallicities. All of them behave rather well in some cases, and do not fit well in others. However, when the observed CMDs are deep enough, the fit to the lower main sequence is often (but curiously not always) bad; this happens in general around M 8 (the same we find for NGC 6939) for the visual colours, and is attributed by Grocholski & Sarajedini (2003) to some still missing ingredient in the model atmospheres for low mass stars.
Finally, we wish to stress that the roughly solar abundance we find for NGC 6939 is more an indication than a well founded measurement. It is encouraging that it’s in reasonable agreement with what other methods find, but high resolution spectroscopy and detailed abundance analysis should be performed to determine the cluster elemental composition.
ACKNOWLEDGEMENTS
This work is based on observations made with the Italian Telescopio Nazionale Galileo (TNG) operated on the island of La Palma by the Centro Galileo Galilei of the INAF (Istituto Nazionale di Astrofisica) at the Spanish Observatorio del Roque de los Muchachos of the Instituto de Astrofisica de Canarias. We thank M. Bellazzini for the data acquired on August 2001 and P. Ventura for the FST models. We are grateful to B. Twarog for having informed us of the correct value of their distance modulus and for having pointed out a problem of ours. The bulk of the simulation code was originally provided by L.Greggio. Financial support to this project has come from the MURST-MIUR through Cofin98 ”Stellar Evolution”, and Cofin00 ”Stellar Observables of Cosmological Relevance”. This research has made use of the Simbad database, operated at CDS, Strasbourg, France. Finally we acknowledge the use of the valuable BDA database, maintained by J.-C. Mermilliod, Geneva.

References
- [1] Bessel, M.S., Castelli, F., Plez, B. 1998, A&A, 337, 321
- [2] Bragaglia, A., & Tosi, M. 2003, MNRAS, 343, 306
- [3] Bragaglia, A., Tosi, M., Marconi, G., Di, Fabrizio L. 2002, T.Lejeune, J.Fernandez eds, Observed HR Diagrams and stellar evolution: the inteplay between observational constraints and theory, Coimbra, ASP Conf. Ser., in press
- [4] Bressan, A., Fagotto, F., Bertelli, G., Chiosi, C. 1993, A&AS, 100, 647
- [5] Canterna R., Geisler D., Harris H.C., Olszewski E., Schommer R. 1986, AJ, 92, 79
- [6] Carraro, G., Ng, Y.K., & Portinari, L. 1998, MNRAS, 296, 1045
- [7] Davis, L.E. 1994, A Reference Guide to the IRAF/DAOPHOT Package, IRAF Programming Group, NOAO, Tucson
- [8] Dawson, D.W., Ianna, P.A. 1998, AJ, 115, 1076 (DI98)
- [9] Dean, J.F., Warren, P.R., Cousins, A.W.J. 1978, MNRAS, 183, 569
- [10] Di Fabrizio, L., Bragaglia, A., Tosi, M., Marconi, G. 2001, MNRAS, 328, 795
- [11] Dominguez, I., Chieffi, A., Limongi, M., Straniero, O. 1999, ApJ, 525, 226
- [12] Dutra, C.M., Bica, E. 2000, A&A, 359, 347
- [13] Fagotto, F., Bressan, A., Bertelli, G., Chiosi, C. 1994, A&AS, 105, 29
- [14] Fernie 1963, AJ 68, 780
- [15] Friel, E.D. 1995, ARAA, 33, 38
- [16] Friel, E.D., Janes, K.A., Tavarez, M., Scott, J., Katsanis, R., Lotz, J., Hong, L., Miller, N. 2002, AJ, 124, 2693
- [17] Geisler, D. 1988, PASP, 100, 338
- [18] Geisler, D., Clariá, J.J, Minniti, D. 1991, AJ, 102, 1836.
- [19] Girardi, L., Bressan, A., Bertelli, G., Chiosi, C. 2000, A&AS, 141, 371
- [20] Girardi, L., Bertelli, G., Bressan, A., Chiosi, C., Groenewegen, M.A.T., Marigo, P., Salasnich, B., Weiss, A. 2002, A&A, 391, 195
- [21] Glushkova E.V., Rastorguev A.S. 1991, SvAL, 17, 64
- [22] Grocholski,A.J., Sarajedini, A. 2003, MNRAS, in press (astro-ph/0307503)
- [23] Janes, K.A., Phelps, R.L. 1994, AJ, 108, 1773
- [24] Kustner, F. 1923, Veroeffentlichungen der Universitaets-Sternwarte zu Bonn, 18
- [25] Landolt, A.U. 1992, AJ, 104, 340
- [26] Mermilliod, J.C. 1995, D. Egret, M.A. Albrecht, eds, Information and On-Line Data in Astronomy, Kluwer Academic Press (Dordrecht), p. 127
- [27] Mermilliod, J.-C., Huestamendia, G., del Rio, G. 1994, A&AS, 106, 419
- [28] Milone, A.A.E. 1994, PASP, 106, 1085
- [29] Robb, R.M., Cardinal, R.D. 1998, IBVS, 4634
- [30] Rosvick, J. M., Balam, D. 2002, AJ, 124, 2093
- [31] Sandrelli S., Bragaglia A., Tosi M., Marconi G., 1999, MNRAS, 309, 739
- [32] Schlegel, D.J., Finkbeiner, D.P., Davis, M. 1998, ApJ, 500, 525
- [33] Stetson, P.B. 1987, PASP 99, 191
- [34] Thogersen, E.N., Friel, E.D., Fallon, B.V. 1993, PASP, 105, 1253
- [35] Tosi, M. 2000, in The chemical evolution of the Milky Way: Stars versus clusters, F. Matteucci & F. Giovannelli eds, Kluwer Academic Publishers (Dordrecht), 255, p. 505
- [36] Tosi, M., Greggio, L., Marconi, G., Focardi, P. 1991, AJ, 102, 951
- [37] Tsarevskii,G.S., & Abakumov, I.E. 1971, Astron. Tsirk., 631, 6
- [38] Twarog, B.A., Ashman, K.M., & Anthony-Twarog, B. 1997, AJ, 114, 2556
- [39] Ventura, P., Zeppieri, A., Mazzitelli, I., D’Antona, F. 1998, A&A, 334, 953
- [40] Zhao, J., Tian K., Jing J., Yin M. Special issue for tables of membership of 42 open clusters (1985) Shangai Obs. Akademia Sinica p. 4