The Cygnus X region
From medium-resolution radio images, DR 16 was suspected to be a large cometary nebula. To test this suggestion we obtained a higher resolution (15″) VLA continuum map. We also analyzed data from the Canadian Galactic Plane Survey in continuum, H i line, and IR. These data were supplemented by published near-infrared (J, H, K) stellar photometric results and MSX 8.28 m data. We suggest that DR 16 is the diffuse H ii region of an ongoing star formation site at a distance of about 3 kpc. The complicated radio picture arises from the superposition of diffuse H ii with the remains of a giant bipolar outflow. The outflow was generated by a probable Herbig AeBe star, and the lobes are the remnants of its working surfaces. Additional ring-like features are discussed. DR 16 is part of a larger volume of space in the local spiral arm where star formation is an ongoing process.
Key Words.:
Stars: early-type – stars: emission-line, Be – ISM: general – (ISM:) H ii regions – ISM: individual objects: DR 16 – Radio continuum: ISM1 Introduction
In the direction of Cygnus X our line of sight is tangential to the local spiral arm, and the superposition of many objects makes the region one of the most complex in the sky. Although the radio emission in Cyg X is mainly thermal in origin, individual sources reveal a surprisingly rich spectrum of properties, with objects in different stages of evolution occupying volumes of space with very different star formation histories. Uncovering the nature of individual objects and establishing their distances demands extensive and thorough observations.
The most recent radio continuum surveys (Wendker et al. cx18 (1991), Paper XVIII) showed that a resolution of about 1′ begins to resolve many sources, so that observations of higher resolution will be effective in imaging their structure and uncovering their true nature. We have already studied the peculiar supernova remnant G76.9+1.0 (Landecker et al. tll1 (1993)) and the ring G79.29+0.46 around a suspected LBV (Higgs et al. lah2 (1994)).
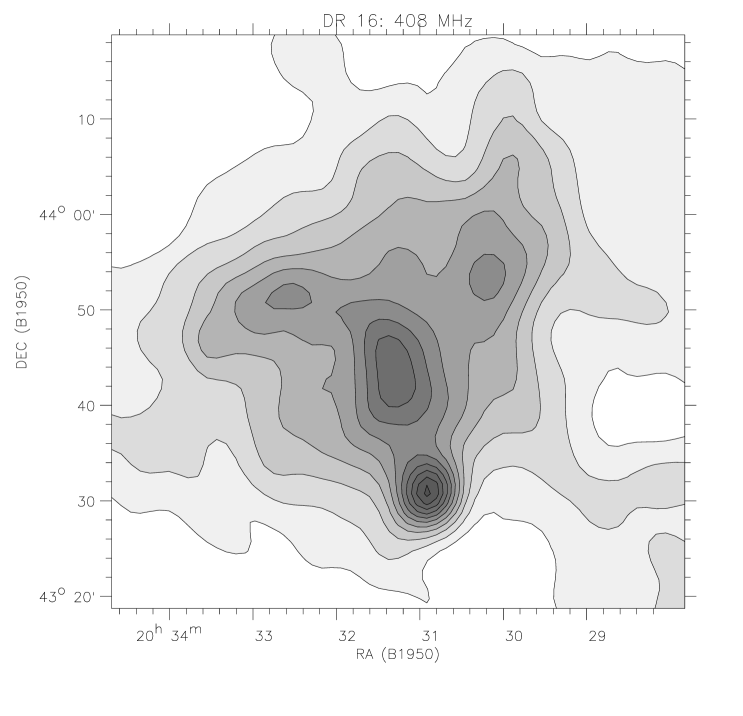
Another interesting feature is DR 16 (Downes & Rinehart dr (1966)) – G82.0+2.3 – and its surroundings. Images at 408 MHz (Paper XVIII) and 4.8 GHz (Wendker cx15 (1984), Paper XV) showed a cometary nebula. Recombination line observations at 6 cm (Piepenbrink & Wendker cx17 (1988), Paper XVII) gave nearly the same radial velocity at three positions, suggesting that the feature is one physical object, with a pronounced head and an impressive flaring tail about in length. Fig. 1 clearly conveys this impression. Nevertheless, in Paper XVIII we labelled the feature as a ridge (CXR 10). Optically only the northern part of the tail is visible in H (filaments DWB 155 and DWB 157 in the catalogue of Dickel et al. (cx5 (1969), Paper V)). Visual extinction in front of the head rises to more than (Dickel & Wendker cx11 (1978), Paper XI), totally obscuring it.
The physical picture commonly associated with the term ‘cometary nebula’ is an object moving through its surroundings and producing some sort of wake. Supersonic motion produces a bowshock object, and is not implied in this case. Since sub-sonic or mildly supersonic velocities (less than 10 km/s) do not produce large extensions, a tail of length immediately implies a very nearby object, or an exceptionally large one.
In this paper we present a new VLA 20-cm image with resolution 15″ which reveals that the apparent head of the comet (which we now label DR 16) has a dumbbell structure. Furthermore, little evidence remains of a connection between the head and the other parts of the ridge (which we now refer to as the tail). We also present new observations from the database of the Canadian Galactic Plane Survey (the CGPS; see Taylor et al. art (2003)) and collect other published observations for a comprehensive study of the source. In Sect. 2 to 5 we describe new observations at radio and infrared wavelengths and present the results. A distance is suggested in Sect. 6. In Sect. 7 to 9 we discuss the source properties and suggest a source model and a source history.
2 Observations
Inspection of Fig. 1 showed that new observations with resolution considerably better than 1′ would be needed to resolve the head of the apparent cometary nebula, with a substantial field of view needed to reveal the complete picture. In this section we will describe targeted VLA observations and the new CGPS data products at 1420 MHz in continuum and 21-cm line. We also summarize results from other publicly available datasets.
2.1 A VLA map at 1.5 GHz
The observations at 1.5149 GHz were obtained with the NRAO Very Large Array (VLA)111The U.S. National Radio Astronomy Observatory is operated by Associated Universities Inc., under contract with the National Science Foundation. in the C/D and D configurations. Concurrent observations of other sources of interest in Cyg X have been described by Landecker et al. tll1 (1993) and Higgs et al. lah2 (1994). Instrumental parameters are summarized in Table 1.
| Field centre: | |
|---|---|
| (B1950) | |
| (B1950) | |
| Frequency | 1.5149 GHz |
| Date C/D configuration | 1988 May 17 |
| Date D configuration | 1988 August 22 |
| On-source time C/D | 39.7 min |
| On-source time D | 19.7 min |
| Calibrators: | |
| flux density | 3C 286; 14.39 Jy |
| phase | 2050+364 |
| polarization | 3C 138 |
| Synthesized beam | 15″ 15″ |
| Field of view (HPW) | 29.22′ |
| Synthesized map size | 21.25′ 21.25′ |
| Surface brightness conversion | 1 Jy/beam 2368 K |
| CGPS mosaic MN2 | (release April 2002) |
|---|---|
| Centre frequency | 1.420 GHz |
| Continuum: | Stokes I |
| Synthesized beam | 71.5″ 49.1″, PA -36.2° |
| rms noise | 40 mK |
| Line synthesized beam | 85.4″ 58.6″, PA -36.0° |
| rms noise | 2.5 K |
| Radial velocity coverage | -164 +58 km/s |
| Channel spacing | 0.82446 km/s |
| Velocity resolution | 1.32 km/s |
The phase centre was not set on the maximum of the head but several arcmin to the north in order to achieve better coverage of the whole object. The two VLA configurations were combined and CLEANed using standard procedures. The map units were expressed in brightness temperature Tb. We used the polar diagram corrected map as several components appeared to be too extended to allow a simple post-integration factor to be applied. No short-spacing information was added. First, the head, with its size of 5′ was adequately covered. Second, the overall structure is better depicted in the CGPS image discussed below.
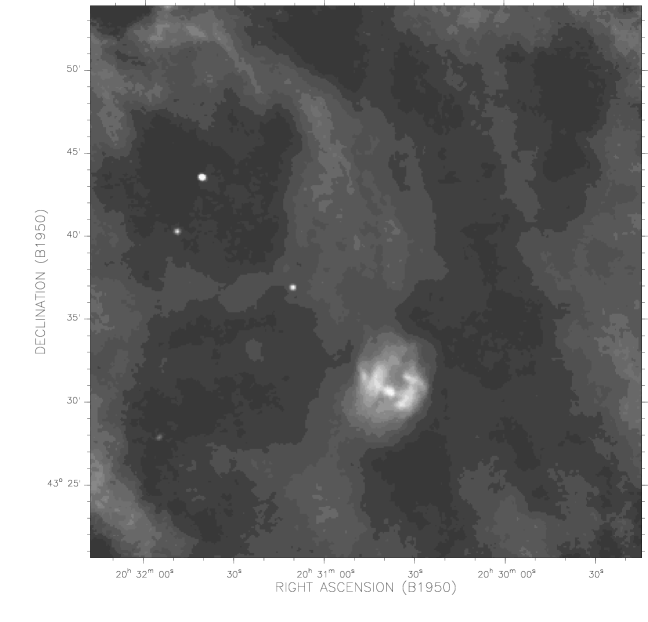
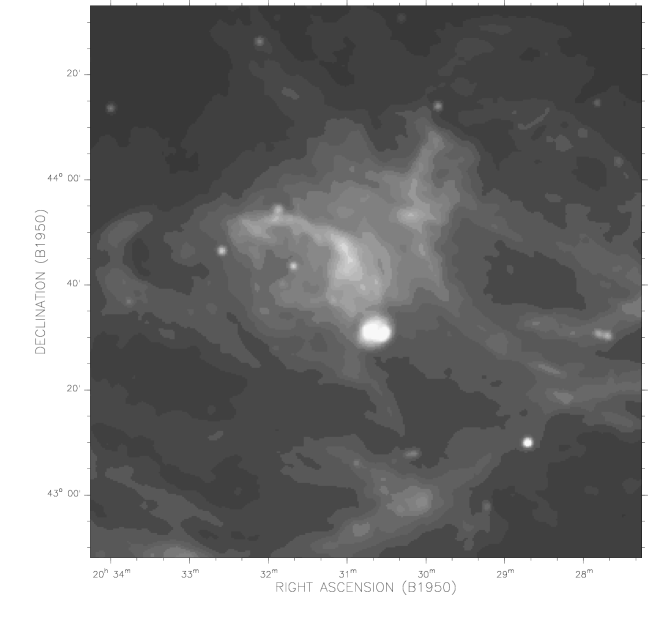
Fig. 2 shows a gray scale image of the whole field, with a grayscale chosen to emphasize the fainter large-scale structure. The overall impression of a cometary nebula has been lost, because the ‘western ear’ has become detached from the rest of the tail and the ‘eastern ear’ seems to be part of a long curved ridge.

| Frequency or | Telescope | Angular | Reference |
|---|---|---|---|
| wavelength | resolution | ||
| 151 MHz | CLFST | 102″ 70″, PA 0° | Vessey & Green vg1 (1998) |
| 327 MHz | WSRT | 78″ 54″, PA 0° | Rengelink et al. rtb (1997) |
| 408 MHz | DRAO SRT | 312″ 210″, PA 0° | Paper XVIII |
| 4800 MHz | MPIfR 100 m-RT | 161″ 153″, PA 0° | Paper XV |
| 100 m | IRAS-HIRES | 132″ 102″ | Cao et al. caoiras (1997) |
| 60 m | IRAS-HIRES | 102″ 60″ | Cao et al. caoiras (1997) |
| 25 m | IRAS-HIRES | 66″ 34″ | Kerton & Martin keriras (1997) |
| 12 m | IRAS-HIRES | 67″ 33″ | Kerton & Martin keriras (1997) |
| 8.28 m | MSX | 20″ 20″ | Price price (1995), IRSA |
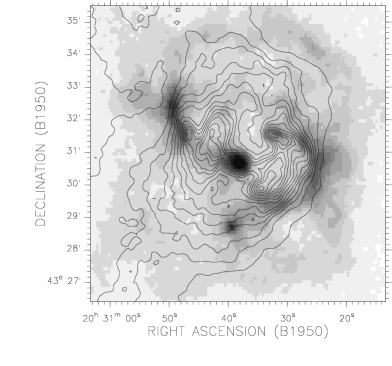
The head of the cometary nebula shows complex sub-structure, as seen in the detailed contour map of Fig. 3. Although the outer contours are nearly circular, with an overall size of 5′ the source has a dumbbell shape with some superimposed small-scale features. DR 16 is apparently placed asymmetrically on the tail, which runs north-south. These complex gradients make it difficult to separate DR 16 and its components from the background structure.
2.2 CGPS 21 cm continuum and line
The CGPS observations include the Cyg X region. One of the outstanding properties of the Survey is the coverage of a large part of the northern Galactic hemisphere at a number of wavelengths with a resolution of around 1′ or slightly worse, covering the radio and infrared regimes222The CGPS data are available to the astronomical community at http://www.cadc.hia.nrc.gc.ca. Its “backbone” is provided by the 21-cm continuum and line observations from the Synthesis Telescope of the Dominion Radio Astrophysical Observatory (DRAO). A description is given by Taylor (art (2003)), and here we present only those parameters relevant to the DR 16 area (in Table 2). The mosaic has short-spacing information added, with continuum data taken from the Effelsberg survey of Reich et al. (rrf (1990)), and line data from the DRAO 26-m Telescope survey of Higgs & Tapping (ht1 (2000)).
The CGPS continuum image of the area is presented in Fig. 4, intended to show the very complex environs of the alleged cometary nebula by using the scaling to emphasize faint emission. The area is criss-crossed by filamentary structures, which could be anything from fragments of shock fronts to small bubbles: none is yet identified or explained. The ‘western ear’ is now seen as a brightness enhancement on a filament apparently unconnected with DR 16, and should be discussed in another context. Such a conclusion is not immediately possible for the ‘eastern ear’, but it seems unavoidable that we must abandon the picture of a cometary nebula. In this image DR 16 appears as a fairly compact source. Whether the ‘tail’ is physically connected to DR 16 remains an open question, to which we will return later.
The CGPS 21-cm line data reveal a bewildering array of structure around DR 16. However, two points emerge. First, there are no emission structures that can be easily related to DR 16. Second, we see that the source is strongly absorbed, even though its continuum brightness temperature is not particularly high. We will use these observations for a new discussion of the distance to DR 16.
2.3 Other observations
Within the frame of the CGPS there are other datasets which yield additional information on the DR 16 area. We summarize these and other publicly available data in Table 3. Sadly, adequate observations of the molecular gas are not available. The work of Cong (cong (1977)) and Dobashi et al. (dob (1994)) and the collection of CO survey results of Leung & Thaddeus (leung (1992)) do little more than tell us that molecular gas exists in the general DR 16 area. Their lack of resolution and/or coverage prevent examination of details. The NRAO VLA Sky Survey (NVSS) (Condon et al. nvss (1998)) covers the source area. Due to its lower resolution and insensitivity to extended structure our VLA map contains more fine structure. Near infrared (from 2MASS) and optical (POSS) images will be referenced later.
3 Spectral energy distribution
To establish the nature of DR 16 we began by deriving radio and infrared spectral indices. The difficulty was the complexity of the background emission. For a convenient and uniform approach at all frequencies we used the ‘fluxfit’ routine from the DRAO Export Software Package, which fits a Gaussian source component and a twisted-plane background simultaneously. With the present data this method was preferable to the alternative of defining a complex background and integrating the excess emission. However convenient the technique, we do not mean to imply that the source consists of actual Gaussian components. It is clear from Figs. 1 to 4 that the form of the background and the number of Gaussians will be strongly resolution dependent. At a given frequency we started with a number of components estimated by eye, and added or deleted components by using the discriminator calculated by the routine. The results of this exercise for the available radio data are collected in Table 4.
| Source | flux | observed | ||
|---|---|---|---|---|
| (B1950) | (B1950) | density | size | |
| [mJy] | ||||
| 151/1 | 40.1s | 29′ 33″ | 1584 375 | 2.41′ 1.36′ |
| 151/2 | 49.0 | 27 56 | 1249 691 | 5.79′ 1.20′ |
| 327/1 | 33.1 | 30 13 | 759 32 | 2.62′ 1.50′ |
| 327/2 | 33.9 | 33 01 | 299 31 | 2.50′ 1.45′ |
| 327/3 | 42.9 | 31 03 | 1322 41 | 3.04′ 2.00′ |
| 408/1 | 37.6 | 30 58 | 3232 327 | 5.50′ 4.04′ |
| 408/2 | 48.8 | 33 33 | 1538 468 | 11.6′ 3.72′ |
| 1420/1 | 31.6 | 32 16 | 278 18 | 2.82′ 1.18′ |
| 1420/2 | 32.6 | 30 19 | 844 19 | 2.52′ 1.51′ |
| 1420/3 | 42.3 | 31 09 | 2105 28 | 3.64′ 2.17′ |
| 1515/1 | 31.1 | 31 31 | 78 5 | 1.38′ 0.42′ |
| 1515/2 | 31.7 | 30 28 | 1078 10 | 2.43′ 1.28′ |
| 1515/3 | 34.5 | 29 52 | 19 3 | 0.56′ 0.31′ |
| 1515/4 | 37.3 | 32 45 | 1202 16 | 2.92′ 2.40′ |
| 1515/5 | 38.3 | 30 41 | 91 8 | 0.67′ 0.40′ |
| 1515/6 | 41.9 | 31 36 | 165 14 | 1.34′ 0.66′ |
| 1515/7 | 43.5 | 30 14 | 1812 17 | 3.25′ 2.57′ |
| 1515/8 | 44.8 | 31 02 | 123 13 | 0.98′ 0.86′ |
| 1515/9 | 47.0 | 31 32 | 42 5 | 1.74′ 0.33′ |
| 4800/1 | 38.9 | 31 03 | 3805 210 | 4.35′ 4.08′ |
The sum of the components at each frequency should be a good measure of the total flux density of DR 16. However, the spectrum constructed from these sums was rather ragged. We supect that the combination of angular resolution and frequency dependent background effects are to blame. For these reasons we excluded components 151/2, 408/2, and 1515/4.


The resulting total flux densities of DR 16 proper are plotted in Fig. 5. The firm conclusion from this exercise is that the radio emission of DR 16 is optically thin thermal emission above 1 GHz with a gradual transition to higher optical depth at lower frequencies. The optical depth of most parts exceeds unity at 151 MHz.
The set of contour maps in the four IRAS passbands in Fig. 6 reveals a general absence of structure in the source in the infrared. The background is relatively faint and smooth, and we used the ‘fluxfit’ routine on these data, just as at radio wavelengths. The resulting flux densities, together with one obtained in the same way from the 8.28 MSX data, are plotted in Fig. 5.
There is obviously a non-negligible amount of cold dust at the location of DR 16. There is no indication that the IR flux density turns down at 100 m towards the Planck maximum, implying a dust temperature below 25 K, but an actual value cannot be derived; we will assign K at a later point. Dust within H ii regions is substantially warmer ( K), and consequently the radio and infrared parts of the spectral energy distribution must represent two quite different environments.
4 21 cm continuum absorption
The CGPS H i data cube contains no emission features clearly associated with DR 16. On the other hand it is quite obvious that there is absorption of continuum emission by local gas to be used for foreground and distance discussions. The optical depth, , and the spin temperature, , of the absorbing neutral hydrogen column can be derived. For a discussion of the problems and of the equations we refer to Wendker & Wrigge (cx20 (1996), Paper XX).
The optical depth is connected to three observed quantities via
where ,
and are the expected emission line brightness
temperature, the directly measured line temperature and the continuum
brightness temperature, respectively. The variable RV is radial
velocity referred to the local standard of rest (LSR). DR 16 is
partially resolved in both continuum and line images. We ignore
the slight difference in angular resolution
between the CGPS continuum and line mosaics (Table 2).


A detailed continuum map is shown in Fig. 7 where three on-source areas are marked. Nine-pixel averages of these areas are (from bottom to top): K, K, K. The rms scatter of these averages is 2 K, but the greatest uncertainty arises from separation into foreground emission which is not absorbed and source emission which is. Other than DR 16 itself there are at least three contributions to consider: a remnant brightness (about 5 K) from the extended ridge (which constituted the tail of the supposed cometary nebula), a diffuse Galactic component, and the cosmic microwave background (CMB). Although we will subsequently argue that the ‘tail’ is not generated by the ‘head’, we nevertheless believe it is plausibly at the same distance. Continuum emission from the tail and from the CMB will therefore not confuse the absorption calculations. From the data of Fig. 4 we estimate that the diffuse Galactic component could be as large as 12 K, which could be entirely in the foreground. However, it is more reasonable to assume that it is spread uniformly along a 10 kpc line of sight through the disk. For a distance of 3 kpc to DR 16, the foreground contribution would be only 3.6 K. Another way of estimating the foreground is to associate it with the faint extended H ii region connected with the Cyg OB2 association, as discussed by Huchtmeier & Wendker (cx9 (1977), Paper IX). Their 11-cm brightness of 0.8 K translates to 3.2 K at 1420 MHz. Considering the vastly different assumptions, the two estimates agree quite well. We will subtract 3 K from the continuum brightness temperatures mentioned above, note that the uncertainty in this number will subsequently dominate the absolute error budget, and will formally use a 4% error for .
The channel maps show that the scale of the H i emission is larger than the continuum source, with emission features on average . A typical channel map is shown in Fig. 8. From inspection of this figure and Fig. 7, the off-spectrum should be derived beyond the 100 K line contour and below the 30 K continuum contour. Trials with various ring sizes showed hardly any difference between off-spectra obtained at different radii, and for convenience we chose the one closest to the source. The on-source spectra for the three areas and the off-source spectrum are shown in Fig. 9.
We now obtain optical depths and spin temperatures. Fig. 10 shows 4 curves for : the results for the individual areas and their mean (solid line). The error budget in the continuum brightness temperatures is dominated by the separation of foreground from background, and we estimate this to be 4% (which may be optimistic). The uncertainty in on-source line temperatures comes from noise (receiver plus sky) and variation in emission gradients, and we formally set this to 5 K for a signal of 70 K, or 7%. The uncertainty in the off-source spectrum is at least the scatter around the average, and we assign a further 7% to this. Conservatively adding these contributions linearly brings us close to 20%, which translates to an uncertainty in optical depth of 0.2. We therefore regard all values of as not meaningfully measured. Looking at the scatter between the three individual areas we see no significant foreground fluctuations over DR 16 and find very good agreement between the areas. We therefore use the averaged curve to derive and .
First we interpret these results in velocity space. Continuum absorption becomes noticeable around +19 km/s where the emission rises to the point where K. reaches a first maximum of nearly 0.5 at +16.5 km/s, with just below 200 K. This H i must be the closest neutral layer in the Cygnus Rift. drops slightly at +12 km/s with an increase in to around 300 K, possibly corresponding to a neutral but warm outer layer of the Rift (there will be some overlap in velocity space of gas at distinctly different distances, and this could dilute the changes in and ). After dropping back to 200 K, does not vary significantly out to 5 km/s, although different absorbing structures can be identified by the variations in . This faint anticorrelation between and plausibly fits into the standard picture where higher optical depth means higher volume density, which in turn implies lower temperature because of greater cooling effeciency. The peak in at 0 km/s probably marks the densest part of the local Rift gas. reaches a final peak at 6 km/s, after which it quickly drops to unreliable levels. We intepret this as the last layer of neutral hydrogen in front of DR 16, which we place at 7 km/s in radial velocity space.
We also computed absorption spectra for the two continuum maxima of the tail. Absorption is detectable at both maxima with roughly similar optical depths, but the scatter rises dramatically because the continuum temperature is much lower (35 K) and off-spectra must be derived from regions parallel to the ridge but quite far removed. Nevertheless, the results are very consistent with those for DR 16 proper, and from the fact that continuum absorption is visible out to 6 km/s we conclude that the tail must be at the same distance.
The column density of neutral hydrogen can be deduced by summing the relevant channels of the corrected emission line profile up to the continuum source. Using the standard relation, a channel contains where is the channel spacing. We obtain . Using another standard relation () we derive a total visual extinction of towards DR 16 which is about half the value deduced in Paper V. We suspect that a substantial contribution to the extinction not represented by neutral hydrogen is connected to two molecular clouds which were seen in H2CO (Paper XVII) at 0.7 and +3.4 km/s where the above relation does not hold. Piepenbrink & Wendker (Paper XVII) estimate that the integrated effect of the H2CO containing clouds represents more than of extinction, which would close the gap.
5 Near infrared and optical data
5.1 MSX
In discussing the spectral energy distribution we remarked that the IRAS maps do not give us much information on the dust distribution. The spectral index derived in that section implies that there is a large amount of cold dust, but also some warmer dust. We cannot tell whether the warm and cold components are mixed (usually not the case) or the location of the warm dust. This can be remedied to some extent by looking at the MSX data (referenced in Table 3). The absolute calibration of the MSX data is somehat uncertain, and the good fit of the MSX flux density with the IRAS spectrum may be a coincidence. However, the MSX image is quite useful. If we consider the wavelength of 8.28 m to represent predominantly warm dust (say 40 K), then Fig. 11 shows that, besides a compact concentration coinciding with the central radio point source, filaments of warm dust lie just outside the radio filaments.
The picture which immediately comes to mind is one in which the radio structures (ionized hydrogen) are photo-dissociation regions on the edges of dust clouds. We will return to this interpretation later.
The MSX Archive Point-Source Catalogue contains nine entries over the area enclosed by the low contours of the MSX and VLA images. Seven of them coincide with extended structures, and are probably not real point sources, although very faint point sources might be buried in the extended emission. The two remaining entries (MSX5C G082.0329+02.3247 and MSX5C G082.0087+02.3024, later referred to as MSX8-1 and MSX8-2) appear to be pointlike. MSX8-2 has an optical counterpart in both the blue and red POSS images, and we regard it as a foreground star; its high brightness in the near-infrared photometry of the 2MASS survey argues for a very late type star. MSX8-1 seems to have a core-halo structure, and coincides with the central VLA source (1515/5 in Table 4). We discuss its nature and identification in a later section.
5.2 J, H, K photometry
Two (observationally) different surveys of the DR 16 area in the standard near-infrared bands (J, H, K) are available. Comerón & Torra (com (2001)) observed at the Observatorio del Teide and Dutra & Bica (dutra (2001)) extracted a dataset from the 2MASS data base. Both concluded from the images that a stellar over-density is present at the DR 16 radio position and derived colour-magnitude diagrams (CMDs) and distances for the central parts of the proposed clusters. In view of the rather dissimilar distance estimates (1.8 kpc and 2.7 kpc) we obtained and examined both data sets. Plotting both photometry and astrometric positions it became apparent that the photometric values do agree within the mutual errors very satisfactorily. The main differences are, first, a somewhat fainter catalogue limit for the 2MASS data, and, second, the assignment of a quite different area to the new cluster (in each case determined by eye). For the first reason we decided to use the 2MASS data to have an independent third look. A greyscale image of the cluster area is given in Fig. 12 for illustrative purposes.
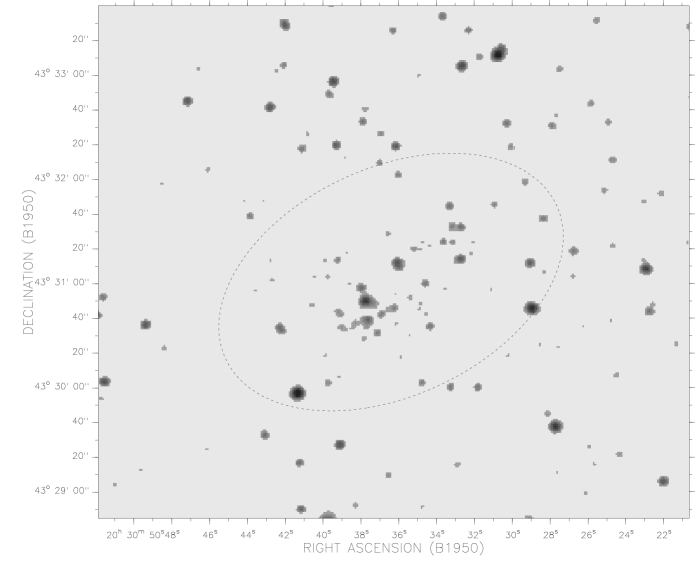
We first produced a map of the stellar density distribution in the Ks band (the band least affected by extinction) by counting objects in 0.75 arcmin2 circles. The central density enhancement was well fitted by a Gaussian, giving a geometric centre of (B1950: ) and a (Gaussian) size of at a position angle of . (We do not imply that the real distribution is Gaussian.) The central position lies in the middle of a small hole, whose significance is not obvious (statistical fluctuation, additional patch of extinction, or division into two sub-structures come to mind). The centre is about 50″ north-west of the central VLA source (1515/5).
Fig. 13 shows stellar density within elliptical rings around the cluster centre. The rings have a width of 0.25′, and an axial ratio of 1.6, with the major axis at a position angle of 115°. The existence of a star cluster above a background of about 8 stars per arcmin2 is beyond doubt. The peak is off centre because of the hole already mentioned. The total extent is along the major axis. The ellipticity may be more pronounced in the outer parts than we have assumed, as may be seen in Fig. 12. Subtracting a background level of 7.7 stars per arcmin2 from the total of 93 stars inside this ellipse (6.01 arcmin2) leaves about 47 stars in the cluster. Only 6 stars are needed to fill the central depression, and the stars in the second ring appear to be the most heavily reddened. The central minimum is then probably the result of additional extinction, but the existence of two substructures cannot be ruled out.

The placement of a reddened zero-age main sequence on a cluster in a near infrared CMD is highly ambigious. The reddening vector is nearly parallel to the colour axis in a vs. () CMD for the upper main sequence, and the distance modulus is parallel to the apparent magnitude axis. Dutra & Bica (dutra (2001)) used a template method which assumes that for a small young cluster the tenth brightest star has an absolute magnitude close to (spectral type about A0). The template cluster is NGC 6910 from the optical photometry by Delgado & Alfaro (del (2000)). However, for the ninth brightest star of their member list we infer from the BDA database (Mermilliod merm (1995)) a spectral type of B1V. Therefore the Dutra & Bica (dutra (2001)) assumption does not seem to be well justified.
A theoretical unreddened zero-age main sequence was read from the tables given by Cox (cox (2000)) for the vs. ( CMD. The tables have limited coverage of spectral range, only from O9 to M5, but seem to be the best available. From the parametrization of the extinction law by Cardelli et al. (car (1989)) and values given by Mathis (mat (1990)) we calculated the reddening vector to be where is the total visual extinction to be used. The unreddened zero-age main sequence shifted to a distance modulus of 10m is plotted in Fig. 14. It will give some indication which stars may be unreddened foreground objects and we see that three of the brighter stars belong to this group. As they are also visible on the POSS plates with optical colours they are indeed late type foreground stars.

For the brighter stars there is quite a gap in colour between the unreddened sequence and the suspected cluster stars. The minimum reddening is then 1.4m in , corresponding to about 8m of AV. The scatter for stars with a redder colour indicates that substantial cluster and/or circumstellar reddening occurs. In the absence of knowledge of the spectral type of any of the stars it seems impossible to ‘fix’ a number so that a distance can be inferred. The only conclusion permitted by the CMD is that the data are consistent with any distance between 1 and 4 kpc. We will illustrate this with one numerical exercise. Assume a distance modulus of 12.5m (3 kpc); the star 2MASS J2032214+434107 with and (J-Ks)=1.60 then has corresponding to . Shifting it to the unreddened sequence leads to which in turn corresponds to a spectral type of O9V. Its extinction therefore occurs mostly in the foreground, and the additional 1m of extinction could either be circumstellar or local to DR 16. For such a star the expected apparent visual magnitude is about 18.4m. But the star is visible on the red POSS plate with a magnitude around 17m (GSC) and is just visible on the blue plate! And if we shift the distance modulus by 1m in either direction we still obtain equally plausible and meaningful numbers. This exercise can be carried through for all stars above , of which the vast majority are not, and should not be, visible on the POSS plates, confirming that they are highly reddened stars, not intrinsically faint ones. Below this value a distinction between slightly reddened foreground and highly reddened cluster stars can no longer be made, which explains the widely scattered band at the bottom of the CMD. The same arguments make it highly likely that at least the brighter stars in the area are cluster members and not field stars. Picking some sort of mean reddening from the CMD is not easy.
In the end, the star cluster is only well defined by the projected number density distribution. Its visual foreground extinction is quite large (8m to 9m) and is most probably produced by the Cygnus Rift at a distance of only 600 pc, although a distance of around 3 kpc or more is supported by the CMD.
6 On the distance of DR 16
Two different approaches are available to determine the distance to the DR 16 complex. On the one hand we can use spectral-line data for a kinematic distance. Three published recombination line observations are available, 7 km/s from H110 (Paper XVII) for DR 16 proper, 5.2 km/s (also Paper XVII) for the tail, and 5.1 km/s from H87 by Lockman (lock (1989)) but with an angular resolution that enclosed DR 16 and at least part of the tail. From our continuum absorption study we now add 5 to 7 km/s as a very well determined distance in radial velocity space. Using the rotation curve of Fich et al. (fich (1989)) this leads to a distance range of 2.5 to 3.5 kpc. Although kinematic distances are notoriously uncertain at the Galactic latitudes under consideration, DR 16 seems firmly placed behind the Cyg OB2 association and its related features.
On the other hand we have the two recent attempts to prove the existence of an open cluster connected to DR 16 using near infrared photometry (JHK bands) and thereby derive a distance with the help of a colour-magnitude diagram (CMD). As we showed above, the Dutra & Bica (dutra (2001)) value of 1.8 kpc is very uncertain because the notion of a mean cluster reddening from the scatter in the bottom part of the CMD may be too optimistic. Comerón & Torra (com (2001)) obtained 2.7 kpc using a different estimator (a sort of Zanstra method). However, we found that the star with the brightest value, 2MASS J2032250+434014 (see Fig. 14), was not taken into account because it lies outside the area considered to be the cluster area. Adding this star into the Comerón & Torra (com (2001)) formalism leads to a value of 0.8 kpc, indicating the fragility of this method. Furthermore, the brightest cluster members, which contribute most of the ionizing photons, mostly have large circumstellar extinctions. Clearly the methodological problem of dust absorbing such photons has not been properly solved for DR 16.
In spite of the diligent efforts in the near infrared the strongest constraint remains the radial velocity distance of 5 km/s. We maintain that this means that DR 16 is situated behind the Cyg OB2 cluster and is physically unrelated to it. We will use a distance of 3 kpc from this point, a choice which will appear quite plausible after we have discussed the nature and origin of the emission. However, we note that the infrared data are even better compatible with a larger distance.
7 Nature of the objects
All the data presented in preceding sections of this paper are compatible with the idea that DR 16 proper is an isolated cluster of very young stars. The brightest members can be assumed to be a group of late O to early B stars capable of producing enough Lyman continuum photons to ionize the observed H ii. However, the large number of stars with substantial circumstellar extinction creates a difficulty. Why are no ultracompact H ii regions (UCHIIR) detected? If any exist they must be so compact that they can be observed only at higher frequencies. This would then rule out any substantial leakage of Lyman continuum photons. Furthermore, UCHIIR should be seen as point sources at infrared wavelengths (e.g. Wood & Churchwell ed (1989)), which is not the case. The dust distribution seen in the infrared seems to be rather diffuse, except for the warm dust, which may be concentrated in filaments on the outskirts.
The ease with which the VLA map can be decomposed into Gaussian components could indicate that there are multiple ionization centres. Indeed, each small component needs only a middle B type star and the large diffuse emission a single O9V one. However, we would then expect to see these stars more or less centred on the small radio components. The fact that only one such identification appears from a careful overlay, namely VLA 1515/5 with 2MASS J2032213+434056 (which we refer to together as #5) argues against this geometry. We suggest that the radio structures seen are density fluctuations, with the execption of #5.
A first estimate of the number of Lyman continuum photons required for
the ionization of the H ii region DR 16 can be made using
.
This relation (Mezger pgm (1972)) is valid only for an optical depth
less than unity, which appears to be the case. Using an electron
temperature of K, an average frequency of 1.45 GHz, a total
observed flux density of 3.3 Jy, and a distance of 3 kpc we obtain
s-1. Since we will
subsequently suggest that the three Gaussian components, #5 (the
central VLA source), 1515/3, and 1515/6, which define the central
dumbell appearance of DR 16, are a Herbig Ae/Be (HAeBe)
star with a giant bipolar
outflow, this value represents an upper limit. We now inspect the
brightest cluster stars to see whether they can deliver so many Lyman
continuum photons. The two stars brightest in
apparent mK magnitude (2MASS J2032250+434014
and 2MASS J2032126+434103) are
also heavily reddened by circumstellar material (Fig. 14).
This additional extinction amounts to 8.5m
and 13m, respectively. Although their position in the CMD
makes them late O-type stars, they will not contribute to ionization
of the diffuse H ii, since we consider that they are still
within their parent molecular cocoons. The absence of
UCHIIR around them supports this suggestion –
the UCHIIR are still too small and our frequency is too low. The
third brightest cluster member is 2MASS J2032214+434107,
already used as an example in Sect.5 and shown to be most likely a
B0.5V star. Its Lyman continuum photon production is (Vacca et al. vacc (1996)). This star is
marginally adequate, and, if supplemented by the next ranked B stars
(type B2), would account for the ionization of the diffuse
H ii. The star lies near the centre of the object, making it
plausible that DR 16 is an ionization bounded H ii region.
Remarkably, increasing the distance modulus to 13m (4 kpc)
inverts problem, providing too many photons (which of course could be
absorbed by dust).
The two next brightest stars (2MASS J2032214+434107 and 2MASS J2032197+434129) should have 4m and 6m of circumstellar (or local) extinction according to the CMD and are consequently invisible or barely visible on the POSS.
The seventh brightest (2MASS J2032213+434056) star deserves special attention. It is the only one which coincides with one of the radio components, the small Gaussian component 1515/5 fitted to the central point source in the VLA map. It is also the only one to coincide with a near-infrared source (see Figs. 3 and 11; #5). Working through the same exercise as above, (, type B2V ) we calculate an expected apparent red magnitude of . This appears to be compatible with the GSC red brightness of , given the roughness of the calculations. We conclude that #5 has not yet reached the main sequence and thus qualifies as a HAeBe star. In addition we interpret the coincidence with a small-scale radio source and the dumbbell shaped structure in the radio map as an indication of a central source plus jet. The radio lobes are then remnants of a giant bipolar outflow. Lower mass stars in a less photoionizing surrounding often produce Herbig-Haro objects (HH) in such circumstances. The projected outflow length on either side is about 1′ or not quite 1 pc. In this interpretation we assume that the diffuse H ii and the dumbbell are projected onto each other without physical interaction at the present time, but both are features of the star formation event of DR 16.
It is one thing to make this qualitative interpretation, but to make it more quantitative is quite another. In the following discussion we take properties and relations for HAeBe stars from the review of Waters & Waelkens (haebe (1998)) and for HH objects from that of Reipurth & Bally (hh (2001)).
The requirements for classification as a HAeBe star are only partially met. Although it seems certain that this is a B star, we lack a suitable spectrum to test the emission line requirement; we need a high-resolution spectrum of a fairly faint star. On the other hand, the infrared excess is definitely there. The existence of a point source in the MSX 8.3 m band and its visibility at other MSX wavelengths (Fig. 11) is a strong indicator. Both the radio source and its near-infrared counterpart are definitely elongated in the direction of the alleged jet structure but hardly perpendicular to it. This is best measured in the radio domain by the sizes of the fitted Gaussian: the major axis is 40″ and the minor axis less than 20″. However, some sort of core-halo geometry is equally compatible with the observations. We emphasize that the data do not have enough angular resolution to separate emission from the (extended) atmosphere of the star, from the remaining natal disk, or from the polar jet. Similarly, we cannot really say whether a jet connects the central source and the bipolar plumes. Bipolar outflows are often detected from their CO emission, and we have already lamented the lack of adequate observations of this kind. We suggest that the radiation from the emergent star has mostly ionized the outflow plumes. The warm dust, visible at 8.3 m, is positioned at the outside of the H ii as seen from the star (vividly portrayed in Fig. 11) and we suggest that this large surface is the working interface between the outflow and the remaining cold interstellar medium from the parent molecular cloud.
8 Remarks on the ‘tail’
H i absorption of the continuum emission from the tail is detected albeit very weak out to the same radial velocity as for DR 16 (see Sect. 4). Recombination lines were found at similar velocities (Sect.6). Landecker (tll (1984)) detected a H166 line with a 0.6° beam indicating that widespread H ii with slightly negative radial valocities must be present. Cong (cong (1977)) found a molecular cloud extending 44′ by 20′ with a radial velocity of about 2.5 km/s. All these data provide circumstantial evidence that the tail should lie at about the same distance as DR 16, but none imply any physical interaction.
In the original low-resolution image (Fig. 1) the source flares out considerably. It is apparent from Fig. 4 that this impression is created by long filaments with varying brightness which do not cross DR 16 implying that they are not part of it. The western arc is narrow with a radius of at least 0.5° ; its outline is lost in the general confusion in the area. A working hypothesis is that a shock of distant origin ran into the denser medium of the DR 16 complex, producing the filamentary structure. For the tail itself, we suggest that it is part of a ring-like feature with a radius of about 6′ (Figs. 2 and 4), well defined by emission from half of its perimeter, and by an apparent central hole with a linear extend of about 10 pc.
More striking than the ring itself is the point source at , , very close to its centre. However, the point source seems to be non-thermal, with flux densities of mJy at 1515 MHz, mJy at 1420 MHz, mJy at 327 MHz and mJy at 151 MHz, indicating a spectral index of around 0.8. This would be compatible with an extragalactic source such as an AGN or a quasar.
While examining the optical appearance of the area we noticed that the three stars brightest in mK are all about 1′ south of the centre of the ring (at B1950 positions of 20h31m40.85s/43°42′22.0″, 20h31m45.31s/43°42′11.7″, and 20h31m39.35s/43°41′43.1″ ). Their colours indicate heavy reddening. From the magnitudes given in the USNO-B and 2MASS catalogues they could be O5 to B1 stars at 3 kpc distance with a reddening of , just the amount of foreground reddening for the DR 16 cluster. The ring may have been created by the action of the stellar winds of these stars on their surroundings, but we have not proved any connection.
9 Summary and discussion
We began this study with the idea that we were seeing an object which seemed to be a very large cometary nebula. In summary the higher resolution data have revealed that we were looking at a complex of different objects. The main radio continuum source, now identified as DR 16 proper, is the common H ii region of an open star cluster. The cluster is small, with a total mass of a few hundred solar masses, and a substantial fraction of the low-mass stars have yet to reach the main sequence. On the other hand, the fact that at least some of the O stars have shed their natal envelopes and are ionizing a common H ii envelope points to an age of some hundred thousand years. However, DR 16 is not an isolated group. We have found several signs of interaction with surrounding material. One of the neighbouring features, in our original picture the ‘tail’ of the cometary nebula, lies at roughly the same distance and is probably interacting with the same molecular cloud as DR 16.
We used various methods to estimate the distance to the complex and derived a best value of 3 kpc. The uncertainty on this number is probably 0.5 kpc, with the near distance constrained by the properties of the stellar cluster and the far one by the radial velocity of the H ii region. This distance is large enough that physical interaction between DR 16 and Cyg OB2 seems quite implausible.
Despite having many new observations, the lack of adequate CO data impedes interpretation. Cong (cong (1977)) estimated that there is about 85 000 of molecular material in the area (scaled by us for distance). What is required is a fully sampled CO map with a resolution of 1′ or better. We predict that such a map would show much small-scale structure.
The internal structure of the DR 16 H ii region is rather smooth, with only minor density fluctuations after the components 1515/5, 1515/3 and 1515/6 are subtracted. These three components together define the structure we have called the dumbbell. We have shown that enough ionizing photons are available from stars on or near the main sequence to produce a classical H ii region. The lack of UCHIIR around those stars with substantial circumstellar material could be an age effect. This idea is supported by the recent considerations of Keto (keto (2002)) who has argued that in the beginning the ionization front will stall at a very short distance from the star for a rather long time.
This leaves the dumbbell as the most interesting individual object. Furthermore, it has an early type star within its central radio source. That the dumbbell is a single physical object is not necessarily obvious. The best evidence is perhaps in Fig. 11 where the two outer components appear to be confined by the only two well-defined substructures in the dust distribution. Furthermore, the central radio source is definitely elongated in the direction of the lobes. Together these clues suggest a bipolar outflow (keep in mind that the torus required for the flow is normal to the dumbbell axis).
10 Conclusions
Part of the following conclusions are based on two review papers, one on UCHIIR by Churchwell (edrev (2002)), and one on Herbig Ae/Be stars by Waters & Waelkens (haebe (1998)). Massive stars produce UCHIIR which are dispersed after the stars reach the main sequence. The oldest, most massive stars in the DR 16 cluster have nearly all reached this state and can now provide the ionization of the dispersed diffuse gas. The younger ones are far enough from the main sequence that their small UCHIIR are not observable. As the lines corresponding to stellar evolution and to decreasing circumstellar extinction are nearly parallel in the CMD we have available (see Fig. 14), we cannot provide any more details of this picture. The lower mass limit for young stars to which this picture applies is usually put around 10 (or spectral type B0.5). Less massive pre-main-sequence stars are usually called HAeBe stars and develop more slowly towards the main sequence, but can shine through their natal cloud much sooner since their accretion disks are less massive. Probably as a consequence of this, outflows are less vigorous and hardly observed at stages near the main sequence. Images of the thermal radio emission portray the average electron density along the line of sight, and this can smooth out small-scale structures. Remains of old UCHIIR and of bipolar outflows, which are probably ubiquitous in such a region, are thus not visible in our radio maps.
Our suggestion that the central star of the source 1515/5 is a HAeBe star and that the H ii structures 1515/3 and 1515/6 are the working surfaces of the lobes of a bipolar outflow impinging on neutral and/or molecular material implies the following specific evolutionary status. The star is close enough to the main sequence that typical HAeBe properties are weak (this statement can be tested by spectroscopy). Its mass is large enough that it also has properties usually ascribed to the massive star picture i.e. an earlier strong outflow which has now ceased. On the other hand, the outflow is sufficiently recent that the density fluctuations it produced are still visible, although its ionization may by now be maintained by the diffuse radiation rather than by the originating star. This transition status makes the star quite interesting.
On the grander scale, DR 16 can now be added to the list of sources in Cyg X which comprise an H ii region and a small stellar cluster and lie at about a distance of 3 kpc. This is beyond the zone of influence of the Cyg OB2 association, often regarded as all dominating. The Cyg OB2 association was suggested to be a young globular cluster rather than a classical open cluster (Knödlseder knoe (2000)). Distances around 3 kpc have been suggested for DR 21 and DR 23 (Papers XVII and XI, respectively). The projected distance of DR 16 from these is only 100 pc or so, which may indicate that this part of the local spiral arm contains an extended complex of small star forming regions. DR 16 itself is quite bright, about one third of the Orion nebula. Compared to DR 15, itself a bright and conspicuous source in Cyg X, it is about 15 times brighter. On the other hand, it has only about 1/7th of the radio power of DR 21, usually regarded as a prominent cluster of just forming stars.
Acknowledgements.
The Canadian Galactic Plane Survey (CGPS) is a Canadian project with international partners. The Dominion Radio Astrophysical Observatory is operated as a national facility by the National Research Council of Canada. The CGPS is supported by a grant from the Natural Sciences and Engineering Research Council of Canada. This research has made use of the NASA/IPAC Infrared Science Archive, which is operated by the Jet Propulsion Laboratory, California Institute of Technology, under contract with the National Aeronautics and Space Administration. This research has made use of the VizieR catalogue access tool, CDS, Strasbourg, France This publication makes use of data products from the Two Micron All Sky Survey, which is a joint project of the University of Massachusetts and the Infrared Processing and Analysis Center/California Institute of Technology, funded by the National Aeronautics and Space Administration and the National Science Foundation.References
- (1) Cao, Y., Terebey, S., Prince, T.A., & Beichman, C. A. 1997, ApJS, 111, 387
- (2) Cardelli, J.A., Clayton, G.C., & Mathis, J.S. 1989, ApJ, 345, 245
- (3) Churchwell, E. 2002, ARA&A, 40, 27
- (4) Comerón, F., & Torra, J. 2001, A&A, 375, 539
- (5) Condon, J.J., Cotton, W.D., Greisen, E.W. et al. 1998, AJ, 115, 1693
- (6) Cong, H.L. 1977, unpublished PhD thesis, Columbia University
- (7) Cox, A.N., 2000, Allen’s Astrophysical Quantities, Springer, Berlin
- (8) Delgado, A.J., & Alfaro, E.J. 2000, AJ, 119, 1848
- (9) Dickel, H.R., & Wendker, H.J. 1978, A&A, 66, 289 (Paper XI)
- (10) Dickel, H.R., Wendker, H.J., & Bieritz, J.H. 1969, A&A, 1, 270 (Paper V)
- (11) Dobashi, K., Bernard, J.-P., Yonekura, Y., & Fukui, Y. 1994, ApJS, 95, 419
- (12) Downes, D., & Rinehart, R. 1966, ApJ, 144, 937
- (13) Dutra, C.M., & Bica, E. 2001, A&A, 376, 434
- (14) Fich, M., Blitz, L., & Stark, A.A. 1989, ApJ, 342, 272
- (15) Higgs, L.A., & Tapping, K.F. 2000, AJ, 120, 2471
- (16) Higgs, L.A., Wendker, H.J., & Landecker, T.L. 1994, A&A, 291, 295
- (17) Huchtmeier, W.K., & Wendker, H.J. 1977, A&A, 58, 197 (Paper IX)
- (18) Kerton, C.R., & Martin, P.G. 2000, ApJS, 126, 85
- (19) Keto, E., 2002, ApJ, 580, 980
- (20) Knödlseder, J. 2000, A&A, 360, 539
- (21) Landecker, T.L. 1984, AJ, 89, 95
- (22) Landecker, T.L., Higgs, L.A., & Wendker, H.J. 1993, A&A, 276, 522
- (23) Leung, H.O., & Thaddeus, P. 1992, ApJS ,81, 267
- (24) Lockman, F.J. 1989, ApJS, 71, 469
- (25) Mathis, J.S. 1990, ARA&A, 28, 37
- (26) Mermilliod, J.-C. 1995, in Information and On-Line Data in Astronomy, eds. D.Egret & M.A.Albrecht (Dordrecht Kluwer), 127
- (27) Mezger, P.G. 1972, in Interstellar Matter, Proc.2nd Astr. Course, Swiss Soc. Astron. Astrophys. Publ. Geneva Obs. p.166
- (28) Piepenbrink, A., & Wendker, H.J. 1988, A&A, 191, 313 (Paper XVII)
- (29) Price, S.D. 1995, SpSciRev, 74, 81
- (30) Reich, W., Reich, P., & Fürst, E. 1990, A&AS, 83, 539
- (31) Reipurth, B., & Bally, D. 2001, ARA&A, 39, 403
- (32) Rengelink, R.B., Tang, Y., de Bruyn, A.G. et al. 1997, A&AS, 124, 259
- (33) Taylor, A.R., Gibson,S.J., & Peracaula, M. et al. 2003, AJ, 125, 3145
- (34) Vacca, W.D., Garmany, C.D., & Shull, J.M. 1996, ApJ, 460, 914
- (35) Vessey, S.J., & Green, D.A. 1998, MNRAS, 294, 607
- (36) Waters, L.B.F.M., & Waelkens, C. 1998, ARA&A, 36, 233
- (37) Wendker, H.J. 1984, A&AS, 58, 291 (Paper XV)
- (38) Wendker, H.J., Higgs, L.A., & Landecker, T.L. 1991, A&A, 241, 551 (Paper XVIII)
- (39) Wendker, H.J., & Wrigge, M. 1996, A&A, 305, 592 (Paper XX)
- (40) Wood, D.O.S., & Churchwell, E. 1989, ApJS, 69, 831