A Two-Phase Chemical Enrichment Model
for the Milky Way Globular Cluster System
Abstract
Many globular cluster systems have a distinct bimodal metallicity distribution function (MDF) which has strikingly similar features in many large galaxies of all types. By using the Milky Way cluster system as a typical example, we show that bimodal MDFs can be very well matched with a double “accreting-box” chemical enrichment model in which both the halo (metal-poor) and bulge (metal-rich) clusters form during an early phase of gas inflow simultaneously with star formation. However, differences in effective yield between the two phases are not enough by themselves to reproduce the observed MDF shape: gas infall is required for both phases, and either the initial gas or the infalling gas must have very different metallicities in the two separate phases.
1 Introduction
The old globular clusters found in all large galaxies have presented long and persistent challenges to our understanding of the early formation processes of galaxy halos and bulges. A feature of globular cluster systems (GCSs) which has drawn considerable attention is their metallicity distribution (MDF), which consistently takes on a roughly bimodal form in many large elliptical and large spiral galaxies (e.g. Whitmore et al., 1995; Gebhardt & Kissler-Patig, 1999; Zepf, Ashman, & Geisler, 1995; Geisler et al., 1996; Forbes, Brodie, & Grillmair, 1997; Neilsen & Tsvetanov, 1999; Kundu & Whitmore, 2001; Larsen et al., 2001; Larsen, Forbes, & Brodie, 2001; Beasley et al., 2003; Harris, Harris, & Geisler, 2003, among many others). Most clusters fall either in the “metal-poor” mode centered at [Fe/H] or “metal-rich” mode centered near [Fe/H] , with each mode having an intrinsic dispersion [Fe/H] dex. Furthermore, the mean [Fe/H] values and dispersions of each mode are surprisingly similar from one galaxy to the next despite the vast range of galaxy types (e.g. Forbes, Brodie, & Grillmair, 1997; Harris, 2001; Forbes, Brodie, & Larsen, 2001).111To date, most of the MDF data for the many galaxies in the studies cited above are from broadband photometric indices such as , which are intrinsically not very sensitive to metallicity. In addition, the two standard “modes” have Gaussian dispersions large enough to allow a significant degree of intrinsic overlap, so that if they are blurred out further by low-precision data, the validity of a bimodal fit becomes debatable. For examples of MDFs where the two modes may not have clearly separated peaks, see, e.g., NGC 524, 1399, or 4473 in Larsen et al. (2001). It is, however, important to note that when data are taken with higher-precision photometry or spectroscopy, bimodal distributions tend to emerge more clearly. That is, the galaxies with the best available data (such as M87, NGC 4472, NGC 1404, NGC 4594, NGC 5128, or the Milky Way itself; see the references cited above) are very well matched by a bimodal MDF in which the two modes display clear separation. It is these “best case” examples which have driven the bimodality paradigm in the literature and which our present discussion is aimed at.
The Milky Way GCS is no exception to this general trend. Because it is a completely uncontaminated sample of clusters with well established metallicities, it provides what is still perhaps the best classic example of a bimodal MDF (see Figure 1). The shape of the MDF and its close connection with the cluster kinematics was first clearly established by Zinn (1985) and has held up through many subsequent analyses (see, e.g. Harris, 2001, for a review). The MDF, in its usual plotted form as number per unit [Fe/H] (left panel of Figure 1), is often approximated by a pair of Gaussian functions (cf. the references cited above). These numerical fits have no physical significance (and have not usually been claimed to), and give little insight into the evolutionary history of the system except for the strong hint that a distinct two-phase formation history is required.
In this brief paper, we take one step further into interpreting these bimodal MDFs using some simple and physically plausible assumptions. Standard first-order chemical evolution models, such as the one-zone closed-box or “simple model” (Pagel & Patchett, 1975; Binney & Merrifield, 1998) work reasonably well at matching the broad, unimodal MDFs of the halo field-star populations in the Milky Way (e.g. Pagel & Patchett, 1975; Hartwick, 1976; Ryan & Norris, 1991; Prantzos, 2003) and in M31 (Durrell, Harris, & Pritchet, 2001) with appropriate choices of the effective nucleosynthetic yield . 222For a normal IMF and a closed-box system, the nucleosynthetic yield is typically . In “leaky-box” models, the value of can be much smaller and is strongly driven by the fraction of gas ejected from the zone by supernovae and stellar winds at each round of star formation; see Hartwick (1976). Extensions to the simple model to incorporate some smoothly varying gas inflow (the “accreting-box” model) have recently been used to model the unimodal, metal-rich MDF of the halo stars in NGC 5128 (Harris & Harris, 2002). An early, brief phase of primordial gas inflow has even been applied to explain the relatively small number of the very lowest-metallicity stars ([Fe/H] ) in the Milky Way halo (Prantzos, 2003). Accreting-box models can be thought of as approximate versions of more extensive hierarchical-merging models of galaxy formation, in which a large population of small pregalactic gas clouds merges successively into bigger and bigger pieces while star formation within the clouds goes on simultaneously (see, e.g. Beasley et al., 2003, for an application of the GALFORM code to the case of NGC 5128).
By contrast, the distinctly bimodal MDFs of globular cluster systems do not easily fit into the continuous sequence of starforming events in normal hierarchical-merging or accreting-box models. Some new feature of the history needs to be invoked, either to boost the formation of metal-poor clusters at early times, or inhibit the slightly later formation of intermediate-metallicity clusters. Harris & Harris (2002) and Beasley et al. (2002) suggest that the metal-poor clusters may have formed preferentially early in the first rounds of star formation, but that their formation was then truncated while field-star formation continued onward. In this picture, the metal-rich clusters would have formed a bit later, during the major starbursts accompanying the merging of the last, biggest gas clouds. Santos (2002), for example, suggests that the metal-poor cluster formation epoch was truncated at the reionization era.
An alternate approach (Côté, Marzke, & West, 1998; Côté, West, & Marzke, 2002) is to assume that the metal-poor clusters all formed separately in dwarf galaxies and were dissipationlessly accreted later by the giants. In this case the bimodality of the combined MDF is a stochastic accident which results only for a restricted mass range and mass spectrum of the accreted satellites. Ashman & Zepf (1992) proposed instead that the metal-poor clusters formed in situ while the metal-richer clusters formed later from gas brought in by major mergers (though this model was primarily intended to explain E-galaxy formation rather than big spirals). Both of these routes can produce bimodal MDFs, though many other interpretive problems exist (see, e.g., Forbes, Brodie, & Grillmair, 1997; Harris, 2001; Harris & Harris, 2001, for extensive discussions).
2 A Two-Stage Chemical Enrichment Model
We now use the Milky Way GCS to explore just one particular aspect of the issues introduced above: namely, how a simple “accreting-box” chemical evolution model can be adapted to produce a bimodal MDF. Such a model might also allow us to gain insight into important questions about the MDF: Can we usefully constrain the initial gas abundance of either major stage, or the abundance of the infalling gas? Are the effective yield rates of each phase well determined once we drop the closed-box restriction? What about the time period over which the infall was important?
The raw MDF for the Milky Way GCS is shown in Figure 1 in two versions: number per unit [Fe/H], and number per unit heavy-element abundance . We have used log for the standard conversion to total heavy-element abundance (e.g. Shetrone, Côté, & Sargent, 2001). The linear form of the MDF, , connects readily with simple enrichment models, but in either version the observed histogram is bimodal, with a primary peak at or [Fe/H] (the halo clusters) and a secondary peak at or [Fe/H] (the bulge clusters).
For our extension of the simple model we follow the formalism of Harris & Harris (2002) and explicitly assume that the GCS forms in two distinct, separate stages. Measurements of GC ages versus metallicity (e.g. VandenBerg, 2000) suggest that these halo and bulge phases may have been separated by about 2 Gy in time but with some overlap between them.
Within each of the two phases, we assume that the GCs are built during a large number of individual star-forming events, starting from a box of gas with initial heavy-element abundance and initial mass . In each discrete timestep a small fraction of the gas reservoir forms into new stars. A fraction stays locked up in dead stellar remnants, and is returned to the reservoir of gas in the box, so that the net increase in stellar mass is . We assume “prompt mixing”, i.e. the ejected gas mixes with the surrounding gas before the next star-forming step. The effective yield by convention is the amount of heavy elements released into the gas reservoir per unit stellar remnant mass. If the box simply uses up its initial supply of gas, then after many timesteps the resulting MDF of stars formed in the box has a characteristic exponential shape (Pagel & Patchett, 1975; Binney & Merrifield, 1998). However, no such single-phase model will match Fig. 1(b).
To add new gas continuously falling in to the system, we now assume that an amount , with heavy-element abundance , comes in to the box after each timestep and mixes with both the remaining initial gas and the gas ejected from stars. Under these conditions the net change of gas mass in heavy elements after each timestep is (Harris & Harris, 2002)
| (1) |
where is the mass of heavy elements removed from the reservoir due to forming stars, is the amount added back as ejected gas from SNe winds and evolved stars, is the mass added by the new gas infalling into the reservoir, and . For both stages (“halo” and “bulge”) we fix the numerical conversion efficiency at and the ejected gas fraction at (see Harris & Harris, 2002); and we then numerically integrate Eq.(1) over many steps until the gas supply is depleted. The metallicity of the ambient gas steadily climbs upward while gas inflow and star formation are both going on. The continual accretion of gas into the system, combined with the recycling of enriched gas from each round of star formation, allows large numbers of stars to be built in at intermediate and moderately high metallicities, resulting in an MDF with a very different shape from the closed-box model.
Following other authors, we use a gas infall rate which decreases smoothly with e-folding time , (see also Lacey & Fall, 1983; Chiappini, Matteuci, & Gratton, 1997; Harris & Harris, 2002; Prantzos, 2003). Thus in the model as a whole, the free parameters are the effective yield ; the initial abundance ; the abundance ; the initial amount of infalling gas expressed in units of ; and the infall decay time expressed in units of the timestep . Since each formation stage has its own set of five parameters, the total two-stage model has a total of 10 parameters to specify, plus an 11th one which is the relative number of metal-rich to metal-poor clusters (equivalent to the total amount of gas used in each stage). At the end of the integration when the gas supply is nearly exhausted, we finally count up the numbers of stars in the model as a function of abundance , for comparison with the observations.
In principle, we could solve for the entire set of parameters by running a large grid of models and calculating goodness of fit for each one. However, not all the parameters have important effects on the final MDF shape, and some are mutually correlated. Here we explore just four different combinations of and which have some physical motivation:
(a) , free: Here the initial gas is assumed to be primordial and unenriched, while is determined by the best fit to the observations. This might be the case, for example, if the bulge and halo began cluster formation at about the same time in the early universe; the bulge region, sitting much deeper in the galaxy’s potential well, would have kept more of its gas and been able to drive upward to higher metallicity. (In practice, we adopt for the halo stage in all the model runs, since by hypothesis the metal-poor cluster mode always starts from primordial or nearly-primordial gas.)
(b) free, : Here the infalling gas in both phases is assumed to be primordial material, as is (phase 1). Only (phase 2) is determined by the fit.
(c) : In both stages we assume the infalling gas from outside has the same abundance as the initial gas in the box. Thus for the halo phase, , while for the bulge phase, both are determined in lockstep by the fitting procedure.
(d) and free: No assumptions are imposed on either abundance, except for the usual (phase 1) = 0.
3 Model Results and Discussion
The primary results for our four starting assumptions are summarized in Table 1. In the last line of the table, mean uncertainties (corresponding to one standard deviation) are listed. Calculations of extensive model grids showed that the initial masses and were were closely coupled and very weakly constrained. (In some cases it was possible to start with a virtually “empty” box and build the system entirely from infalling material.) The most interesting constraints were on , , and to a lesser extent, the infall decay time . However, even these are partially correlated: for example, an increase in can be compensated by a shorter time , leading to almost the same final MDF. In Table 1 we also list the typical (one-sigma) uncertainties of the fitted parameters.
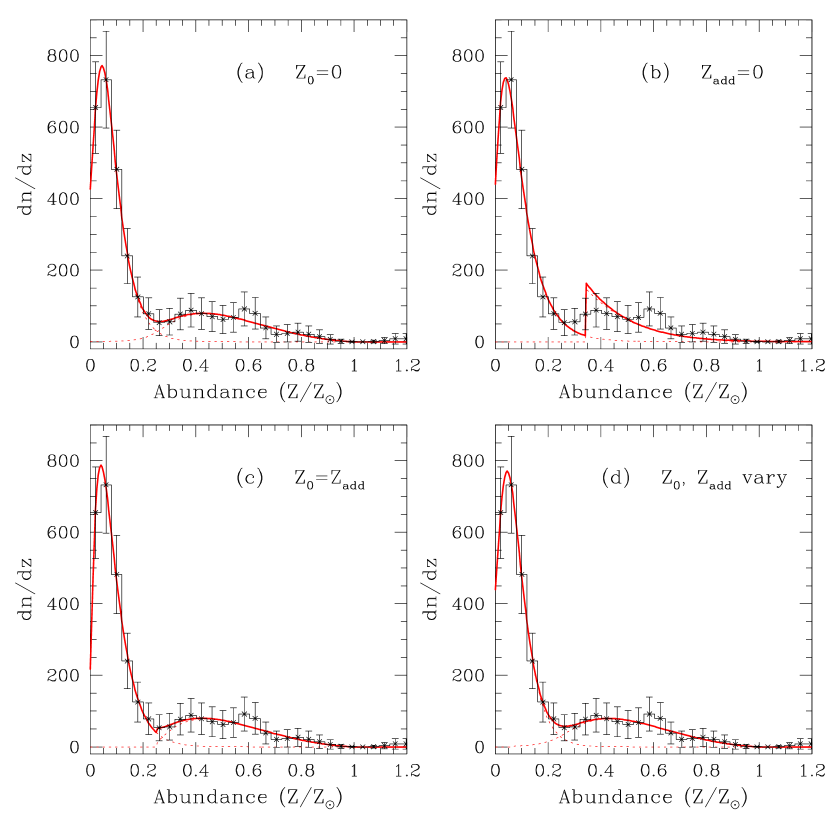
All four initial assumptions are capable of leading to good fits to the observed MDF; these are displayed in Figures 2(a-d). Nevertheless, a few clear trends emerge from inspection of the results. For the “halo” stage, both the initial gas and infalling gas need to be nearly unenriched, primordial material, and the steep rise in at very low metallicity () is the characteristic mark of early heavy infall. The effective yield for the halo in all the models is always near , five times smaller than the basic nucleosynthetic yield . This level suggests that 80% or more of the protocluster gas in the halo was expelled before it could convert into stars, but the presence of infall allows to be larger than in models without inflow (Hartwick, 1976; Binney & Merrifield, 1998).
For the “bulge” formation stage, is typically three times larger than for the halo phase. If, as we expect, the mean difference is due mainly to different ratios of ejected gas, then the bulge region, sitting much deeper in the Galaxy’s potential well, would have held onto more than half of its gas rather than only 20%.
The exponential decay time for gas infall is consistently near in phase 1, and 25 to 40 in phase 2. We cannot convert this to an actual time interval without additional information on merging and star formation rates which only more advanced models can provide. But if, following the GC ages mentioned above, we assume that each stage takes Gy over steps, then in very rough terms the main period of heaviest gas infall should last about half a Gigayear in each stage.
We emphasize here again that the assumption of no infalling gas (, corresponding to the closed-box model) does not reproduce the data adequately; such models produce too many clusters in either phase at the low-metallicity end. Said differently, a two-phase closed-box model, where the only free parameters are the yields , does not give the model enough freedom to fit the data. An early period of infall is both necessary and plausible.
Model (a): In this model even the metal-rich bulge clusters form starting from initially unenriched gas. However, the infalling gas for stage 2 must compensate by being substantially pre-enriched (to about one-quarter Solar) to produce the correct secondary peak in the MDF. For comparison, the hierarchical merging models (see Cole et al., 2000; Beasley et al., 2003) show that the “quiescent” metal-poor mode starts with unenriched material but can continue upward to near-Solar abundance as long as it is not interrupted. The halo clusters might have belonged only to the first part of this phase.
Model (b): In this model – the poorest fit of the four – the infalling gas is always primordial, so for stage 2 must start quite high to directly produce the secondary MDF peak (leaving the rather unphysical spike at ). Here, almost none of the bulge clusters fall in the metal-poor regime; there is almost no overlap between the two parts of the MDF.
Model (c): This model starts with perhaps the most plausible assumption for both stages: the infalling gas has the same abundance as the initial . The job of producing the secondary MDF peak at the right place is then shared more or less equally between the initial level and the subsequent enrichment cycles from star formation. The final maximum enrichment level from stage 1 is fairly close to the initial for stage 2, thus making it easier for the halo clusters and field stars to form over similar time periods, unlike model (a) above.
Model (d): This model, which allows an unconstrained solution for both parametric abundances and , ends up almost identical with model (a) and similar to (c) as well.
4 Summary
With an accreting-box chemical evolution model and some simple assumptions, we find that it is readily possible to describe the MDF of the Milky Way globular clusters, with an accuracy and physical basis superior to the standard double-Gaussian numerical fits that pervade the literature. An unavoidable, and still rather arbitrary, key factor is that we are forced to adopt two distinct phases of cluster formation to produce the clear bimodality that the observations demand.
Within this context, however, a wide range of model parameters can produce entirely adequate fits to the observations. The combination that we find most persuasive is that:
(a) The halo clusters formed from near-primordial gas with a low yield and shut down their formation at an early stage (this includes the possibility that many of them formed in the small potential wells of dwarf satellites and were accreted later).
(b) The bulge clusters formed starting from mildly enriched gas () and at . In both cases, a significant phase of early gas infall is necessary to reproduce the observed MDF shape.
To the extent that two sharply distinct phases represent something real in the actual history of the GCs (e.g. Santos, 2002), this basic approach needs to be explored further. An important new piece of the evolutionary puzzle now emerging is that the MDFs of the globular clusters in several galaxies are strikingly different from the metallicity distributions of the halo and bulge field stars (Harris & Harris, 2001; Durrell, Harris, & Pritchet, 2001; Harris & Harris, 2002). In galaxies such as the LMC, M31, M32, and NGC 5128 (and perhaps in giant E galaxies generally), the old-halo stellar population is very broad and strongly weighted to moderately high metallicity near [Fe/H] . These MDFs exhibit only a thin metal-poor tail and no trace of the distinct bimodality characterizing the globular clusters. This evidence reinforces the suspicion that the story of formation for the globular clusters had quite distinct elements.
Although we have discussed specific results only for the Milky Way, extensions to other galaxies with clearly bimodal MDFs are obvious.
References
- Ashman & Zepf (1992) Ashman, K.M., & Zepf, S.E. 1992, ApJ, 384, 50
- Beasley et al. (2002) Beasley, M.A., Baugh, C.M., Forbes, D.A., Sharples, R.M., & Frenck, C.S. 2002, MNRAS, 333, 383
- Beasley et al. (2003) Beasley, M.A., Harris, W.E., Harris, G.L.H., & Forbes, D.A. 2003, MNRAS, 340, 341
- Binney & Merrifield (1998) Binney, J., & Merrifield, M. 1998, Galactic Astronomy (Princeton: Princeton U. Press)
- Chiappini, Matteuci, & Gratton (1997) Chiappini, C., Matteuci, F., & Gratton, R. 1997, ApJ, 477, 765
- Cole et al. (2000) Cole, S., Lacey, C.G., Baugh, C.M., & Frenk, C.S. 2000, MNRAS, 319, 168
- Côté, Marzke, & West (1998) Côté, P., Marzke, R.O., & West, M.J. 1998, ApJ, 501, 554
- Côté, West, & Marzke (2002) Côté, P., West, M.J., & Marzke, R.O. 2002, ApJ, 567, 853
- Durrell, Harris, & Pritchet (2001) Durrell, P.R., Harris, W.E., & Pritchet, C.J. 2001, AJ, 121, 2557
- Forbes, Brodie, & Grillmair (1997) Forbes, D.A., Brodie, J.P., & Grillmair, C.J. 1997, AJ, 113, 1652
- Forbes, Brodie, & Larsen (2001) Forbes, D.A., Brodie, J.P., & Larsen, S.S. 2001, ApJ, 556, L83
- Gebhardt & Kissler-Patig (1999) Gebhardt, K., & Kissler-Patig, M. 1999, AJ, 118, 1526
- Geisler et al. (1996) Geisler, D., Lee, M.G., & Kim, E. 1996, AJ, 111, 1529
- Harris (1996) Harris, W.E. 1996, AJ, 112, 1487
- Harris (2001) Harris, W.E. 2001, in Star Clusters, Saas-Fee Advanced Course 28 (New York: Springer), ed. L.Labhardt & B.Binggeli
- Harris & Harris (2001) Harris, W.E., & Harris, G.L.H. 2001, AJ, 122, 3065
- Harris & Harris (2002) Harris, W.E., & Harris, G.L.H. 2002, AJ, 123, 3108
- Harris, Harris, & Geisler (2003) Harris, W.E., Harris, G.L.H., & Geisler, D. 2003, AJ, submitted
- Hartwick (1976) Hartwick, F.D.A. 1976, ApJ, 209, 418
- Kundu & Whitmore (2001) Kundu, A., & Whitmore, B.C. 2001, AJ, 121, 2950
- Lacey & Fall (1983) Lacey, C.G., & Fall, S.M. 1983, MNRAS, 204, 791
- Larsen et al. (2001) Larsen, S.S., Brodie, J.P., Huchra, J.P., Forbes, D.A., & Grillmair, C.J. 2001, AJ, 121, 2974
- Larsen, Forbes, & Brodie (2001) Larsen, S.S., Forbes, D.A., & Brodie, J.P. 2001, MNRAS, 327, 1116
- Neilsen & Tsvetanov (1999) Neilsen, E.H.Jr., & Tsvetanov, Z.I.1999, ApJ, 515, L13
- Pagel & Patchett (1975) Pagel, B.E.J., & Patchett, B.E. 1975, MNRAS, 172, 13
- Prantzos (2003) Prantzos, N. 2003, A&A, 404, 211
- Ryan & Norris (1991) Ryan, S., & Norris, J.1991, AJ, 101, 1865
- Santos (2002) Santos, M.R. 2002, AAS Bull. 201, 108.05
- Shetrone, Côté, & Sargent (2001) Shetrone, M.D., Côté, P., & Sargent, W.L.W. 2001, ApJ, 548, 592
- VandenBerg (2000) VandenBerg, D.A. 2000, ApJS, 129, 315
- Whitmore et al. (1995) Whitmore, B.C., Sparks, W.B., Lucas, R.A., Macchetto, F.D., & Biretta, J.A. 1995, ApJ, 454, L73
- Zepf, Ashman, & Geisler (1995) Zepf, S.E., Ashman, K.M., & Geisler, D. 1995, ApJ, 443, 570
- Zinn (1985) Zinn, R. 1985, ApJ, 293, 424
| Phase 1 Parameters | Phase 2 Parameters | ||||||||||
|---|---|---|---|---|---|---|---|---|---|---|---|
| Model | |||||||||||
| 0.39 | 0.0013 | 0 | 0.01 | 22 | 0.0047 | 0 | 0.24 | 38 | |||
| 0.90 | 0.0016 | 0 | 0 | 18 | 0.0046 | 0.34 | 0 | 27 | |||
| 0.38 | 0.0015 | 0 | 0 | 22 | 0.0047 | 0.25 | 0.25 | 38 | |||
| free | 0.39 | 0.0013 | 0 | 0.01 | 23 | 0.0047 | 0.06 | 0.24 | 38 | ||
| Uncertainty | 0.0002 | – | – | 3 | 0.0004 | 0.06 | 0.03 | 4 | |||