Extragalactic Large-Scale Structures behind the Southern Milky Way. ††thanks: Tables 1 and 2 are available in electronic format at the CDS via anonymous ftp to cdsarc.u-strasbg.fr (130.79.128.5) or via http://cdsweb.u-strasbg.fr/Abstract.html. Based on observations taken at the European Southern Observatory, La Silla, Chile.
As part of our efforts to unveil extragalactic large-scale structures behind the southern Milky Way, we here present redshifts for 764 galaxies in the Hydra/Antlia, Crux and Great Attractor region (, ), obtained with the Meudon-ESO Fibre Object Spectrograph (MEFOS) at the 3.6-m telescope of ESO. The observations are part of a redshift survey of partially obscured galaxies recorded in the course of a deep optical galaxy search behind the southern Milky Way (Kraan-Korteweg 2000; Woudt & Kraan-Korteweg 2001). A total of 947 galaxies have been observed, a small percentage of the spectra (, 11.5%) were contaminated by foreground stars, and 74 galaxies (7.8%) were too faint to allow a reliable redshift determination. With MEFOS we obtained spectra down to the faintest galaxies of our optical galaxy survey, and hence probe large-scale structures out to larger distances ( km s-1) than our other redshift follow-ups using the 1.9-m telescope at the South African Astronomical Observatory (Kraan-Korteweg et al. 1995; Fairall et al. 1998; Woudt et al. 1999) and the 64-m Parkes radio telescope (Kraan-Korteweg et al. 2002). The most distinct large-scale structures revealed in the southern Zone of Avoidance are discussed in context to known structures adjacent to the Milky Way.
Key Words.:
Catalogs – Surveys – ISM: dust, extinction – Galaxies: distances & redshifts – clusters: individual: ACO 3627 – large-scale structure of Universe1 Introduction
At the same time when significant advances are made in characterising large-scale structures of galaxies in the Universe through dedicated surveys such as the Sloan Digital Sky Survey (Zehavi et al. 2002) and the 2dF Galaxy Redshift Survey (Colless et al. 2001), the study of large-scale structures behind the Milky Way has also progressed enormously. Dedicated deep optical searches, near infrared all-sky surveys (2MASS and DENIS), HI all-sky surveys and X-ray surveys, have all resulted in the detection of voids, clusters and superclusters at low Galactic latitude (for a review, see Kraan-Korteweg & Lahav (2000) and references therein).
We have focussed our efforts on an extended region behind the southern Milky Way (Kraan-Korteweg 2000; Woudt & Kraan-Korteweg 2001). This region of space harbours a large local overdensity of galaxies, the Great Attractor (Dressler et al. 1987; Lynden-Bell et al. 1988; Kolatt et al. 1995; Tonry et al. 2000). Local and complex large-scale structures appear to extend across the Galactic Plane (GP) in this part of the sky (Kraan-Korteweg et al. 1995 (Paper I); Fairall et al. 1998 (Paper II); Woudt et al. 1999 (Paper III)).
Our deep optical galaxy search behind the southern Milky Way is divided into three separate areas: the Hydra/Antlia region (, ) (Kraan-Korteweg 2000), the Crux region (, ), and the Great Attractor region () (Woudt & Kraan-Korteweg 2001). The optical survey in these regions has revealed over 11 000 previously unrecorded galaxies with observed major diameters . Recently, the survey has been extended towards the Puppis region (at lower Galactic longitudes), and the Scorpius region (towards the Galactic bulge).
Following our deep optical galaxy search, we have been engaged in a redshift survey of these newly found partially obscured galaxies. This redshift survey consists of three different, yet complementary approaches in tracing the extragalactic large-scale structures. They are:
-
•
Optical spectroscopy of individual early-type galaxies with the 1.9-m telescope of the South African Astronomical Observatory (SAAO) (Papers I – III).
-
•
H I line spectroscopy of low surface brightness spiral and irregular galaxies with the Parkes 64-m radio telescope (Kraan-Korteweg et al. 2002).
-
•
Low resolution, multi-fibre spectroscopy of galaxies in regions of high galaxy-density with the 3.6-m telescope of the European Southern Observatory (ESO), initially in combination with Optopus, later with MEFOS (Meudon-ESO Fibre Object Spectrograph).
MEFOS, with its 29 object fibres and large field of view (1-degree diameter), is optimal for covering the highest density regions in our optical survey. These multi-fibre observations are an important part of our redshift survey, specifically in mapping the centre of the GA region and the extended overdensity around ACO 3627.
In this paper – paper IV in the series of papers on extragalactic large-scale structures behind the southern Milky Way – the results from the MEFOS multi-fibre spectroscopy in the Hydra/Antlia, Crux and Great Attractor regions are presented.
2 Observations and data reduction
MEFOS mounted at the prime focus of the ESO 3.6-m telescope, provided a large field of view (1 degree in diameter). It had 30 arms that could point within the 20 cm (1 degree) field. One arm was used for guiding, while the other 29 arms were dedicated to the astronomical objects. Each arm was equipped with an individual viewing system for accurate setting – very useful for objects in star crowded regions – and carried two spectroscopic fibres, one for the astronomical object, and the other one for the sky recording needed for sky subtraction. The spectral fibres intercepted 2.5 arcsec on the sky.
The data presented in this paper were obtained during 10.5 nights in four observing runs between February 1993 and May 1995. A total of 48 fields were observed in our surveyed region, i.e., the Hydra/Antlia, Crux and Great Attractor (GA) regions. One field was observed twice in order to check the stability and performance of MEFOS. Also, by observing one field twice, the uncertainties in the redshifts obtained following the cross-correlation procedure (Tonry & Davies 1979) can be quantified (see Sect. 2.2.).
In all the observing runs, the CCD Tek #32 was used in combination with grating #15. The wavelength coverage spans a range of 3815Å – 6120Å, with a dispersion of 170Å/mm and a resolution of Å.
Before and after each science frame, an arc exposure was made. In our case, the arcs were made with a Helium-Neon lamp. A filter (BG 28) was put in front of the lamp to reduce saturation of the bright lines at the red end of the spectrum. The wavelength-calibration frames had exposure times between one and two minutes, the science frames had exposure times of 20 or 30 minutes. Generally, each MEFOS field has been observed for 1 hour in total (combining 2 or 3 individual exposures).
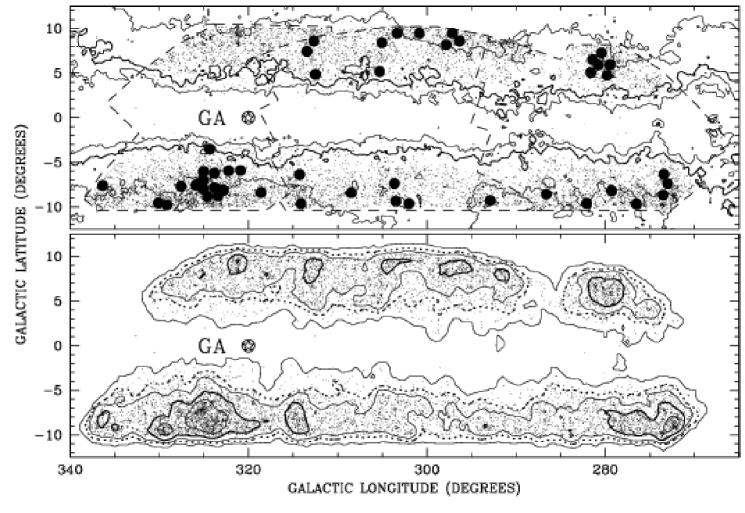
The upper panel of Figure 1 shows the distribution of the observed MEFOS fields in the Hydra/Antlia, Crux and GA areas. The MEFOS fields cover the regions of highest galaxy density, with galaxy densities typically in excess of 25 galaxies per square degree (see lower panel of Fig. 1).
2.1 Data reduction
All the MEFOS spectra have been reduced with the standard IRAF111IRAF (Image Reduction and Analysis Facility) is distributed by the National Optical Astronomy Observatories, which are operated by the Association of Universities for Research in Astronomy, Inc., under cooperative agreement with the National Science Foundation. software package. Various command language (cl) programmes were written by V. Cayatte which greatly streamlined the reduction process. This process involved the extraction of the individual spectra, the wavelength calibration using Helium and Neon lamp arc exposures, a correction for the fibre transmission, the sky subtraction, the removal of cosmic rays and the determination of the redshift.
Thirteen Helium and Neon emission lines were used for the wavelength calibration. The wavelength solution to the fit of the arc lines was accurate to better than Å. A number of fibres showed a significant offset in the position of the [OI] skyline with respect to its nominal value of 5577.35 Å, in some cases as much as 1.8 0.1 Å (Felenbok et al. 1997, but see also Batuski et al. 1999). These offsets are systematic and are caused by a misalignment of some of the fibres with respect to the slit. For those fibres where this shift is larger than 0.5 Å, an inverse wavelength shift of the average offset (averaged over the entire observing run) to the fibre in question was applied.
The relative fibre transmission coefficient for each fibre is determined from the [O I] 5577.35Å skyline flux. For each MEFOS field the measured flux is normalised using the fibre with the highest throughput. The transmission might vary from night to night due to sky variations or changes in the fibre efficiency (Felenbok et al. 1997). The first effect is rather weak below 6000Å (Cuby and Magnoli 1994) and as we find no evidence for variations in the overall transmission coefficient (the root-mean-square error is 1–3%) the latter effect is not significant.
However, a clear drop in the fibre transmission coefficients between the 1994 and 1995 data was seen in 6 of the 30 fibres. In a time span of more than one year some fibres had lost as much as 30% of their efficiency. The likely cause for this drop in efficiency is physical damage to the fibres in question, as they are not expected to have any natural decay.
After the fibre transmission corrections were made, the sky spectra within each MEFOS field were examined by eye. The sky spectra were averaged to reduce the noise in the sky-subtracted spectrum.
2.2 Redshift determination
The IRAF package RVSAO was used to determine the redshifts. Four template stars have been observed; they form a template for the cross-correlation of galaxy spectra. The actual cross-correlation of the spectra is done with XCSAO within the RVSAO package. After a first cross-correlation (with no a priori imposed velocity limits), cross-correlation peaks were checked by eye for each galaxy. Galaxies with an erroneous cross-correlation peak of low contrast were either rejected, or, when a clear (unambiguous) peak was seen elsewhere with matching H and K Calcium lines, remained in the final list of galaxies.
The galaxies in this list were then cross-correlated one more time, but now with a strict velocity range imposed. For galaxies with redshifts lower than 5000 km s-1 this range is 1000 km s-1, for more distant galaxies the velocity window ranges from to .
Emission line galaxies were treated separately. Their redshifts were determined via the EMSAO task within the RVSAO package. The errors in the quoted MEFOS emission line redshifts are conforming to the errors in the SAAO data (Papers I–III), i.e., 100 km s-1 in case of a single emission line and in case of emission lines.
The errors in the quoted MEFOS redshifts from the absorption lines are not true ‘external’ errors. They are based on an internal comparison, rather than a comparison with literature data. One field has been observed twice (field F18) resulting in 16 galaxies having two independently measured MEFOS redshifts. A further 4 galaxies were found on overlapping fields. For these 20 galaxies, the difference between the two redshift measurements is plotted (as crosses) in Figure 2 against the Tonry and Davies (1979) -parameter.

The method (Hill & Oegerle 1993, Pinkney et al. 1993) is often used to infer an error () on the basis of the observed R-parameter (contrast factor). Based on the 20 overlapping galaxies displayed in Figure 2, km s-1 corresponds best to the uncertainties in our MEFOS data, i.e., the solid line drawn in Figure 2). This corresponds reasonably well with the -value obtained by Batuski et al. (1999) from their MEFOS observations.
The solid dots in Figure 2 are the errors as quoted in our redshift catalogue. These errors correspond to twice the standard deviation of the -weighted average velocity. These errors, rather than , were used in our redshift catalogue. They are, as can be seen in Figure 2, entirely consistent with km s-1.
2.3 The redshift catalogue
The 764 redshifts obtained with MEFOS are presented in Table 1222Table 1 is only available in electronic format at the CDS via anonymous ftp to cdsarc.u-strasbg.fr (130.79.128.5) or via http://cdsweb.u-strasbg.fr/Abstract.html.. The entries in Table 1 are as follows:
-
Column 1 and 2: Identification of the galaxy as given in Kraan-Korteweg (2000) – prefix ‘RKK’ – and Woudt & Kraan-Korteweg (2001) – prefix ‘WKK’ –, and Lauberts identification (Lauberts 1982).
-
Column 3 and 4: Right Ascension and Declination (2000.0). The positions were measured with the Optronics machine at ESO in Garching and have an accuracy of about 1 arcsec.
-
Column 5 and 6: Galactic longitude and latitude .
-
Column 7: Major and minor axes (in arcsec). These diameters are measured approximately to the isophote of 24.5 mag arcsec-2 and have a scatter of .
-
Column 8: Apparent magnitude . The magnitudes are estimates from the film copies of the SRC IIIaJ Survey based on the above given diameters and an estimate of the average surface brightness of the galaxy.
-
Column 9: Morphological type. The morphological types are coded similarly to the precepts of the Second Reference Catalogue (de Vaucouleurs et al. 1976). Due to the varying foreground extinction a homogeneous and detailed type classification could not always be accomplished and some codes were added: In the first column F for E/S0 was added to the normal designations of E, L, S and I. In the fourth column the subtypes E, M and L are introduced next to the general subtypes 0 to 9. They stand for early spiral (S0/a – Sab), middle spiral (Sb – Sd) and late spiral (Sdm – Im). The cruder subtypes are a direct indication of the fewer details visible in the obscured galaxy image. The question mark at the end marks uncertainty of the main type, the colon marks uncertainty in the subtype.
-
Column 10: Heliocentric velocity () and error as derived from the absorption features. The errors may appear large as they are estimated external errors, and not internal errors (see Sect. 2.2). The square brackets indicate a tentative redshift.
-
Column 11: Heliocentric velocity and error measured from the emission lines (identified in Column 12) when present. The square brackets indicate a tentative redshift.
-
Column 12: Code for the emission lines identified in the respective spectra:
1 2 3 4 5 OII H H [OIII] [OIII] 3727 4340 4861 4959 5007 -
Column 13: Code for additional remarks:
* – Redshift is also available in the literature (NASA Extragalactic Database (NED), May 2003).
1 – RKK 1808: The redshift measured with MEFOS is in slight disagreement with the value quoted in the literature ( km s-1, Paper I). Preference is given to the value quoted here.
2 – RKK 2313: The redshift measured with MEFOS is in slight disagreement with the (tentative) value quoted in the literature ( km s-1, Paper I). Preference is given to the value quoted here.
3 – WKK 662: The redshift measured with MEFOS is in slight disagreement with the (tentative) value quoted in the literature ( km s-1, Paper II). Preference is given to the value quoted here.
4 – WKK 708: The redshift measured with MEFOS is in disagreement with the (tentative) value quoted in the literature ( km s-1, Paper II). The clear emission lines in the MEFOS spectra support the rejection of the literature value.
5 – WKK 1883: The redshift quoted in the literature ( km s-1, Visvanathan & Yamada 1996) is in disagreement with the redshift determined from the MEFOS spectra. The latter shows a clear range of absorption lines and its redshift determination is unambiguous. Preference is given to the MEFOS value.
6 – WKK 5094: The redshift measured with MEFOS is in disagreement with the (tentative) value quoted in the literature ( km s-1, Paper III). Preference is given to the value quoted here.
7 – WKK 5366: The redshift quoted in the literature ( km s-1, Juraszek et al. 2000) is imcompatible with the MEFOS redshift. There is a galaxy (WKK 5365) from WKK 5366, and the literature value (H I line spectroscopy) could have suffered from source confusion.
8 – WKK 5416: The redshift quoted in the literature ( km s-1, Visvanathan & Yamada 1996) is in disagreement with the redshift determined from the MEFOS spectra. The latter shows a clear range of absorption lines and its redshift determination is unambiguous. Preference is given to the value quoted here.
In Table 2333Table 2 is only available in electronic format at the CDS via anonymous ftp to cdsarc.u-strasbg.fr (130.79.128.5) or via http://cdsweb.u-strasbg.fr/Abstract.html., we present the 183 galaxies observed with MEFOS, but for which no redshift could be obtained due to the presence of superimposed foreground stars on the galaxy, or due to the low signal-to-noise of the resulting spectra. The entries in Table 2 are as follows:
-
Column 1 – 8: As in Table 1.
-
Column 9: As in Table 1. In addition, a question mark prior to the galaxy classification indicates uncertainty about the galaxian nature of the candidate.
-
Column 10: Remarks about the quality of the spectrum.
2.4 Comparison to other measurements
There are 71 galaxies in Table 1 for which a redshift has been obtained previously (NED, May 2003). For 8 of them, the value quoted here is in disagreement with the literature data (see Column 13 of Table 1), but for the remaining 63 galaxies there is good agreement. We find that
If the overlapping sample is restricted to measurements made by us at the SAAO (Papers I – III), the agreement again is good, although the standard deviation is somewhat larger
based on 42 galaxies in common. The larger standard deviation is due to the increasing uncertainty in the SAAO spectra of the more distant galaxies. Fig. 3 shows the general good agreement between the MEFOS redshifts and the literature values.


3 Coverage and completeness
In the following two sections, only the galaxies with a reliable redshift () will be used in the discussion and plots; the galaxies for which we obtained a tentative redshift () will not be included.
3.1 The Hydra/Antlia region
The Hydra/Antlia region contains 3279 galaxy candidates (Kraan-Korteweg 2000). 183 Galaxies in this region have a previously determined redshift (NED, and references therein). Most of these redshifts were determined in the course of our redshift survey (Kraan-Korteweg et al. 1995; Kraan-Korteweg et al. 2002).
The MEFOS observations have resulted in 185 redshifts in the Hydra/Antlia region (see Table 1), of which 7 are tentative measurements. For eighteen galaxies, a redshift had been published previously, so 160 new redshifts in the Hydra/Antlia region are presented here. A total of 343 galaxies (literature + MEFOS) in the Hydra/Antlia region (= 10.5%) now have a reliable redshift. This percentage is somewhat lower than that in the Crux and GA regions (see Sect. 3.2. and 3.3.), but additional spectra have been obtained for 500 galaxies with Optopus (Kraan-Korteweg et al. 1994), and will be presented elsewhere.
The upper-left panel of Fig. 4 shows the magnitude distribution () of all the 343 galaxies with a reliable redshift (cross-hatched histogram). The filled histogram shows the magnitude distribution of the 178 galaxies with a reliable MEFOS redshift. It is clear that the MEFOS observations trace the fainter end of the magnitude distribution of the galaxies in the Hydra/Antlia region. The average of the MEFOS sample is 179, only slightly brighter than the overall mean magnitude of the galaxies in the Hydra/Antlia catalogue, 182 (Kraan-Korteweg 2000).
The mean extinction-corrected magnitude of the MEFOS sample is = 166, compared to = 156 for the entire redshift sample (literature and MEFOS). We have used the Galactic reddening maps of Schlegel et al. (1998) for the extinction correction; see Woudt & Kraan-Korteweg (2001) for full details of the extinction correction procedure.
3.2 The Crux region
In the Crux region, 3759 galaxy candidates have been identified (Woudt & Kraan-Korteweg 2001), and 270 of them have a reliable redshift reported in the literature. The MEFOS observations have resulted in 251 galaxy redshifts in the Crux region (see Table 1), of which 2 were tentative measurements. Fifteen galaxies of the MEFOS sample had a previous redshift measurement, so 234 new reliable redshifts have been obtained. This increases the total number of galaxies in the Crux region with a redshift to 504 (13.4%).
As before in the Hydra/Antlia region, the MEFOS sample contributes predominantly to the faint end of the galaxy distribution (upper-middle panel of Fig. 4). The mean magnitude of the 249 galaxies MEFOS sample is = 180, again only slightly brighter than the overall mean magnitude of all the galaxies in the Crux region ( = 182, Woudt & Kraan-Korteweg 2001).
3.3 The Great Attractor region
4423 Galaxy candidates have been identified in the Great Attractor region (Woudt & Kraan-Korteweg 2001), 413 of them have a reliable redshift (NED, May 2003). The Norma cluster (ACO 3627, Abell et al. 1989) is the region of highest galaxy density in the GA region, and as a result a large number of the MEFOS fields were centred on the Norma cluster (see also the lower panel of Fig. 1). We have obtained 328 redshifts in the GA region, one of which is a tentative measurement. Of the remaining 327 galaxies, 38 had a previously published redshift, therefore the MEFOS spectroscopy has resulted in 289 new galaxy redshifts in the GA region. A total of 702 galaxies (15.9%) of all the galaxies in the GA region now have a redshift (literature + MEFOS).
The mean brightness of the 327 galaxies in the MEFOS sample is = 169, about 1 magnitude brighter than the MEFOS sample in the Hydra/Antlia and Crux regions. This is due to the presence of a nearby overdensity – the rich Norma cluster (Kraan-Korteweg et al. 1996) – in the GA region, whereas most of the regions of high galaxy density in the Hydra/Antlia and Crux region correspond to more distant clusters (see Sect. 4).
3.3.1 The Norma cluster
Within the Abell radius of the Norma cluster (defined as Mpc), 603 galaxies are present in our galaxy catalogue (Woudt & Kraan-Korteweg 2001). We have now obtained redshifts for 265 of them (= 44%) – 130 of these were obtained with MEFOS. Of the 265 galaxies with a reliable redshift, 214 are comfirmed cluster members. The others are clear foreground/background galaxies. Prior to our redshift survey, only 17 redshifts were known within the Abell radius of the Norma cluster.
For galaxies with , 80% now have a reliable redshift. Most of the missing bright galaxies are low surface brightness spirals, which have been observed with the Parkes 64-m radio telescope and will be presented elsewhere.
A detailed dynamical analysis of the Norma cluster will be presented elsewhere (including recently obtained 2dF spectroscopy of the Norma cluster). It is clear, however, that the MEFOS observations form an essential basis for this analysis.
4 Identification of large-scale structures

4.1 Velocity distribution
The velocity histograms in Fig. 5 show that distinctly different large-scale structures are present in the Hydra/Antlia, Crux and GA region, respectively.
The Hydra/Antlia region shows a strong peak at km s-1, which corresponds to the extension of the Hydra/Antlia supercluster in to the Zone of Avoidance (Paper I; Kraan-Korteweg 2000). In addition, an overdensity at 6000 km s-1 is present, associated with the Vela overdensity (Paper I). The MEFOS spectra have not added much information to the nearby structures ( km s-1), but instead have unveiled more distant galaxies. Most of the redshifts of galaxies beyond 10 000 km s-1 have come from the MEFOS spectroscopy. In the Hydra/Antlia region, there are 16 galaxies with heliocentric velocities in excess of 30 000 km s-1 (not shown in Fig. 5). These are all obtained with MEFOS.
In the Crux region, a broad concentration of galaxies around km s-1 is present (middle panel of Fig. 5). This broad concentration – a combination of the Centaurus-Crux cluster (Woudt 1998, also known as CIZA J1324.7-5736 (Ebeling et al. 2002)) and the large-scale overdensity between the Norma cluster and the Vela cluster (see also panel C of Fig. 6) – is very different from the distinct peaks at 2750 km s-1 and 5000 km s-1, in the Hydra/Antlia and Great Attractor region, respectively. Again, the MEFOS observations trace the more distant galaxies more efficiently compared to the earlier SAAO data (Papers I – III). In the Crux region, 32 galaxies are located beyond 30 000 km s-1. Again, all these redshifts were obtained with MEFOS.
The GA region is dominated by four distinct peaks, the most prominent of which is associated with the Norma cluster and its surrounding great wall-like structure at 4848 61 km s-1 (Kraan-Korteweg et al. 1996; Woudt 1998). The other peaks are at 10 406 82 km s-1, 14 050 84 km s-1 and 18 689 81 km s-1. The peak at 14 050 km s-1 belongs to the Ara cluster (Woudt 1998; Paper III; Ebeling et al. 2002). Together with the adjacent Triangulum-Australis cluster (McHardy et al. 1981), the Ara cluster is part of a larger overdensity referred to as a ’Greater Attractor behind the Great Attractor’ by Saunders et al. (2000). Saunders et al. find evidence for such an overdensity at 12 500 km s-1 and () from the reconstructed IRAS galaxy density field. In the GA region there are 18 galaxies more distant than 30 000 km s-1, all derived from MEFOS observations.
4.2 Sky projection; local cosmography
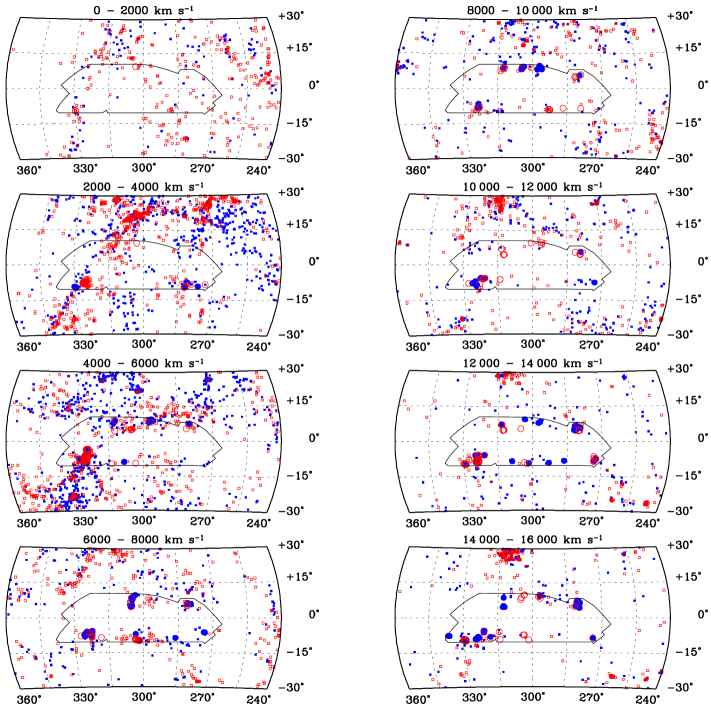
In Fig. 6, all the galaxies out to 16 000 km s-1 are shown in an Aitoff projection of a limited area of the sky (, ). They are separated in eight individual slices, each 2000 km s-1 thick, but within each panel the different symbols mark a subdivision: the filled symbols show the ‘nearer’ 1000 km s-1 (e.g. 0 – 1000 km s-1 in the top-left panel), the open symbols the ‘further’ 1000 km s-1 (e.g. 1000 – 2000 km s-1 in the top-left panel). The data shown are literature values (small squares: NED, May 2003) combined with the MEFOS heliocentric velocities (big circles). The Aitoff projections are centred on and .
Here, we will discuss the unveiled large-scale structures behind the southern Milky Way out to 16 000 km s-1, in relation to the structures visible away from the Galactic Plane (GP).
km s-1: The Supergalactic Plane (SGP) is visible as a concentration of galaxies starting from the Virgo cluster (located outside this panel at = ()), crossing the GP at , and continuing down towards the south Galactic pole. Also, the Fornax wall is discernable in the 1000 – 2000 km s-1 range as an overdensity of galaxies starting from the Fornax cluster at () = () towards (and crossing) the GP at . The GA overdensity is dominant in the next two slices.
km s-1: The vertical band of galaxies associated with the SGP in the previous slice is very pronounced in this redshift slice (and the next one); this is the Centaurus wall, a very extended structure (both on the sky, as in depth), incorporation both the Centaurus cluster () = () and the Norma cluster () = (). The Norma cluster is visible in this panel, but is most pronounced in the range 4000 – 6000 km s-1. A wall-like structure is also visible crossing the GP at . This is the Hydra wall, encompassing the Hydra cluster () = () and the Puppis cluster () = (), and continuing towards () = ().
km s-1: A large structure of galaxies is seen below the GP extending from ) () – located outside the boundary of this plot – to the Norma cluster. This structure, which is part of the Norma supercluster, is under a slight angle with respect to the Centaurus wall in the previous two slices. Here, the Norma supercluster and the Centaurus wall possibly intersect. Also, parts of the Norma supercluster can be seen (in the more distant 5000 – 6000 km s-1 range – north of the GP around , incorporating the Vela cluster (Kraan-Korteweg & Woudt 1994) and the Centaurus-Crux cluster (Woudt 1998). From X-ray observations, the latter (CIZA J1324.7-5736) appears possibly as massive as the Norma cluster (Ebeling et al. 2002).
km s-1: The finger-of-god effect for both the Norma cluster and CIZA J1324.7-5736 cluster appear in this panel. In this velocity range, few, or none, extented structures are seen in the southern sky.
km s-1: There is a slight overdensity north of the Galactic plane at in the nearer range (filled circles), but no distinct clusters are visible in our surveyed region. Note, however, the Ophiuchus cluster (Hasegawa et al. 2000) at the edge of the plot () (, 8500 km s-1).
km s-1: The Shapley region comes into view at () (). Behind the Norma cluster () an overdensity is visible (continuing into the next panel), corresponding to the peak in Fig. 5 at 10 500 km s-1.
km s-1: In these more distant slices, the Shapley region dominates the galaxy distribution above the GP, and within our surveyed region various clusters are visible (see also the pie diagrams shown in Fig. 7). The most massive cluster is the Ara cluster (see also Sect. 4.1.) at () ( km s-1, 1182 km s-1).
4.3 Pie diagrams
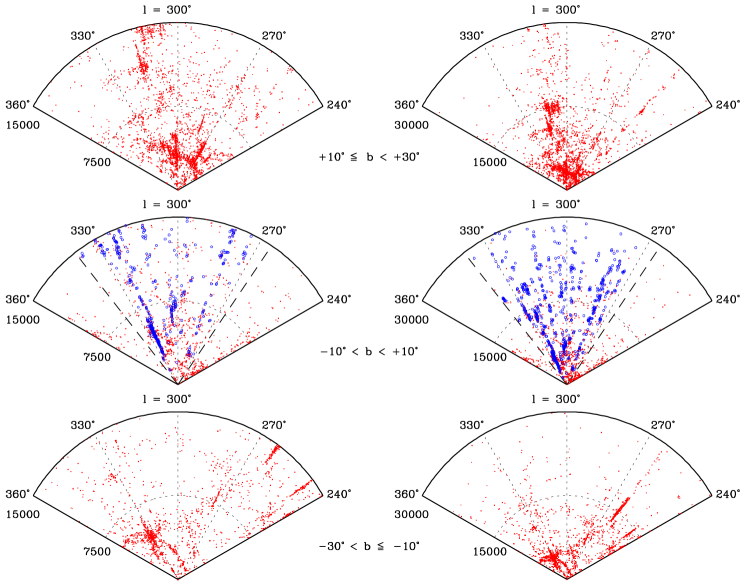
An alternative view of the large-scale structures in this part of the sky (, ) is given by the pie diagrams in Fig. 7. They show the galaxy distribution out to 15 000 km s-1 (left panel), and 30 000 km s-1 (right panel).
In this representation, the Zone of Avoidance is almost indistinguisable from its neighbouring (unobscured) region above and below the GP. In the Zone of Avoidance out to 30 000 km s-1 (middle right panel of Fig. 7), there are 1857 galaxies. In the adjacent region below the Galactic Plane (lower right panel), 1981 galaxies are present; an almost identical number of galaxies. Above the GP more galaxies are present (). Note, however, that most of the redshifts in the Zone of Avoidance are for galaxies in the Galactic latitude range of . It is remarkable, nonetheless, that this region of the sky that was previously devoid of information, now shows clear clusters, superclusters and voids.
In the galaxy distribution out to 15 000 km s-1 (middle left panel), the Norma cluster at = ( km s-1) dominates the pie diagram. It is located centrally in an overdensity that connects the Centaurus cluster ( ( km s-1) and Hydra cluster () km s-1) above the GP (upper left panel) with the Pavo II cluster () ( km s-1) below the GP (lower left panel). This entire large-scale structure is the optical counterpart of the Great Attractor. The Centaurus-Crux cluster (almost dead centre in the middle left panel) at ) ( km s-1) is also part of the GA. The MEFOS observations of the Norma cluster form the basis for a detailed dynamical study of this rich and nearby cluster at the heart of the Great Attractor. Recently, we have obtained 2dF spectroscopy of the Norma cluster (primarily for velocity dispersion measurements of the elliptical galaxies in the cluster in order to determine the distance to the Norma cluster via the Fundamental Plane analysis). The results of this – and the dynamical analysis of the cluster – will be presented in a separate paper.
Out to 30 000 km s-1, many clusters in the velocity range 12 500 – 20 000 km s-1 are visible (middle right panel), the most prominent is the Ara cluster at ) = ( km s-1).
5 Summary
Multi-fibre spectroscopy with MEFOS on the 3.6-m telescope of ESO has resulted in 764 redshifts in the southern Zone of Avoidance. Contrary to the SAAO and Parkes components of our redshift survey in the Zone of Avoidance, MEFOS has focussed on the faint end of the galaxies in our optical galaxy catalogue in the high galaxy-density regions. As a result, MEFOS has contributed significantly to the knowledge of low Galactic latitude clusters at km s-1.
Acknowledgements.
This research has made use of the NASA/IPAC Extragalactic Database (NED), which is operated by the Jet Propulsion Laboratory, Caltech, under contract with the National Aeronautics and Space Administration. PAW kindly acknowledges financial support from the Antares fund and from the National Research Foundation. RCKK thanks CONACyT for their support (research grant 27602E). We thank the Referee, Dr. R. Peletier, for the many useful comments and suggestions. Part of this survey was performed at the Kapteyn Astronomical Institute of the University of Groningen and at the Observatoire de Paris-Meudon. Their support is greatfully acknowledged.References
- (1) Abell, G.O., Corwin, H.G., & Olowin R.P. 1989, ApJS 70, 1
- (2) Batuski, D.J., Miller, C.J., Slinglend, K.A., et al. 1999, ApJ 520, 491
- (3) Colless, M., Dalton, G., Maddox, S., et al. 2001, MNRAS 328, 1039
- (4) Cuby, J.G., & Mignoli, M. 1994, Proc.SPIE 2198, 98
- (5) Dressler, A., Faber, S.M., Burstein, D., et al. 1987, ApJ 313, 37
- (6) Ebeling, H., Mullis, C.R., & Tully, R.B. 2002, ApJ 580, 774
- (7) Fairall, A.P., Woudt, P.A., Kraan-Korteweg, R.C. 1998, A&AS 127, 463 (Paper II)
- (8) Felenbok, P., Guérin, J., Fernandez, A., et al. 1997, Exp. Astronomy 7, 65
- (9) Hasegawa, T., Wakamatsu, K., Malkan, M., et al. 2000, MNRAS 316, 326
- (10) Hill, J.M., & Oegerle, W.R. 1993, AJ 106, 831
- (11) Juraszek, S.J., Staveley-Smith, L., Kraan-Korteweg, R.C., et al. 2000, AJ 119, 1627
- (12) Kolatt, T., Dekel, A., & Lahav, O. 1995, MNRAS 275, 797
- (13) Kraan-Korteweg, R.C. 2000, A&AS 141, 123
- (14) Kraan-Korteweg, R.C., & Lahav, O. 2000, A&ARv 10, 211
- (15) Kraan-Korteweg, R.C., & Woudt, P.A. 1994, in Unveiling Large-Scale Structures behind the Milky Way, eds. C. Balkowski & R.C. Kraan-Korteweg, ASP Conf. Ser. 67, 89
- (16) Kraan-Korteweg, R.C., Cayatte, V., Balkowski, C., et al. 1994, in Unveiling Large-Scale Structures Behind the Milky Way, eds. C. Balkowski & R.C. Kraan-Korteweg, ASP Conf. Ser. 67, 99
- (17) Kraan-Korteweg, R.C., Fairall, A.P., & Balkowski, C. 1995, A&A 297, 617 (Paper I)
- (18) Kraan-Korteweg, R.C., Henning, P.A., & Schröder, A. 2002, A&A 391, 887
- (19) Kraan-Korteweg, R.C., Woudt, P.A., Cayatte V., et al. 1996, Nature 379, 519
- (20) Lauberts, A. 1982, The ESO/Uppsala Survey of the ESO (B) Atlas, ESO: Garching
- (21) Lynden-Bell, D., Faber, S.M., Burstein, D., et al. 1988, ApJ 326, 19
- (22) McHardy, I.M., Lawrence, A., Pye, J.P., et al. 1981, MNRAS 197, 893
- (23) Pinkney, J., Rhee, G., Burns, J.O., et al. 1993, ApJ 416, 36
- (24) Saunders, W., D’Mellow, K.J., Valentine H., et al. 2000, in Mapping the Hidden Universe: the Universe behind the Milky Way – the Universe in HI, eds. R.C. Kraan-Korteweg, P.A. Henning & H. Andernach, ASP Conf. Ser. 218, 141
- (25) Schlegel, D.J., Finkbeiner, D.P., & Davis, M. 1998, ApJ 500, 525
- (26) Tonry, J.L., & Davies, R.L. 1979, AJ 84, 1511
- (27) Tonry, J.L., Blakeslee, J.P., Ajhar, E.A., et al. 2000, ApJ 530, 625
- (28) de Vaucouleurs G., de Vaucouleurs, A., & Corwin, H.G. 1976, Second Reference Catalogue of Bright Galaxies, Univ. Texas Monographs in Astron. No. 2, Austin: Univ. of Texas
- (29) Visvanathan, N., & Yamada T. 1996, ApJS 107, 521
- (30) Woudt, P.A. 1998, Ph.D. Thesis, University of Cape Town
- (31) Woudt, P.A., & Kraan-Korteweg, R.C. 2001, A&A 380, 441
- (32) Woudt, P.A., Kraan-Korteweg, R.C., & Fairall, A.P. 1999, A&A 352, 39 (Paper III)
- (33) Zehavi, I., Blanton, M.R., Frieman, J.A., et al. 2002, ApJ 571, 172