NACO Polarimetric Differential Imaging of TW Hya:
We present high-contrast imaging data on the disk of the classical T Tauri star TW Hya. The images were obtained through the polarimetric differential imaging technique with the adaptive optics system NACO. Our commissioning data show the presence of polarized disk emission between 0.1″ and 1.4″ from the star. We derive the first Ks-band radial polarized intensity distribution. We show that the polarized intensity compares well to shorter wavelengths surface brightness observations and confirm the previously reported gradual slope change around 0.8″. These results show the potential of the new polarimetric differential imaging technique at 8m-class telescopes to map the inner regions of protoplanetary disks.
Key Words.:
Circumstellar matter – planetary systems: protoplanetary disks – Stars: individual: TW Hya – Techniques: polarimetric1 Introduction
The simulations of viscous disks with an embedded Jupiter-mass planet (see, e.g. D’Angelo et al. dan03 (2003)) predict dramatic changes in the disk structure: gaps are being opened and shock waves follow the path of the orbiting body. Detecting these signatures is an important step in confirming that our models for planet formation and disk evolution are right and would provide a unique possibility to study a newly formed exoplanet and its interaction with the circumstellar material.
However, the investigations of protoplanetary disks require high-contrast, high-spatial-resolution imaging very close to the bright central star. Although in recent years numerous groups studied disks around nearby stars at their planet-forming age with the HST, instrumental limitations do not allow to probe the disk structure at scales similar to our inner Solar System. The technique of polarimetric differential imaging (PDI) as described by Kuhn et al. (kuh01 (2001)) is capable of tracing scattered (i.e. polarized) light from a circumstellar disk very close to the central star. This promising method enhances the contrast between the disk and the star and, thereby, might be important to detect the detailed inner structure of protoplanetary disks.
The basic idea of the PDI is to take the difference of two orthogonally polarized, simultaeneously acquired images of the same object in order to remove all non-polarized light components. The non-polarized light consists mainly of the central star’s light and the speckle noise, which is – close to the star – the dominant noise source of ground-based observations at optical and near-infrared wavelengths (Racine et al. rac99 (1999)). After this subtraction only the polarized light, such as scattered light from the disk, is left over.
To explore the potential of this technique for planet formation studies as well as to demonstrate the NACO/VLT platform capabilities we targeted the 8 Myr old (Webb et al. web99 (1999)) and very close ( pc, Wichmann et al. wic98 (1998)) classical T Tauri star TW Hya (RA: Dec: J2000). At the visual wavelength regime TW Hya shows a polarization variability between 0-3% (Mekkaden mek98 (1998)). Being an excellent target for planet formation studies, during the past few years several attempts have been made to image its disk as close as possible to the star and to identify possible disk structures (Krist et al. kri00 (2000), Weinberger et al. wei02 (2002)). In addition, the presence of a giant planet was predicted (Calvet et al. cal02 (2002)) from modeling the spectral energy distribution (SED) (see also Steinacker & Henning ste03 (2003)). The first application of the PDI to TW Hya by Potter (2003a , 2003b ) made use of the 36 element curvature sensing Adaptive Optics (AO) system Hokupa’a (Graves et al. gra00 (2000)), of the Gemini North telescope. This H-band data set probed the circumstellar material closer than 0.5″to the star.
In the following we describe the first results obtained with the PDI technique and the 188 element Shack-Hartmann AO system NACO, which is attached to the Nasmyth B port of the VLT UT4.
2 Observations and Data Reduction
The observations were carried out in April 2002 during the commissioning of the NACO/VLT system (Lenzen et al. len98 (1998), Rousset et al. rou98 (2003), Hartung et al. har00 (2000)) in the Ks band. In order to simultaneously measure two orthogonal components of the polarized light, a Wollaston prism was introduced in the light path. The Wollaston prism splits the light into an ordinary and an extraordinary beam (o- and e-beam), separated by 3.5″ in the Ks-band. To eliminate the instrumental polarization and to increase the signal-to-noise ratio (SNR) of the data, a redundant data set with Wollaston angles of 0, 45, 90 and 135 was acquired. Each of these images has a field of view (FOV) of 3 sampled with a pixel size of 0.027/pixel. At every Wollaston position a 3-point dithering was applied with steps of about 9 along the field of view to allow sky subtraction and to reduce the influence of bad pixels. No additional off-source sky frames were taken.
To ensure the high dynamic range needed for disk analysis, we repeated the complete set of these observations with defined integration times of 0.4 s and 30 s. The total time spent on the source was 24 s and 1800 s in the short and long exposure series, respectively. As the TW Hya saturated the detector, the AO-performance can not be accurately measured. However, based on simulations with the NAOS Prepartion Software v1.62 we estimate a typical Strehl-ratio of 50% for these observations.
The data reduction was carried out using self–developed IDL routines. First, every frame was manually inspected and those showing reflections or electronic ghosts were excluded from further reduction. Hot pixels were efficiently removed by a 3.5-sigma filtering process. The raw images were sky subtracted and flat field corrected. The sky frame was calculated individually for each group of images taken with the same polarization angle. Following these basic corrections, the ordinary and extraordinary peaks of the individual exposures were centered and extracted. To remove all of the non-polarized intensity (mainly from the central star) we subtracted images of ordinary polarization from those of extraordinary polarization.
The fine alignment of the individual images before subtraction and co-addition was carried out by a two-level gaussian fitting procedure (see also Section 4).
The subtraction process gives the orthogonal and Stokes components, standing
for the number of dithering positions. For the 4 angles of the Wollaston prism we
thus derived the values for , , and (see, e.g. Huard hua97 (1997)).
Using the redundancy of our data set we derived the and mean polarization
vectors:
and the polarized intensity:
This reduction procedure was repeated independently on both the long and the short exposure series, resulting in the and polarized intensity maps.
Due to the brightness of TW Hya, the inner regions of the raw frames exceeded the regime of linear detector response. These data points ( in the short exposure series and in the long exposure series) were excluded from the data reduction and further analysis. The field of view (FOV) was limited to by the field mask. During the dithering process slight movements perpendicular to the dithering directions occured. Since the resulting FOV is the intersection of the FOVs of the individual frames, the final field of view was reduced to and for the short and long exposure series, respectively.
To characterize the surface brightness distribution of the disk we measured the radial profile of the polarized intensity, derived from 3-pixel-wide apertures, roughly equivalent to the full width at half maximum (FWHM) of the point spread function (PSF).

3 Signal Analysis
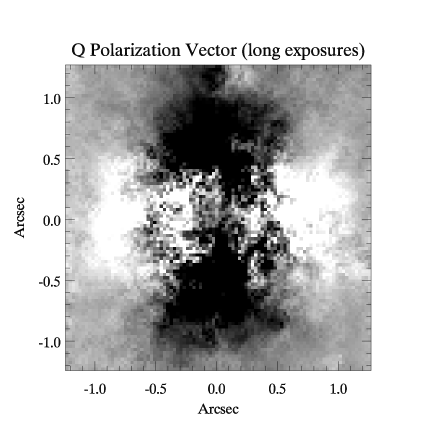
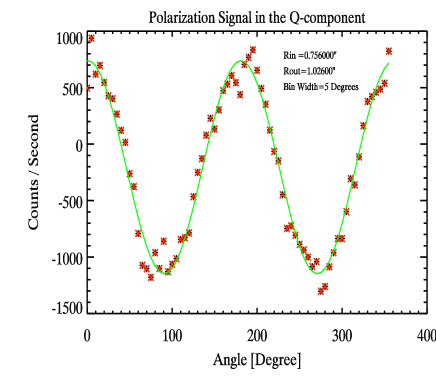
For detecting the polarization signal as close as possible to the star a very careful data inspection is essential – residuals from the subtractions as well as sub-pixel misalignments between the individual frames are the dominant noise sources. While the scalar PI image contains no information on the direction of the polarization, the Q- and U-components are projections of the polarization vector and thus show a sinusoidal modulation with the angle in respect to the polarization direction of the Wollaston-prism (i.e. a maximum at the angles parallel to the polarization direction of the Wollaston prism and a minimum perpendicular to it). In the case of axisymmetrically distributed dust this modulation leads to the butterfly pattern as shown in the right panel of Fig. 1 and described in Kuhn et al. (kuh01 (2001)). By using the information about the polarization orientation and by comparing this pattern to what is expected from an axi-symmetric light scatterer, we can better discriminate between noise and signal.
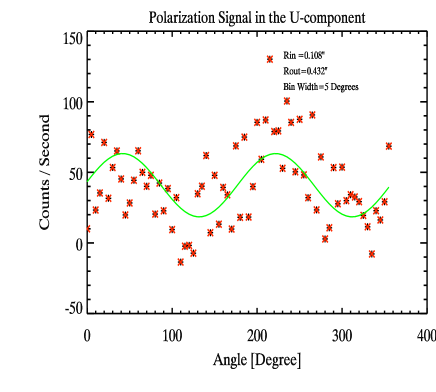
The right panel of Fig. 1 shows the Q-component of the polarization signal radially integrated (over 5-degree bins) in an annulus between 0.75″ and 1.0″ from the long exposure series. A very similar, but /2-shifted modulation is evident in the U-images. The clearly sinusoidal modulation arises from the strong polarization signal. When probing the extent of the polarized circumstellar material, we looked for the presence of a similar pattern (phase- and frequency-correct sinusoidal modulation) as a function of radial distance from TW Hya.
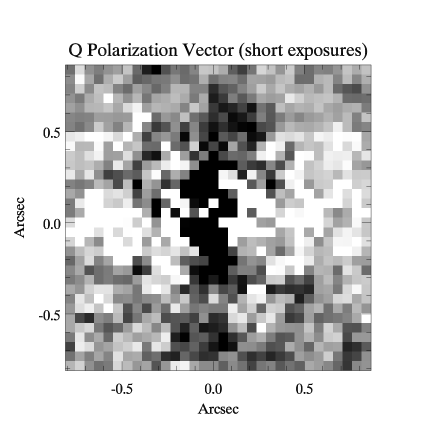
We found an extended polarization pattern with a high signal-to-noise ratio between 0.5 and 1.4″ distance from the star in both the Q and U long exposure images. In the short exposure images we identified light-scattering material between 0.2″ and 0.4″ from TW Hya in both the Q- and U-components. Inspection of the higher signal-to-noise Q-component (short exposure) showed this pattern also between 0.1″and 0.2″ (see the left panel of Fig. 2).
In order to estimate the contrast ratio between the polarized and the unpolarized fluxes we compared the fluxes of the direct images (after sky subtraction and bad pixel removal) to the amplitude of the fitted cosine. The typical contrast ratios are 1% and 3.5–4% for radii of – and , respectively.
4 Reliability Tests and Confirmation
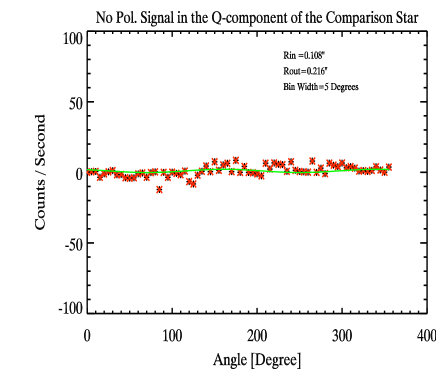
To confirm our results, we analyzed the Q- and U-components of the PDI data set of the PSF-comparison star GSC 07208-00319, which was observed and reduced in an identical way to the TW Hya data set. In this case neither polarized emission in the PI image nor any sign of sinusoidal modulation in the Q- and U-band images could be found (see right panel of Fig. 3).
We also conducted extensive tests to check the reliablity of our data reduction and analysis toolkit. During these test runs the effects of the following errors were investigated: sub-pixel shifts between the individual frames, different centering, interpolation, and flat field normalization methods. For each test run the complete data reduction and analysis has been executed both for TW Hya and the PSF comparison star.
As the possible sub-pixel misalignments might produce a bipolar, positive-negative pattern mimicking the butterfly pattern of the extended polarization signal, special care was taken to investigate their effects on our results. In order to simulate centering problems, we have introduced normally distributed random shifts with FWHMs of 0.2, 0.5, 1.0 and 1.5 pixels after the centering step. The sinusoidal modulation of the TW Hya short exposure frames gets strongly distorted and asymmetric even for the sub-pixel misalignments (0.2 and 0.5) and the pattern is completely disrupted for misalignments as large as 1 or 1.5 pixels. The short exposure images of the PSF comparison star start to show a sinusoidal modulation, but its frequency is one half of that of the polarization signal. These images show, in fact, offset negative and positive peaks which can easily be discriminated from the butterfly pattern shown in Fig. 1. The long exposure images are less sensitive to sub-pixel misalignment but are noticeably distorted in the case of large (1 or 1.5 pixel) centering errors.
In order to explore the influence of systematic errors in the centering procedure we have introduced fixed shifts of 0.1 and 0.2 pixels after our centering procedure. We found that systematic centering errors as small as 0.1 pixels lead to a strong positive-negative pattern and the disruption of the polarization signal. These systematic errors produced similar pattern for the PSF comparison star as reported for the case of random shifts and can, therefore, not resemble the correct polarization pattern.
Additional tests included the comparison of centering methods based on cross-correlation and on Gauss fitting, bilinear and cubic interpolations at the rotation of the images, as well as the local and global normalization of the flat field images. We found that the Gauss-fitting centering, the bilinear interpolation and the individual normalization of each stripe in the Wollaston-masked flat field leads to the highest signal-to-noise ratios.
These test runs proved that the strongest noise sources in the reduction procedure are the subpixel misalignments and the flat field errors. We found no combination of the artificially introduced errors that could create a false (phase- and frequency-correct) sinusoidal modulation and thus could lead to the misinterpretation of our data set.
Chromatic effects from the Wollaston prism could also lead to slight differences between the o- and e-beams and thus to an imperfect subtraction. However, the MgF2 prism used in the CONICA camera introduces a relative displacement of only 86 mas between the blue and red edge of the broad K-band (CONICA Manual). In the narrower Ks-band this effect is even smaller and is therefore not expected to influence the PDI observations.
As TW Hya and the PSF star were observed in very similar airmass ranges (1.02 – 1.08 and 1.09 – 1.22) and seeing conditions (0.6″), we expect that any atmospheric effect leading to a false polarization signal would effect the PSF comparison images in the same way. Since there is no evidence for such an atmospheric influence in the comparison images (see right panel of Fig. 3), we exclude atmospheric chromatism as a possbility to mimick PDI signals.
The examination of the data reduction, possible instrumental and atmospheric effects led us to conclude that the extended polarization signal in our images indeed originate from the light scattering on the circumstellar dust around TW Hya.
5 Results
Based on the NACO observations, we obtained Ks-band images of the circumstellar disk around the classical T Tauri star TW Hya, which probe the disk structure closer to the star than any previous observation. Our diffraction limited PDI of TW Hya shows an extended butterfly pattern (see Figs. 1, 2) characteristic for a spatially resolved axisymmetric light scattering source. This pattern is present between 0.5″ and 1.4″ on the long exposure Q- and U-images and between 0.1″ and 0.4″ in the short exposure images. The observations of the regions closer than 0.1″ to the star and between 0.4″ and 0.5″ do not have sufficient SNR for a reliable analysis. The SNR of the data set is sufficiently high to plot the azimuthally integrated Ks-band surface brightness density distribution between 0.5″ and 1.4″ (see Fig. 4).
6 Discussion
6.1 Scattering
The presence of the extended polarization signal across our FOV confirms the existence of light scattering material. The sinusoidal modulation of the Q- and U-images confirms the centrosymmetric polarization pattern. The fact that we detected such emission even as close as 0.1″ (6 AU) to TW Hya is the first direct evidence that its dust disk extends so far in. This detection does not support the model of Krist et al. (kri00 (2000)) who proposed the presence of an inner ’dark’ zone ( AU = 0.3″) with suppressed flaring angle, necessary to explain the exceptional brightness of the TW Hya disk.
Based on the modeling of the SED, Calvet et al. (cal02 (2002)) predicted the presence of a mostly dust-evacuated inner gap at AU (). Such a gap could be a tell-tale signpost of a massive planet in close orbit around TW Hya and would be of high importance. However, our commissioning data do not allow to draw any definite conclusions on the existence of this feature.
6.2 Radial Profile and Slope Change
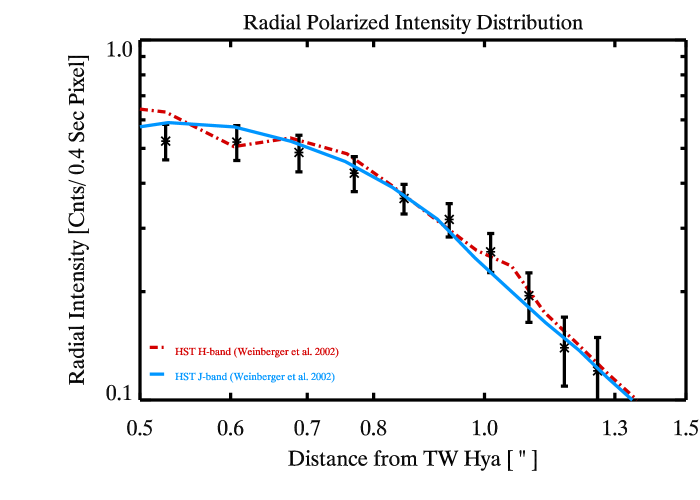
In Fig. 4 we show the comparison of the radial polarized intensity derived from our PDI observation and (arbitrarily shifted) radial surface brightness profiles measured by the HST (Weinberger wei02 (2002)). Although these measurements probe different quantities at different wavelengths (Ks and J, H, respectively) a remarkable similarity is evident between the radial slopes. Based on this similarity, we conclude that the polarization degree is nearly independent of the radius and thus the polarized intensity characterizes the surface brightness. Thus, the PDI method can lead to contrast enhancement without the loss of information.
The radial surface brightness profile between and can be well fitted by a power-law function . This is slightly steeper than the behaviour found by Weinberger et al. (wei02 (2002)) at 1.1 and 1.6 m, for the region between 0.8″ and 2.7″.
To place our results in context, we compare them to surface brightness slopes predicted by simple analytical approximations (e.g. Whitney & Hartmann whi92 (1992)). These approximations consider only isotropic scattering and simple geometric effects and do not include wavelength-dependent terms. The predicted surface brightness power-law exponent for an optically thick, geometrically thin disk is , while for a flaring disk an exponent of -2 is expected. Our Ks-band results in the region support the flat disk geometry or a very small flaring. However, the surface brightness slope is determined by an intricate interplay between many disk and dust parameters and is not a conclusive measure of the disk geometry.
As to underline this statement, a strong, gradual change in the brightness profile around 0.8″ from TW Hya is evident. The annulus between is characterized by the very gentle surface brightness behaviour of . The slope of the curve is even less steep than that expected from a flared disk (Whitney & Hartmann whi92 (1992)).
Although the radial brightness slope is strongly influenced by the disk geometry, slope changes can have different origins. Even though a detailed analysis of the reasons of the slope changes is beyond the scope of the current paper, we refer to some of them. The most obvious one is an actual change in the surface density slope of the disk, translating into a slope change in the surface brightness. Such clear-cut changes might be the results of external or internal perturbation of the disk by a companion or a massive planet as seen in the case of HR 4796A (see, e.g. Boccaletti et al. boc03 (2003)).
A second cause might be the change of the flaring angle and through this the change in the illumination of the disk’s surface. Alternatively, a radial dependence of the scattering cross section of the dust grains might introduce modulations in the surface brightness profile. Disentangling the effects of these processes requires high-angular resolution observations at longer wavelengths.
We note, that this change in the slope at 0.8″ has been detected previously at shorter wavelengths by HST direct imaging and coronographic studies (Krist et al. kri00 (2000), Weinberger et al. wei02 (2002)), together with other slope changes in the outer parts (1.4″) of the disk.
Our data were acquired during the commissioning of the NACO instrument and suffer from high detector noise and limited AO performance. The current performance of NACO is expected to result in roughly five times better SNR.
The first results of a PDI survey of the TW Hya Association are presented by Huélamo & Brandner (hue03 (2003)).
For future PDI observers it might be important to point out some of the limiting factors in our data set. First, the dynamic range of the data set has to be increased by applying series of different exposure times. Furthermore, the flat field calibration plays a critical role and should be carried out with great care. Finally, the neccessarily saturated star will pose limitations to the accurate alignment of the individual frames, which will in practice determine the inner radius until which the polarization signal can be detected.
7 Summary
We presented the first high-contrast observations carried out with NACO/VLT using the PDI technique. The extended scattering pattern of TW Hya provides the first direct proof that the disk extends closer than 0.5″, up to 0.1″ ( 6 AU) from the star.
We derive the first Ks-band radial polarized intensity profile between 0.5″ and 1.4″. This profile strongly resembles the surface brightness profile seen at shorter wavelengths and shows as well a strong, gradual slope change around 0.8″. The polarized intensity profile between 0.9″ and 1.4″ stands close to that expected from a flat disk.
These results demonstrate the potential of the PDI technique at the NACO/VLT platform for future planet formation studies. This technique is capable of imaging a new, beforehand unaccessible regime of circumstellar disks at very high resolution. Such images can help understanding the evolution of protoplanetary disks at the scales comparable to our inner Solar System.
Acknowledgements.
We acknowledge the outstanding support of the ESO staff both in Garching and at Paranal to the construction and commissioning of NACO. We thank O. Schütz for his useful comments on the manuscript. The suggestions of the referees (R. Racine and P. Bastien) helped to improve the clarity of the paper.References
- (1) Boccaletti, A., Augereau, J.-C., Marchis, F., & Hahn, J. 2003, ApJ, 585, 494
- (2) Calvet, N., D’Alessio, P., Hartmann, L., Wilner, D., Walsh, A., & Sitko, M. 2002, ApJ, 568, 1008
- (3) D’Angelo, G., Kley, W., & Henning, Th. 2003, ApJ, 586, 540
- (4) Graves, J. E., Northcott, M. J., Roddier, F. J., Roddier, C. A., Potter, D. O’Connor, D. J., Rigaut, F. J., & Chun, M. R. 2000, First light for Hokupa’a 36 on Gemini North. In Adaptive Optical Systems Technology, ed. P. L. Wizinowich, Proc. of the SPIE, vol. 4007, 26
- (5) Hartung, M., Bizenberger, P., Boehm, A., Laun, W., Lenzen, R., & Wagner, K. 2000, First test results and calibration methods of CONICA as a stand-alone device. In Optical and IR Telescope Instrumentation and Detectors, ed. M. Iye & A. F. Moorwood, Proc. of the SPIE, vol. 4008, 830
- (6) Hartigan, P., Hartmann, L., Kenyon, S. J., Strom, S. E., & Skrutskie, M. F. 1990, ApJ, 354, L25
- (7) Huard, S., Polarization of Light, John Wiley & Sons 1997
- (8) Huélamo, N., & Brandner, W. 2003, Dual Imaging Polarimetry Observations of Circumstellar Disks in TW Hydrae: The NACO View. In Toward Other Earths – Darwin/TPF and the Search for Extrasolar Terrestrial Planets, Proceedings, ed. M. Fridlund & Th. Henning, in press
- (9) Krist, J. E., Stapelfeldt, K. R., Ménard, F., Padgett, D. L., & Burrows, C. J. 2000, ApJ, 538, 793
- (10) Kuhn, J. R., Potter, D., & Parise, B. 2001, ApJ, 553, 189
- (11) Lenzen, R., Hofmann, R., Bizenberger, P., & Tusche, A. 1998, CONICA: the high-resolution near-infrared camera for the ESO VLT. In Infrared Astronomical Instrumentation, ed. A. M. Fowler, Proc. of the SPIE, vol. 3354, 606
- (12) Mekkaden, M. V. 1998, A&A, 340, 135
- (13) Potter, D. 2003a, PhD thesis, University of Hawaii
- (14) Potter, D. 2003b, PASP, submitted
- (15) Racine, R., Walker, G. A. H., Nadeau, D., Doyon, R., & Marois, Ch. 1999, PASP, 111, 587
- (16) Rousset, G., Lacombe, F., Puget, P., et al. 2003, NAOS, the first AO system of the VLT: on-sky performance. In Adaptive Optical System Technology II, ed. P. L. Wizinowich & D. Bonaccini, Proc. of the SPIE, vol. 4839, 140
- (17) Steinacker, J., & Henning, Th. 2003, ApJ, 583, L35
- (18) Wichmann, R., Bastian, U., Krautter, J., Jankovics, I., & Rucinski, S. M. 1998, MNRAS, 301, L39
- (19) Weinberger, A. J., Becklin, E. E., Schneider, G., Chiang, E. I., Lowrance, P. J., Silverstone, M., Zuckerman, B., Hines, D. C., & Smith, B. A. 2002, ApJ, 566, 409
- (20) Webb, R. A., Zuckerman, B., Platais, I., Patience, J., White, R. J., Schwartz, M. J., & McCarthy, C. 1999, ApJ, 512, L63
- (21) Whitney, B. A., & Hartmann, L. 1992, ApJ, 395, 529