Watching the Birth of Super Star Clusters
Abstract
Subarcsecond infrared and radio observations yield important information about the formation of super star clusters from their surrounding gas. We discuss the general properties of ionized and molecular gas near young, forming SSCs, as illustrated by the prototypical young, forming super star cluster nebula in the dwarf galaxy NGC 5253. This super star cluster appears to have a gravitationally bound nebula, and the lack of molecular gas suggests a very high star formation efficiency, consistent with the formation of a large, bound cluster.
Division of Astronomy and Astrophysics, UCLA, Los Angeles, CA 90095-1562 USA
Department of Physics and Astronomy, Tel Aviv University, Ramat Aviv, Israel
1. Introduction
While the first suggestions that young analogues to globular clusters exist in the local universe came from ground-based imaging (Arp & Sandage 1985), the age of the super star cluster really dawned with the subarcsecond imaging capabilities of HST, which allows super star clusters (SSCs) to be resolved in nearby galaxies (e.g., O’Connell et al. 1995, Whitmore & Schweizer 1995) The Antennae galaxies alone have thousands of young (Myr) SSCs (Whitmore et al. 1999.) Some of these clusters are revealed only by infrared imaging (Vigroux et al. 1996); presumably these are the youngest regions. Clues to the mystery of how large and potentially bound clusters form lie in the environments of the youngest, embedded regions, which are visible only in the radio and infrared.
That large extragalactic compact HII regions exist and can be detected was first inferred for the starburst in M83 by Turner, Ho, & Beck (1987) on the basis of a high Brackett line/radio continuum ratio, although their 8′′ (160 pc at M83) infrared beam did not allow them to define the nature of the unexpected Brackett excess (cf. Thompson 1987). With arcsecond mid-infrared imaging, Telesco and Gezari (1992) isolated a compact 12 m source that they suggested was a forming globular cluster in M82. Pina et al. (1992) and Keto et al. (1993) found a similar strong and compact mid-infrared source in the starburst galaxy, NGC 253.
High spatial resolution IR imaging and spectroscopy with HST and large ground-based telescopes and the expanded high frequency imaging capability at the VLA now allow the study of nebulae in the infrared and radio at subarcsecond resolution, corresponding to scales of 1 pc in local galaxies. With this resolution one can now study the star formation processes in individual regions. Due to time and space limitations we will focus on the impact of these observations on issues in the formation of large bound clusters as exemplified by the well-studied young embedded SSC in the dwarf galaxy NGC 5253.
2. Radio Continuum Imaging of the Supernebula in NGC 5253
Improvements in sensitivity and phase calibration at high frequencies at the VLA now allow the detection of young, compact HII regions in nearby galaxies. Free-free emission, with its flat spectrum, is most easily detected at wavelengths shorter than 2 cm, where it dominates over synchrotron emission, which declines with frequency. The other advantage of high frequency observing is that the resolutions are higher at these frequencies; beams as small as 50 mas are now possible with the VLA using the Pie Town link. We can now image parsec-scale structures within nearby starbursts.
NGC 5253 is a peculiar dwarf elliptical galaxy (Caldwell & Phillips 1989), with a starburst that has created numerous star clusters within the past 2.5 to 50 Myr (Calzetti et al. 1997, Tremonti et al. 2001.) There is abundant and extended H emission (Walsh & Roy 1987). Comparison of H and radio continuum (Beck et al. 1996) indicate that extinctions are high toward the radio peak (Calzetti et al. 1997). At a distance of only 3.8 Mpc, we are able to easily resolve the youngest parts of the starburst in NGC 5253.
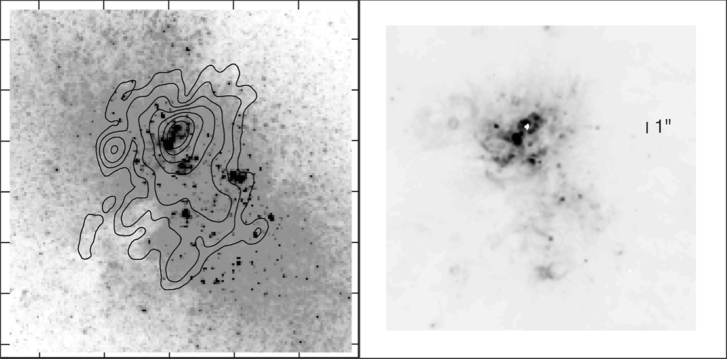
Subarcsecond VLA imaging of NGC 5253 at 2 and 1.3 cm revealed a tiny but luminous nebula (Figure 1). Our most recent Pie Town image has a resolution of 50 mas and shows that the nebula is slightly elliptical, 0.7 pc by 0.9 pc in diameter, and optically thick at 2 cm, with a turnover frequency (=1) of 15 GHz. This tiny nebula contains at least 4000 O stars, and possibly as many as a million stars total, with a luminosity of . About half of this luminosity emerges in mid-infrared dust continuum emission (Gorjian, Turner, & Beck 2001). The high density implied by its high turnover frequency suggests that this “supernebula” is very young. We cannot now say how young, although comparison with Galactic compact HII regions would indicate that it is less than 1 Myr old.
3. What’s Going on in There? Can We Know? A Gravity-Bound Nebula
In order to study the kinematics of the embedded “supernebula” in NGC 5253, spectroscopy in the infrared or radio is required. Radio recombination lines were detected by Mohan, Ananthamariah, & Goss (2001), confirming the basic radio continuum findings of Beck et al. (1996) and Turner et al. (1998). Brackett recombination lines at 2.17 and 4.05 m were detected using NIRSPEC at Keck (Turner et al. 2003). These lines also confirm the radio continuum results. The Brackett line emission in this galaxy is overwhelmingly dominated by the supernebula.
The Brackett lines reveal another interesting and unique property of the supernebula. The Brackett linewidths are , FWHM, consistent with the radio recombination lines of Mohan et al. (2001). This is remarkably narrow for the size and mass of this cluster. For a nebula with diameter 0.7 pc, the escape velocity is for a cluster of 4000 O stars alone; for a Salpeter IMF down to M stars, the escape velocity could be as high as , with virial linewidths only slightly smaller. The supernebula is actually in or close to gravitational equilibrium. Nebulae in the Galaxy are not confined by gravity, nor is the more evolved and diffuse nebula 30 Doradus. This HII region has very different—probably not expanding and possibly static—dynamics.
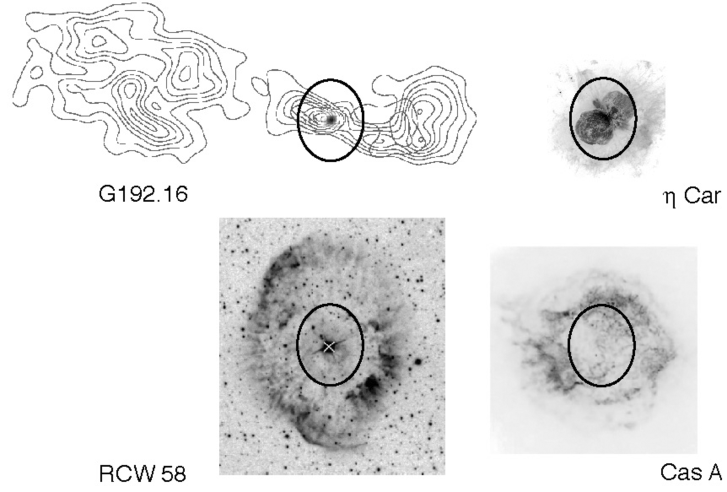
It is worthwhile to pause and reflect on the meaning of this small linewidth in the presence of 4000 O stars within a volume only 1 pc across. It is difficult enough to form a single, solitary O star (see the contribution by H. W. Yorke in this volume), given their violent tendencies, propensity toward outflow (Figure 2a, Shepherd & Kurtz 1999) and general windiness. Outflows, which start in the accretion phase, probably continue throughout a goodly fraction of an O star’s main sequence lifetime (Yorke & Sonnhalter 2002), and radiation-driven winds certainly do. If the O star is massive enough, it may go through a luminous blue variable phase, such as observed in the star Car, and could lose as much as (Figure 2b, Morse et al. 1998). Next is the Wolf-Rayet phase, which occurs for massive stars of a certain age (2-3 Myr); Wolf-Rayet “ring” nebulae have sizes of a few pc and velocities up to (Figure 2c, Gruendl et al. 2000). The ultimate manifestation of the nastiness of an O star is the expulsion of its outer layers in a supernova explosion (Figure 2d, from Hughes et al. 2000). What riotous events are transpiring within the little supernebula? Given the confinement of gas, can we tell? Confinement of gas in itself could have implications for the dynamical evolution of the cluster, and could facilitate stellar collisions and perhaps even stellar mergers (Bonnell & Bate 2002.)
4. Formation of a Bound Cluster Must be Efficient, and Is
To form a bound star cluster, at least 50% of the original gas mass must end up in stars. Star formation efficiencies in the Galaxy are 1-2% on the pc sizescales of GMCs (Lada, Margulis, & Dearborn 1984), although efficiencies on sizescales comparable to the cluster size are higher. This is consistent with the lack of young bound clusters in the Galaxy.
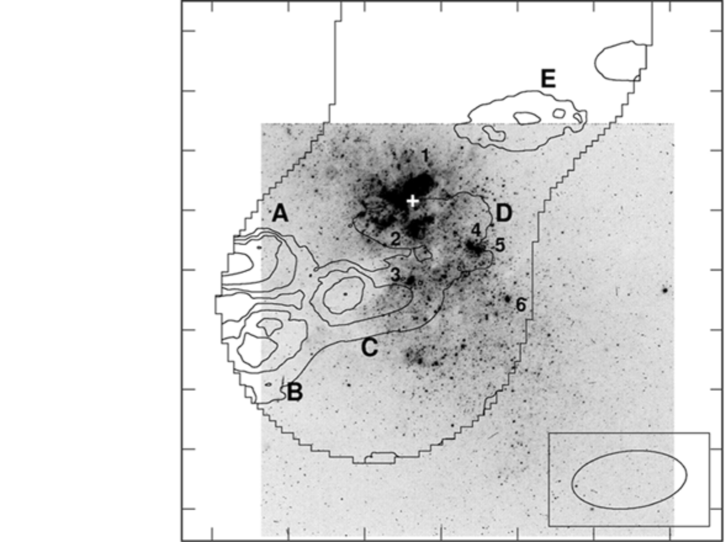
In NGC 5253 we observe a stream of molecular gas falling into the galaxy (Figure 3: Meier, Turner, & Beck 2002). There is a similar infalling stream in Henize 2-10 (Kobulnicky et al. 1995). Most of the molecular gas is separated spatially and kinematically from the supernebula and from the optical star clusters near it; the infalling gas cannot be associated causally with the current forming star cluster. There is a small amount of gas, within the galaxy proper (Cloud D). This can be compared to an estimated in stars. Star formation has nominally been 60–75% efficient in NGC 5253. There are sizeable uncertainties in the gas mass, which is based on two different CO lines, due to the unknown metallicity dependence of the Galactic conversion factor, and to the stellar IMF (the lower efficiency corresponds to a lower mass cutoff of 1 ). However, the gas mass estimated from dust emission is in agreement with the CO mass, to within 30% (Meier et al. 2003, in prep.), so we expect the high efficiency is real.
5. Summary
High resolution radio and infrared observations in nearby galaxies have found luminous and compact nebulae excited by obscured super star clusters. The IR emission of these nebulae can be a significant, or even dominant, part of the total galactic flux. In NGC 5253, there are so many young stars in such a small volume that the gravitational attraction appears to be slowing or stopping the rapid expansion of the nebula. The star formation efficiency also appears to be quite high in this galaxy, %, which is consistent with the formation of bound clusters. Star formation in SSC-starburst galaxies does not much resemble that closer to home.
Acknowledgments.
The authors would like to acknowledge the contributions of P.T. P. Ho, D. S. Meier, J. H. Lacy, V. Gorjian, L. Crosthwaite, D. S. Meier, J. Larkin, & I. McLean to this work. This research is supported by NSF Grant 0307950.
References
Beck, S. C., Turner, J. L., Ho, P. T. P., Kelly, D., & Lacy, J. H. 1996, ApJ, 457, 610
Bonnell, I. A., & Bate, M. R. 2002, MNRAS, 336, 659
Caldwell, N., & Phillips, M. M. 1989, ApJ, 338, 789
Gruendl, R. A., Chu, Y.-H., Dunne, B. C., & Points, S. D. 2000, AJ, 120, 2670
Hughes, J. P., Rakowski, C. E., Burrows, D. N., & Slane, P. O. 2000, ApJ, 528, L109
Kobulnicky, H. A., Dickey, J. M., Sargent, A. I., Hogg, D. E., & Conti, P. S. 2000, AJ, 120, 1273
Lada, C. J., Margulis, M., & Dearborn, D. 1984, ApJ, 285, 141
Meier, D. S., Turner, J. L., & Beck, S. C. 2002, AJ, 124, 877
Morse, J., Davidson, K., Bally, J., Ebbets, D., Balick, B., & Frank, A. 1998, AJ, 116, 2443
O’Connell, R. W., Gallagher, J. S. III, Hunter, D. A., & Colley, W. N. 1995, ApJ, 446, L1
Pina, R. K., Jones, B., Puetter, R. C., & Stein, W. A. 1992, ApJ, 401, L75
Shepherd, D. S., Kurtz, S. E. 1999, ApJ, 523, 690
Telesco, C. M., & Gezari, D. Y. 1992, ApJ, 395, 461
Thompson, R. I. 1987, ApJ, 321, 153
Turner, J. L., Beck, S. C., Crosthwaite, L. P., Larkin, J. E., McLean, I. S., & Meier, D.S. 2003, Nature, 423, 621
Turner, J. L., Beck, S. C., & Ho, P. T. P. 2000, ApJ, 532, L109
Turner, J. L., Ho, P. T. P., & Beck, S. C. 1987, ApJ, 313, 644
Turner, J. L., Ho, P. T. P., & Beck, S. C. 1998, AJ, 116, 1212
Vigroux, L., et al. 1996, A&A, 315, L93
Walsh, J. R. & Roy, J.-R. 1987, MNRAS, 239, 297
Whitmore, B. C., & Schweizer, F. 1995, AJ, 109, 960
Whitmore, B. C., Zhang, Q., Leitherer, C., Fall, S. M., Schweizer, F., & Miller, B. W. 1999, AJ, 118, 1551
Yorke, H. W., & Sonnhalter, C. 2002, ApJ, 569, 846