Decomposition of the Visible and Dark Matter Mass Profiles in the Einstein Ring 00472808
Abstract
Using our semi-linear inversion method, we measure the mass profile of the lens galaxy in the Einstein ring system 00472808. The lens is modelled as a baryonic component following the observed light, embedded in a dark matter generalised NFW halo. The semi-linear method makes full use of the information content in the ring image. We determine an unevolved B-band mass to light ratio for the baryons of (95% CL), accounting for 65% of the total projected mass within the radius of traced by the ring. This result is obtained without need of dynamical measurements. The inner logarithmic slope of the halo is found to be (95% CL). We find that the halo is fairly well aligned with the light but has only half the ellipticity.
Astrophysics Group, Imperial College London, Blackett Labs, Prince Consort Road, London, SW7 2BW, U.K.
1. Introduction
Gravitational lensing provides a simple and well understood tool for the determination of galaxy mass profiles. It has the advantage that the deflection angle of a photon passing a massive object is independent of the dynamical state of the deflecting mass. Dynamical methods for measuring galaxy mass profiles rely on a number of assumptions that can be difficult to test, such as dynamical equilibrium, circular orbits of gaseous disks, and, frequently, spherical symmetry of the mass distribution.
In contrast to weak lensing, where a statistical detection of galaxy-galaxy lensing can place limits on mass profiles (eg. Hoekstra, Yee, & Gladders 2003), strong lensing involves the analysis of individual systems and allows smaller scales to be probed. In strong lens systems, multiple images of a background source are observed. Once the redshift of the source and lens galaxy are known, mass models for the lens can be fit by comparing predicted image positions with those measured. Strong lens systems where the source has extended structure give rise to multiple arc-shaped images. These arcs trace out the Einstein ring which, as Kochanek, Keeton, & McLeod (2001) show, allows stronger constraints to be placed on the lens mass profile. Unlike strong lens systems where the source is point-like, the analysis of Einstein rings requires modelling of the source surface brightness distribution. In this way, the properties of both the source and the lens are minimised to give the best fit to the observed ring.
In the analysis of Einstein rings, the way in which the source is modelled has a significant effect. Assuming a simple analytical surface brightness profile for the source can bias the lens model solution. Real sources typically have complicated structure and an over-simplified source forces the fitted lens model to compensate. A non-parametric form, such as one in which the source surface brightness is pixelised, almost entirely removes this problem but creates a new one: The surface brightness in each source pixel must be adjusted in addition to the lens model parameters to find the minimum thus hugely slowing the procedure.
Wallington, Kochanek, & Narayan (1996) describe a method based on maximum entropy that uses a pixelised source surface brightness distribution. This has been applied by Wayth et al. (2003) to the Einstein ring 00472808. At the heart of the method are two nested minimisation cycles. For a given lens model stipulated by the outer cycle, the surface brightnesses in the source pixels are adjusted in the inner cycle until an image is obtained which gives the best fit to the observed ring image. The inner cycle is a slow non-linear search for the minimum requiring many iteration to reach convergence.
In a previous paper (Warren & Dye 2003), we developed a new technique called the semi-linear method. The semi-linear method uses a pixelised source plane but replaces the inner cycle of the maximum entropy method with a single-step linear inversion. This has the advantage that it is very fast and, more importantly, that the correct source minimum is guaranteed for a given lens model. The possibility of minimising to an incorrect source, thereby biasing the minimised lens model, is thus completely removed.
In the work presented here, we apply the semi-linear method to WFPC2 observations of the Einstein ring 00472808. We model the lens as a baryonic component embedded in a dark halo and show how the contribution from each component can be determined to allow measurement of the baryonic M/L.
2. The semi-linear reconstruction method
We refer the reader to Warren & Dye (2003) for a complete description of the semi-linear method. Here, we give an outline.
The inversion requires that both the source plane and the image plane are pixelised. This pixelisation can be of a completely general fashion in terms of the distribution of pixel sizes and locations. Labelling the surface brightness in reconstructed source pixel as , the flux in observed image pixel as and the error on this flux as , then for a given lens model, the vector of source surface brightnesses which best fits the observed ring is given by
| (1) |
where
| (2) |
The quantity is the contribution to the flux in image pixel from source pixel according to the given lens model and allowing for smearing by the observed image PSF. The solution is regularised by the matrix R, the form of which is selected by the user. This is chosen to reduce noise in the reconstructed source by penalising spikes with the regularisation weight (see Warren & Dye 2003).
Equation (1) gives the best fit source for a fixed lens model. This is the linear part of the semi-linear method. The non-linear part comes from the need to adjust the lens parameters in an outer iterative cycle until the best global fit is obtained. At each step in the outer cycle, a new set of quantities must be calculated.
3. Data
Full details of the HST observations and data reduction steps are given in Wayth et al. (2003).
The data consist of drizzled images of the Einstein ring 00472808 observed with the WFPC2 instrument. The source in this system is a star-forming galaxy at redshift . The galaxy has strong Ly emission (Warren et al. 1996), hence observations were carried out in the F555W filter to maximise the ring:lens flux ratio. The fully reduced, drizzled image ( dither positions per full WFPC2 pixel) is shown in the left of Figure 1.
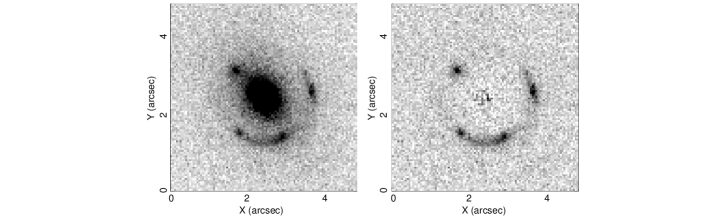
Since the semi-linear method requires an image of the ring only, the lens galaxy had to be first removed. The best fitting surface brightness distribution for the lens galaxy was found to be a Sersic profile (Sersic 1968) with a central point source (Wayth et al. 2003). The plot on the right of Figure 1 shows the resulting Einstein ring after the lensing galaxy has been subtracted. The residue at the centre of the subtracted image is insignificant Poisson noise.
4. Modelling procedure
In our dual component lens model, we wish to constrain the inner slope of the density profile of the dark halo and the baryonic mass-to-light ratio.
The baryonic component of the lens model is assumed to follow the light of the lens galaxy, fixed by the fitted Sersic + point source profile. The lens deflection angle due to the baryons is therefore computed from this light profile scaled by the B-band baryonic mass to light ratio (in units of ). The surface density of the Sersic profile in units of , is
| (3) |
and the mass of the central point source,
| (4) |
expressed here in units of . is the only free parameter describing the baryonic contribution to the total lens mass. The half light luminosity of the Sersic profile is and the ellipse co-ordinate has a measured axis ratio . The orientation of the major axis to the vertical in a counter-clockwise direction is .
The dark matter halo is modelled with a generalised NFW model (Navarro, Frenk, & White 1996) with the central density profile slope left as a free parameter. This has a density profile given by
| (5) |
Here, is the halo normalisation and is a scale radius. The volume mass density must be projected to a surface mass density by integrating along the line of sight. We generalise this surface mass density to an elliptical distribution using the ellipse co-ordinate . Following the prescription given by Keeton (2002), the elliptical surface density is used to calculate the deflection angle.
The parameters describing the lens model are then the baryonic M/L , the position of the halo centre with respect to the light centre , the halo normalisation , the central slope , the halo ellipticity and the orientation of the semi-major axis to the vertical in a counter-clockwise direction, . We hold the scale radius fixed at kpc to match that expected from simulations by Bullock et al. (2001) for a galaxy of equal mass and redshift of the lens galaxy in 00472808. The fitted lens model is insensitive to the choice of .
Confidence contours are obtained on the plane by minimising over the remaining 5 parameters at regular grid points in the plane. We use a modified version of Powell’s method (Press et al. 2001) for the minimisation. The ring is masked with an annulus to remove insignificant sky pixels (see Figure 2).
5. Results
Figure 2 shows the results of the minimisation. The confidence regions on and are shown in the plot on the left. In order not to bias the lens solution, this minimisation was not regularised (ie. was set to 0). We used a source plane size of with an adaptive pixelisation scheme dependent on the lens magnification (see Dye & Warren, 2003). To confidence, we measure an inner slope of and a baryonic M/L of . The dashed lines show the corresponding confidence levels obtained by Koopmans & Treu (2003) in analysing a combination of Keck spectroscopy and the same HST observations as those here. Their constraints were the observed velocity dispersion profile and a lensing estimate of the total mass enclosed by the Einstein ring. Clearly, by using the full information content of the ring image, the semi-linear method gives significantly better constraints. Most notably, we have been able to constrain the baryonic M/L without the need for dynamical measurements. The lens galaxy is offset from the local fundamental plane by a factor 0.37dex (Koopmans and Treu 2003). Correcting by this factor our derived M/L is in remarkable agreement with the local average value for ellipticals of (Gerhard et al. 2001).
The other minimised lens model parameters are , and , which give . The centre of the halo is well aligned with the centre of the light whereas the orientation is marginally inconsistent at the level. The halo is rounder than the light distribution with an ellipticity of approximately half the value of for the Sersic profile. Finally, the halo is found to contribute 35% of the total projected mass within a circular region of radius of traced by the ring.
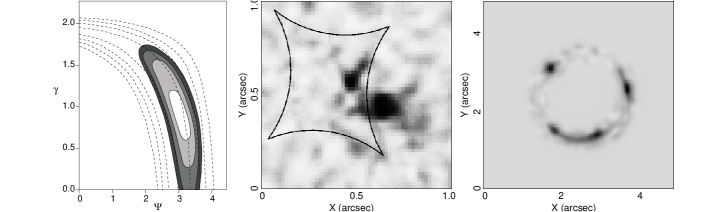
The middle plot of Figure 2 shows the reconstructed source. To best resolve the source morphology we performed a regularised inversion, fixing the lens model parameters to those obtained above in the unregularised solution. was set to the value Tr(Tr(R) to weight both matrices in equation (1) equally. Although this gives a ring image (Figure 2, right) with a worse than the unregularised case, the reconstructed source allows identification of two distinct objects. This agrees with the findings of Wayth et al. (2003) and illustrates the importance of using a non-parametric source: Using a single analytic source would have biased the minimised lens model in this case.
6. Summary & Discussion
We have applied our semi-linear method to HST observations of the Einstein ring system 00472808 to determine the lens galaxy mass profile. Modelling the lens as a baryonic Sersic profile + point source nested in a dark matter generalised NFW halo, we find a M/L of and an inner slope (95% CL). This M/L was obtained without any dynamical measurements. The reconstructed source surface brightness distribution shows two distinct source objects, highlighting the need for non-parametric sources to obtain unbiased lens mass profiles.
One of the main predictions of the Cold Dark Matter (CDM) model is that halo mass profiles are cuspy. Recent CDM simulations show that the inner slope should lie somewhere in the range (Navarro, Frenk, & White 1996; Moore et al. 1999). Our measurement of for 00472808 is not inconsistent with these. Nevertheless there are two important factors which must be considered. The first is that the simulations are only just starting to reliably probe scales of few kpc. The most recent simulations seem to indicate that continues to decrease at smaller radii with no sign of reaching a convergent value (Power et al. 2003; see also Navarro et al. in these proceedings). For complete reassurance in comparing these predictions with observational constraints, higher resolution simulations are needed. The second complication is that the majority of simulations model only pure dark matter distributions. The effect of a baryonic potential well alters the shape of the dark matter halo in a non-trivial way. Clearly, these shortcomings must be addressed before CDM can be tested with confidence.
References
Bullock, J.S., Kollat, T.S., Sigad, Y., Somerville, R.S., Kravtsov, A.V., Klypin, A.A., Primack, J.R., Deckel, A., 2001, MNRAS, 321, 598
Dye, S. & Warren S.J., 2003, ApJ, submitted
Gerhard, O., Kronawitter, A., Saglia, R.P., & Bender, R., 2001, AJ, 121, 1936
Hoekstra, H., Yee, H.K.C., Gladders, M.D., 2003, astro-ph/0306515
Keeton, C.R., 2002, astro-ph/0102341
Kochanek, C.S., Keeton, C.R., & McLeod, B.A., 2001, ApJ, 547, 50
Koopmans, L.V.E. & Treu, T., 2003, ApJ, 583, 606
Moore, B., Quinn, T., Governato, F., Stadel, J., Lake, G, 1999, MNRAS, 310, 1147
Navarro, J.F., Frenk, C.S., & White S.D.M., 1996, ApJ, 462, 563
Power, C., Navarro, J.F., Jenkins, A., Frenk, C.S., White, S.D.M., Springel, V., Stadel, J., Quinn, T., 2003, MNRAS, 338, 14
Press, W.H., Teukolsky, S.A., Vetterling, W.T., Flannery, B.P., 2001, ’Numerical Recipes in Fortran 77, 2nd Edition’, Cambridge University Press
Sersic, J.L., 1968, Cordoba, Argentina: Observatorio Astronomico (1968)
Wallington, S., Kochanek, C.S., & Narayan, R., 1996, ApJ, 465, 64
Warren, S.J., Hewett, P.C., Lewis, G.F., Møller, P., Iovino, A., Shaver, P.A., 1996, MNRAS, 278, 139
Warren, S.J. & Dye, S., 2003, ApJ, 590, 673
Wayth, R.B., Warren, S.J., Lewis, G.F., Hewett, P.C., 2003, MNRAS, in prep