Numerical simulations of expanding supershells in dwarf
irregular galaxies. I. Application to Holmberg I
Numerical hydrodynamical modelling of supernova-driven shell formation is performed with a purpose to reproduce a giant HI ring (diameter 1.7 kpc) in the dwarf irregular galaxy Holmberg I (Ho I). We find that the contrast in HI surface density between the central HI depression and the ring is sensitive to the shape of the gravitational potential. This circumstance can be used to constrain the total mass (including the dark matter halo) of nearly face-on dwarf irregulars. We consider two models of Ho I, which differ by an assumed mass of the dark matter halo . The contrast in HI surface density between the central HI depression and the ring, as well as the lack of gas expansion in the central hole, are better reproduced by the model with a massive halo of than by that with a small halo of , implying that Ho I is halo-dominated. Assuming the halo mass of , we determine the mechanical energy required to form the observed ring equal to ergs, equivalent Type II supernovae. The inclination of Ho I is constrained to by comparing the modelled HI spectrum and channel maps with those observed.
Key Words.:
dwarf: individual: Holmberg I=DDO 63 – ISM: bubbles1 Introduction
The interstellar medium of gas-rich dwarf irregular galaxies (dIrr) is usually dominated by features described as shells, holes, or rings. The number of such structures varies from a few (IC 10, Wilcots & Miller Wilcots (1998)) to several tens (Holmberg II, Puche et al. Puche (1992)) and their sizes are within several hundred parsecs. However, there are a few dIrr’s the HI morphology of which is totally dominated by a single ring structure of the size comparable to their optical extent (Ott Ott2 (1999)). Among them is Holmberg I, a member of the M81 group of galaxies (distance 3.6 Mpc). Ott et al. (Ott (2001)) have found that most of its HI content (75%) is localized within a giant ring of 1.7 kpc diameter. They suggested that strong stellar winds and supernova (SN) explosions might be responsible for the peculiar HI morphology in Ho I.
In the present paper we test this hypothesis via detailed numerical hydrodynamical modelling. Two model galaxies are considered: a fast rotating galaxy with a massive halo and a slowly rotating one with a small halo. We attempt to determine the amount of SNe required to reproduce a ring-like morphology of the distribution of the atomic hydrogen in Ho I. We show that modelling of the HI spectrum, HI channel maps, and the radial HI profile may constrain the inclination angle and consequently the dark matter content of Ho I.
2 Origin of the peculiar HI morphology in Ho I
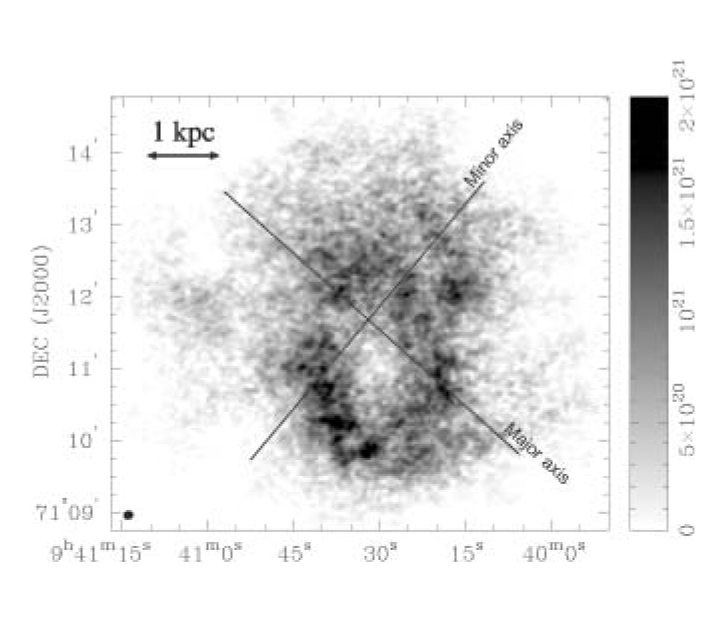
Fig. 1 shows the integrated HI emission of Ho I with the kinematical major and minor axes overlaid (Ott et al. Ott (2001)). Most of the HI content is obviously concentrated in a ring, the morphological center of which is offset by 0.7 kpc from the dynamical center of the galaxy. The contrast in column density between the central HI depression and the ring is about a factor of 15. In principle, kpc-sized ring structures in the gas component of disk galaxies can be caused by a number of phenomena. Among them are resonant rings (Buta Buta (1986)), collisionally induced rings (Lynds & Toomre Lynds (1976)), the infall of massive gas clouds (Tenorio-Tagle et al. TT (1987)), gamma ray bursts (Efremov et al. Efremov (1998)), or multiple supernova explosions. In case of Ho I, the first two scenarios can be ruled out because of the absence of spiral structure, the apparent absence of lower-mass companions along the projected minor axis of Ho I, and the lack of expansion motions in the ring. The latter three scenarios are plausible. However, the HI ring in Ho I shows evidence for a supernova-driven origin, since the B-band image of Ho I indicates that there is a pronounced concentration of young blue stars within the ring (Ott et al. Ott (2001)), and the most massive stars of this population might have been a plausible source of energy input over the past 50 Myr in our model. In the following sections the supernova-driven mechanism is numerically investigated. Other possibilities of HI ring formation in Ho I will be discussed in a subsequent paper.
3 Numerical model
3.1 Initial conditions
We consider an axisymmetric model galaxy consisting of a rotating gas disk, a rigid stellar disk, and a rigid, spherically symmetric halo. Extensive radio and optical observations of Ho I by Ott et al. (Ott (2001)) provided important observational constraints on the total mass and density distribution of different components of our model galaxy. The HI mass of Ho I is , with the total gas mass ( amounting to . Using a B-band luminosity and a mass-to-light ratio , Ott et al. (2001) derived an estimate of the luminous stellar mass, , in Ho I. For computational purposes, the density profile of the stellar component is chosen as:
| (1) |
where is the stellar density in the center of the galaxy, and and are the vertical scale height and radial scale length of the stellar component, respectively. The radial scale length can be estimated from the -band radial surface brightness profile of Ho I (Ott et al. Ott (2001)). If the mass follows the light at the longer wavelengths, it results in kpc. We have adopted a value of 300 pc for the vertical scale height , which is typical for dwarf irregulars. With and being fixed, the stellar density at is varied so as to obtain the measured luminous stellar mass of within the computational domain. This results in pc-3.
The dark matter content of Ho I is uncertain. We assume that the density profile of the halo can be approximated by a modified isothermal sphere (Binney & Tremaine Binney (1987))
| (2) |
where the central density and the characteristic scale length were given by Mac Low & Ferrara (MF (1999)) and Silich & Tenorio-Tagle (Silich (2001)):
| (3) |
| (4) |
Here, is the Hubble constant in units of 100 km s-1 Mpc-1 and is the total halo mass. We adopt throughout the paper.
We consider two different initial models that attempt to represent the
appearance of Ho I before the ring has been formed.
a) Fast rotating galaxy with a massive halo (hereafter model 1). In
model 1 the gravity force of a massive halo of
and a stellar disk of is balanced by
a fast rotating gas disk. We note that the adopted halo mass of
is in fact the total halo mass of Ho I.
Particularly, the halo mass confined within the
HI diameter of Ho I (5.8 kpc) is , which
agrees with the corresponding upper limit of
derived by Ott et al. (Ott (2001)).
We vary the rotation curve until the initial gas
surface density distribution resembles that of Ho I at radii that are
unperturbed by shell expansion, kpc. We also make sure that the total
HI mass within the computational area is equal to the measured one (). For the adopted halo mass, the central
density and characteristic scale length become
pc-3 and kpc,
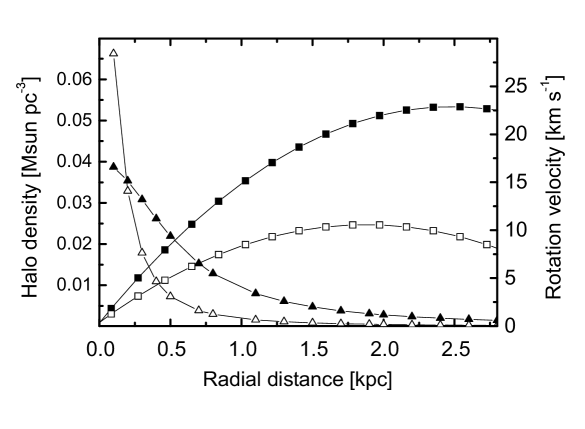
respectively. The adopted halo density profile and the gas rotation curve
are shown in Fig. 2 by the filled triangles and filled squares,
respectively.
b) Slowly rotating galaxy with a small halo (hereafter model 2). In
model 2 the gravity force of a small halo of and a stellar disk of are balanced by a slowly rotating gas disk. For the
adopted halo mass, the central density and characteristic scale length
become pc-3 and kpc,
respectively. Thus, in a slowly rotating galaxy the halo density has a
rather cuspy profile as shown by the open triangles in Fig. 2.
3.2 Equilibrium solution
Once the stellar and halo density profiles are fixed, we can proceed to obtain the initial gas density distribution by solving the steady-state momentum equation,
| (5) |
where is the gas pressure, is the gas density, and are the gravitational potentials of the halo and stellar disk, respectively. We assume the gas distribution to be initially symmetric with respect to the rotation axis and equatorial plane, which naturally implies the use of cylindrical coordinates for solving Eq. (5). If the gas is initially isothermal, then Eq. (5) can be transformed to the following set of equations:
| (6) | |||||
| (7) |
Here, is the gas velocity dispersion. Ott et al. (2001) found an average value of km s-1 for Ho I. The halo gravity force can be expressed as:
| (8) | |||||
where is the radial distance from the galactic center, is the galactocentric radius, is the height above the midplane, and is a unit vector. The r- and z-components of the halo gravity force , , can be found by projecting on the corresponding coordinate planes. The stellar gravitational potential is found by numerically solving the Poisson equation:
| (9) |
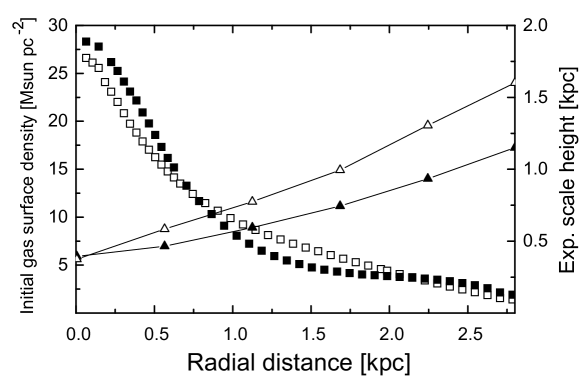
Eqs. (6) and (7) are finite-differenced on a mesh of grid points in radial and vertical directions, respectively, and solved using the lower-upper decomposition method to obtain the equilibrium gas density distribution in a computational domain of 3.5 kpc3.0 kpc. The equilibrium radial surface density profiles and the exponential scale heights of the gas for both models are shown in Fig. 3. In both models the gas has an exponential radial profile, which is in agreement with observations of the HI distribution in many dIrr’s (Taylor et al. Taylor (1994)). There is also a pronounced difference between the models with massive and small halos, the latter has a thicker gas disk. Indeed, in model 2 the cuspy halo mainly pulls the matter toward the nucleus, while in model 1 the halo density has a somewhat shallower distribution, thus contributing significantly to the vertical gravity pull at larger radii and subsequently assisting to maintain a thinner equilibrium gas configuration.
3.3 Computational techniques
We use the ZEUS-2D numerical hydrodynamical code incorporating a rotating gas disk initially in equilibrium in the fixed stellar and halo potentials. A usual set of hydrodynamical equations in cylindrical coordinates is solved using the method of finite-differences with a time-explicit, operator split solution procedure described in detail in Stone & Norman (Stone (1992)). We have implemented the cooling curve of Spaans & Norman (Spaans (1997)) and Wada & Norman (2001) for a metallicity of one tenth of solar, which is close to the value of derived by Miller & Hodge (Miller (1996)) for Ho I. The use of cooling function simplifies the implementation of cooling by collecting the effects of various coolants. The cooling processes taken into account are: (1) recombination of H, He, C, O, N, Si, and Fe; (2) collisional excitation of HI, CI-IV, and OI-IV; (3) hydrogen and helium bremsstrahlung; (4) vibrational and rotational excitation of ; (5) atomic and molecular cooling due to fine-structure emission of C, C+, and O and rotational line emission of CO and . We note that using an equilibrium cooling function, oversimplified particularly in the intermediate-temperature range of K, is a common practice in modelling the SN-driven shell dynamics (see e.g. Mac Low & Ferrara MF (1999), Murakami & Babul MB (1999)). Such an oversimplification is justified by the fact that most amount of the thermal energy of the shell is lost in the high-temperature ( K) layers, while the energy lost at the low-temperature end contributes less to the total energy balance. Variations of the cooling rate connected with the fractional ionization are important mostly to determine the cooling time of the low- and intermediate-temperature layers. However, because at these temperatures and the corresponding densities the cooling time is very short in comparison to the dynamical time, the overall dynamics is insensitive to details of the cooling rate at K.
We use an empirical heating function tuned to balance the cooling in the background atmosphere so that it maintains the gas in hydrostatic and thermal equilibrium and may be thought of as a crude model for the stellar energy input. The disadvantage of this method is that the time-independent heating becomes strongly unbalanced in the hot regions filled with supernova ejecta. This may result in a spurious energy input at later phases of the shell expansion when it occupies a large computational volume. To minimize this numerical effect, we have introduced a tracer field function defined by Yabe & Xiao (Yabe (1993)). The tracer field is advected with the same algorithm as the gas density in order to follow the hot gas ejected by the supernovae. Heating is prohibited in the regions where the tracer field is present, thus largely reducing the effects of spurious heating of the bubble’s interior by the time-independent heating function. This is physically justified since most of the heating in the warm interstellar medium comes from the photoelectric heating of polycyclic aromatic hydrocarbon molecules (PAHs) and small grains, which will be either evaporated or highly ionized in the hot ( K) bubble filled with supernova ejecta. Cooling and heating are treated numerically using Newton-Raphson iterations, supplemented by a bisection algorithm for occasional zones where the Newton-Raphson method does not converge. In order to monitor accuracy, the total change in the internal energy density in one time step is kept below . If this condition is not met, the time step is reduced and a solution is again sought.
The energy of supernova explosions is released in the form of thermal energy in the central region with a radius of four zones. We use a constant wind approximation described in detail in Mac Low & Ferrara (MF (1999)). There is a certain degree of freedom in how to distribute ergs of mechanical energy released by a single supernova. We decided to convert it totally into a thermal energy, since in the present simulations we deal with large stellar clusters with hundreds of supernovae. With such an amount of SN explosions, the surrounding ISM will be quickly heated and diluted, making radiative cooling inefficient. We admit that at the initial stages of the stellar cluster evolution part of the energy of SNe may be radiated away due to the radiative cooling. Hence, our numerical simulations provide a lower bound on the number of SN explosions needed to create the observed ring. We choose the energy input phase to last for 30 Myr, which roughly corresponds to a difference in the lifetimes of the most and least massive stars capable of producing SNe in a cluster of simultaneously born stars.
4 Multiple Supernova Explosions
4.1 Fast rotating galaxy with a massive halo (model 1).
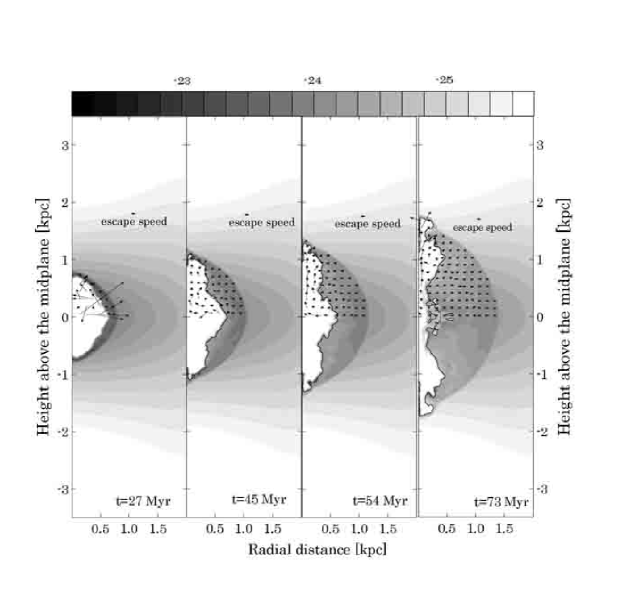
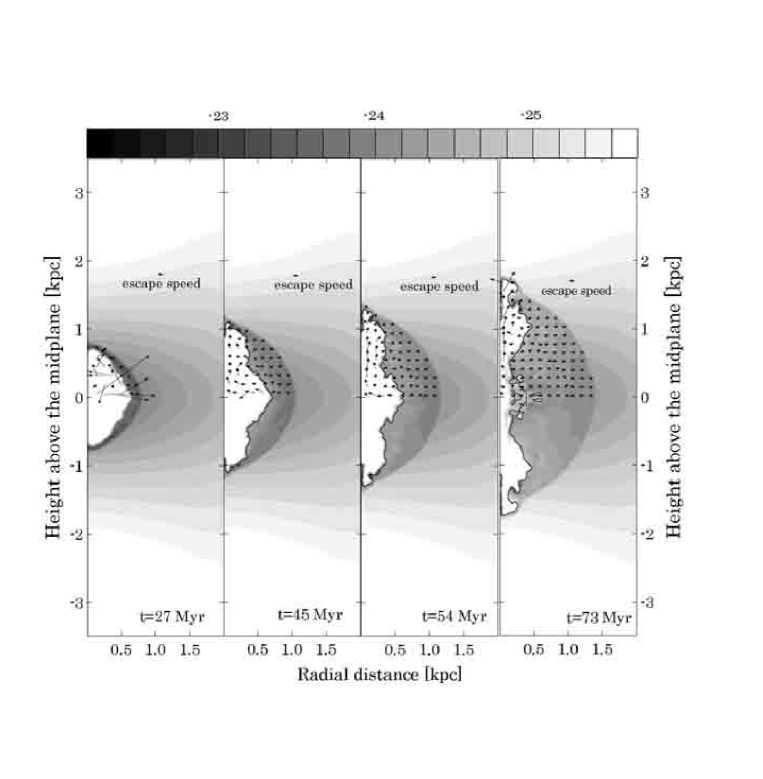
We vary the energy input of the starburst in terms of SN explosions in order to reproduce a ring-like gas morphology of Ho I. We start by showing in Fig. 4 the temporal evolution of the distribution of the gas volume density for an energy input equivalent to 300 successive SN explosions. SNe generate a supersonically expanding wind that compresses the surrounding gas, thus creating a bubble filled with hot ejected gas. At the end of the energy input phase ( Myr) the shell loses its spherical form transforming into a prolate spheroid. As a result, tangential motion vortices develop in the hot ejected gas, which in turn trigger Kelvin-Helmholtz instabilities in the compressed expanding gas layer of the shell. This results in a characteristic ripple-like form of the shell. At approximately 40 Myr the shell breaks out of the disk, Rayleigh-Taylor instability ensues from the shell acceleration, creating a characteristic bubble-and-spike morphology, first mentioned in numerical experiments by Mac Low et al. (ML (1989)). Soon after the shell stalls and starts to collapse in radial direction, simultaneously pushing the hot ejecta to a higher altitude. In fact, part of the galaxy ISM will eventually be lost by Ho I, because its velocity exceeds the local escape speed. We compute the fraction of the total gas mass of Ho I lost by such an outflow at the time when the ring has collapsed ( Myr) by summing up the mass of the gas expanding with velocities exceeding those of the local escape speed. The fraction is low, usually within . At Myr the shell appears as a ring if viewed face-on, and its diameter matches best that of HI ring in Ho I. At later times of the evolution ( Myr), the central depression is totally filled and Ho I appears as a dwarf irregular, with a declining average gas surface density profile. Simulations indicate that for a smaller starburst capable of producing only 100 - 150 SNe, the shell never breaks out of the disk and hardly expands to 1.7 kpc diameter, indicating that 100-150 SNe are not sufficient to account for the size of HI ring in Ho I. For a larger starburst of 450-600 SN, the shell breaks out after approximately 35 Myr. However, the radial expansion of the shell proceeds to a larger radius than that of Ho I’s ring, mainly because of the higher initial momentum acquired by the shell.
The total luminosity of Ho I is ergs s-1 (Miller & Hodge Miller (1996)), which implies a star formation rate of only yr-1. We searched for dense gas clumps in the expanding shell that could be Jeans unstable. We assume that the gas in a restricted computational domain becomes Jeans unstable if , where is the free-fall time, is the size of a computational cell, and is the local speed of sound. We also combined the neighbouring cells to search for a larger scale () Jeans unstable gas clumps. Our simulations show that on the scales of a giant molecular cloud ( pc) the shell is stable against self-gravity. We note however that our simulations were restricted in resolution to 10 pc, and thus we did not follow possible gravitational instability on smaller scales ( pc) corresponding to the subunits and the cores of molecular clouds that can be in principle Jeans unstable, while the clouds as a whole are stable (Scoville & Sanders SS (1987)).
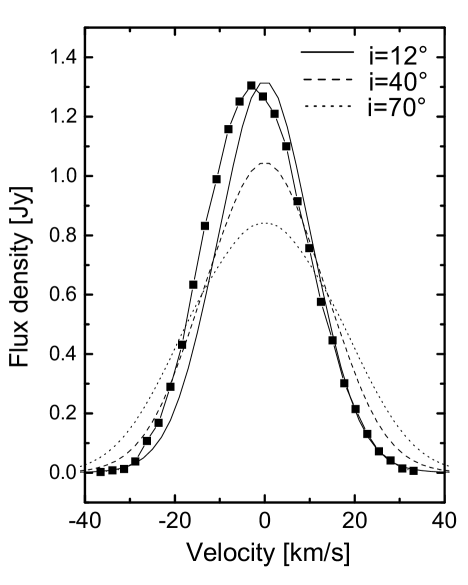
Furthermore, we attempt to reproduce the HI spectrum of Ho I, shown in Fig. 5 by the filled squares (Ott et al. Ott (2001)) and scaled to Ho I’s systemic velocity of 141.5 km s-1. Its shape is remarkably well described by a Gaussian with a FWHM of km s-1. In order to model the HI spectrum, we assume that the gas is thermalized in each computational cell, with the velocity dispersion controlled by the local gas temperature. We also assume that the HI distribution in Ho I is optically thin, which is justified considering its rather low HI surface density, pc-2. We use the following conversion formula that links the HI mass per velocity channel with the HI flux density (Binney & Merrifield BM (1998)):
| (10) |
where is the distance to Ho I.
We have constructed the model HI spectrum of Ho I for different inclination angles. We can surprisingly well reproduce the measured HI spectrum for a small inclination angle, i = 12°, represented by the solid line in Fig. 5; the spectrum for smaller inclinations practically coincide with the one. The model HI spectrum is taken at Myr when the face-on (or zero-inclination) gas distribution best reproduces that of Ho I. A small difference between the peak positions in the measured and model profiles most probably indicates that there is a small offset between the morphological center of the ring and the dynamical center of Ho I, a feature supported by the measurements of its HI velocity field (Ott et al. Ott (2001)). Another possibility is that the starburst responsible for creating the HI ring is not exactly located in the midplane, but instead closer to the near side of the galaxy.
As we employ progressively higher inclination angles, the agreement between the model and the measured HI spectrum deteriorates. In Fig. 6 we plot the relative discrepancy between the model and measured HI spectrum averaged over 70 velocity channels, starting at km s-1 and ending at km s-1. The flux-weighted relative discrepancy is also calculated to de-emphasize the low-mass wings of HI spectrum. The best agreement is obviously found for low inclination angles, i 20°. The near-Gaussian shape of the HI spectrum indicates that the thermal+turbulent motions dominate the line-of-sight rotation+expansion motions in Ho I.
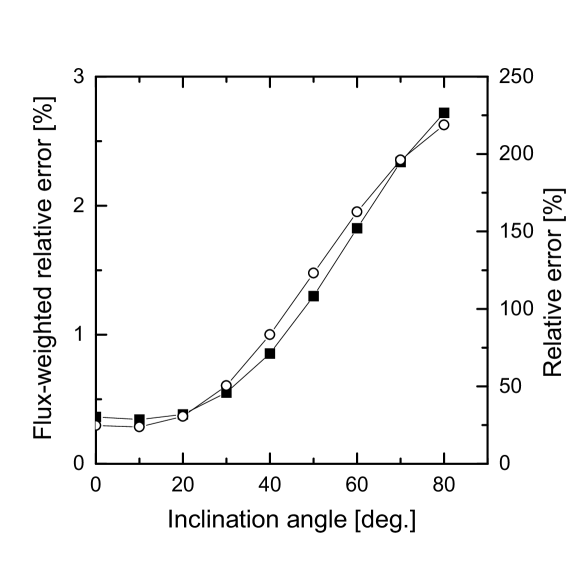
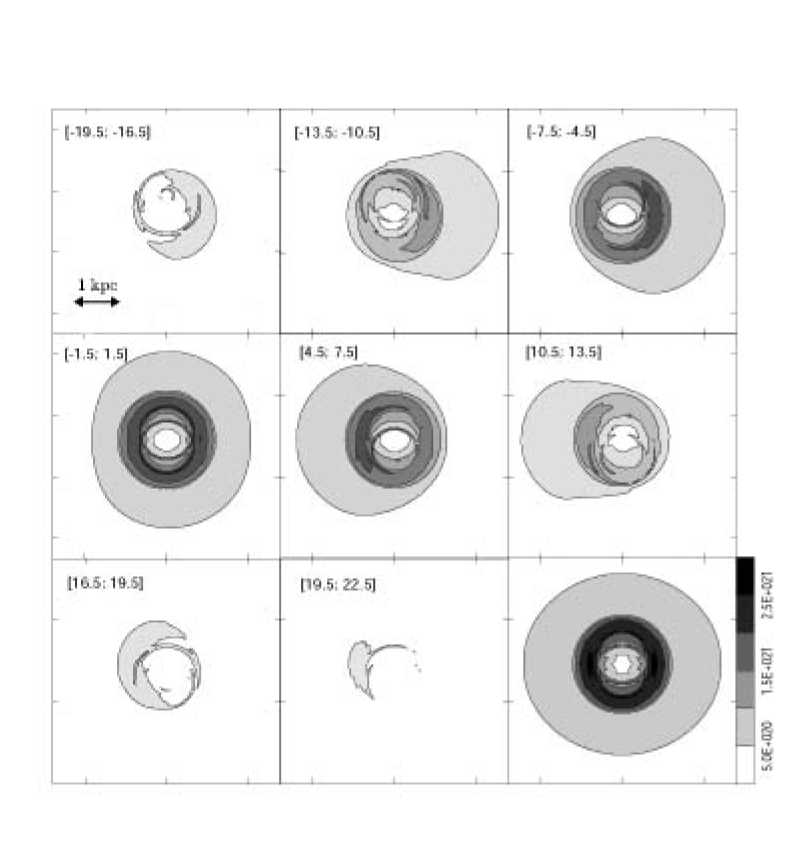
As is seen from Fig. 6, modelling of the HI spectrum provides an upper limit to the inclination of Ho I. A lower limit can be obtained by constructing the model HI channel maps and comparing them with the observed ones published by Ott et al. (Ott (2001)). The latter show an interesting tendency: the complete ring appears only in a few channel maps near the systemic velocity, while the other channel maps show only part of it. Specifically, the part of the ring that is faint on the approaching side seems to be luminous on the receding side of Ho I and vice versa. We smoothed the [128-131] km s-1 channel map of Ho I (see Fig. 3 of Ott et al. Ott (2001)) to a resolution of 206 212 and found that the relative amplitude of the azimuthal variations in the HI intensity along the ring is a factor of 2.5. Furthermore, we constructed model channel maps at t = 54 Myr for inclinations of 0° - 20°. We find that the observed variations in HI intensity along the ring can be obtained only if the inclination is constrained to the range 15° - 20°. As an example, we plot the model channel maps constructed at t = 54 Myr for an inclination of 15° in Fig. 7. It is readily seen that the area near the central position shows virtually no emission throughout all channels, a feature also reported by Ott et al. (Ott (2001)). The asymmetry of the model channel maps indicates that the gas is participating in both, rotation and expansion motions, the latter dominating at higher altitudes (see Fig. 4). The relative amplitude of azimuthal variations in the maximum HI intensity along the ring in the [-13.5; -10.5] km s-1 channel map, which is equivalent to the observed [128-131] km s-1 channel map of Ott et al. (Ott (2001)), is a factor of 2. This value decreases, as we take progressively lower inclination angles and vanishes at zero inclination. Hence, if Ho I is halo dominated as assumed in model 1, then its inclination angle should be limited to a range of 15° - 20°. The lower right panel in Fig. 7 shows the modelled, integrated HI emission. Visual inspection shows that the size of the ring and the HI column density distribution are similar to those in Fig. 1, indicating that the HI ring can indeed be a result of multiple SN explosions.
The rotation curve of model 1 (the filled squares, Fig. 2) agrees well with the observed HI rotation curve of Ho I for (see Ott et al. Ott (2001), Fig. 9) only in the outer regions at kpc, which are unperturbed by the shell expansion. In the inner perturbed regions the observed velocities exceed those of model 1 by 5-10 km s-1. We note here that this discrepancy might be due to an offset location of the dynamical center of Ho I with respect to the geometrical center of the HI hole (see Fig. 1), the effect that can hardly be modelled in our two-dimensional axisymmetric simulations. As a result, the mass redistribution due to the off-center SN explosions might have brought a considerable fraction of the fast rotating gas towards the galactic center. Indeed, adopting the observed rotation curve of Ho I as the initial rotation curve of model 1 would result in the equilibrium gas distribution that totally lacks any gas in the central 1 kpc radius irrespective of the halo mass we use; a realistic equilibrium gas distribution cannot be obtained in this case, implying that the observed rotation curve of Ho I is strongly perturbed in the inner regions.
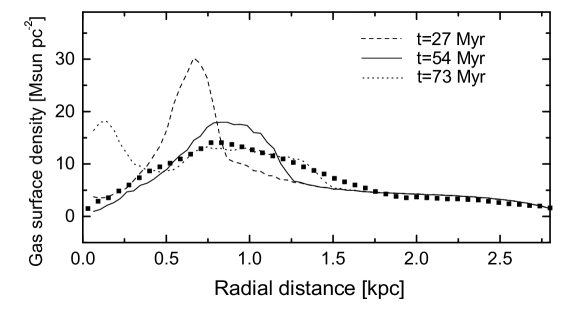
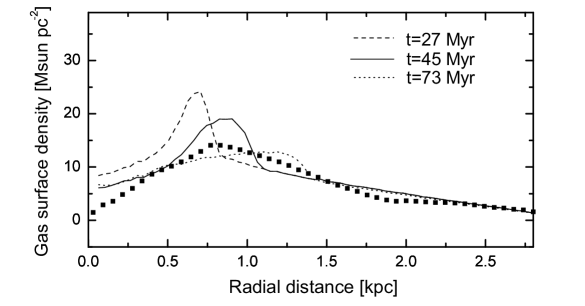
Finally, in Fig. 8 we present the azimuthally averaged radial gas distribution at three different phases of the shell expansion, taking the morphological center of the projected shell as the origin. An inclination i = 15° is assumed. The best agreement with observations is found at t = 55 5 Myr, which implies that the shell in Ho I has attained its largest size at the present time. The lack of expansion motions reported by Ott et al. (Ott (2001)) is thus not due to the low inclination of Ho I, but rather an intrinsic property. The measured contrast () in gas surface density between the central depression and the ring is well reproduced. We varied the total number of SN explosions () in order to see how the energy input can influence our conclusions. As mentioned above, for the shell never expands to its present diameter of 1.7 kpc, thus ruling out a small starburst as the origin of the HI ring in Ho I. On the other hand, for the projected shell appears too sharp-peaked at the time when it has reached a 1.7 kpc diameter, very similar to the radial gas profile for at 27 Myr (see Fig. 8, dashed line). Note that a possible depletion of HI column density () due to the ionization by an external UV background with photons cm-2 s-1 Hz-1 accounts for cm-2 only, which is less than at Myr. Hence, we find that the energy output equivalent to SNe can be responsible for producing the HI ring-like distribution of Ho I. If we assume a star formation efficiency of and a Salpeter IMF, the mass of a parent gas cloud must be around , which is not extreme.
4.2 Slowly rotating galaxy with a small halo (model 2).
Our numerical hydrodynamical simulations reveal considerable differences in the dynamics of the SN-driven shell for the case of a slowly rotating galaxy with a small, cuspy halo (model 2), as compared to the fast rotating galaxy with a massive, shallow halo (model 1). First, we find that the energy input needed to create the observed ring-like morphology is a factor of 2 lower in model 2 than in model 1. The radial gas surface density profiles in both models are similar; however, the exponential scale height of the gas is higher in model 2 (see Fig. 3), which results in a smaller gas volume density. This fact, along with a much lower inward gravity pull by a small halo, renders the isotropic expansion of the shell much more easy, but on the other hand impedes break through. Fig. 9 shows the time evolution of the distribution of the gas volume density for an energy deposition equivalent to 150 SN explosions. The shell evidently never breaks out of the disk. This is mainly due to the thicker vertical gas distribution and the lower energy input in model 2, as compared to model 1. On the contrary, the lack of gas expansion in the central HI depression in Ho I reported by Ott et al. (Ott (2001)) implies that its shell has broken out of the disk.
Applying the same analysis as in Sect. 4.1, we find the best agreement with the HI spectrum and channel maps of Ho I for inclination angles i = 25° - 30°, in contrast to i = 15° - 20° for model 1. Thus, numerical models with different halo masses predict different angles of inclination for Ho I. Comparison with the inclination angle derived from observations could therefore help to constrain the halo mass of Ho I. Unfortunately, Ott et al. (Ott (2001)) were not able to get stable results for the inclination. This implies that Ho I has a rather low inclination, which favours model 1 as the prime choice of Ho I. Furthermore, in case of Ho I we do not see any HI along the line of sight to the central hole down to a column density of cm-2, or a surface density of pc-2, a feature which is much better reproduced in model 1 than in model 2. For instance, the gas surface density near the central depression in Fig. 10 never falls below pc-2. Indeed, the shell has not yet broken out of the disk in model 2, thus contributing substantially to the line-of-sight gas column density near the central depression. This tendency is clearly seen in Fig. 10, which shows the azimuthally averaged radial gas distribution at three different phases of the shell expansion, taking the morphological center of the projected shell as the origin. An inclination of i = 25° is assumed. As is seen, the surface density of the gas near the center always exceeds that of Ho I shown by the filled squares.
5 Discussion
Ho I has a ring-like HI distribution, which is moderately non-axisymmetric with respect to its morphological center (see Fig. 1). The ellipticity of the ring makes it rather difficult to draw any quantitative comparison with the observations on the basis of two-dimensional axisymmetric simulations. However, the basic qualitative features of the gas distribution and velocity structure in Ho I, such as the size of the ring, the contrast in the gas surface density (hereafter, ) between the central depression and the ring, and the lack of gas expansion in the central hole can be modelled in the two-dimensional case.
The lack of gas expansion in the central depression reported by Ott et al. (Ott (2001)) argues that the shell has suffered a blowout. Otherwise, one would expect the shell to be still in the Sedov expansion phase with some piled-up gas in the z-direction. However, we do not see any HI along the line of sight to the central hole down to a column density of cm-2. The measured contrast in between the central depression and the ring (a factor of 15) is also indicative of a blowout, since the ‘limb brightening’ effect may account for a factor of 2 difference in between the projected rim of a three-dimensional shell and its center. Hence, the occurrence of a blowout (implied by the measured contrast in between the central depression and the ring) at the time when the shell has expanded out to its present size of 1.7 kpc is the main criterion for the selection between the two models.
As discussed in Sect. 4.1 and 4.2, the blowout scenario of Ho I is better reproduced in model 1 at Myr. At a first glance, the radial gas distribution in model 2 at 73 Myr seems by eye to better fit the overall observational data. However, it is not only the measured size of the ring (1.7 kpc), but also the measured contrast in between the central depression and the ring (a factor of 15) that are not reproduced for this case. We would like to note here that the estimated decrease in HI column density near the central depression caused by the external UV background is approximately at Myr in model 2. Hence, the external UV radiation field cannot reconcile the measured contrast of 15. Although the overall radial gas distribution in model 2 at 73 Myr fits better the measured profile, it fails to reproduce both the size of the ring and the measured contrast in the gas surface density between the central depression and the ring.
On the other hand, our best model is not optimized to fit the observations. At the time when the ring has attained its present size of 1.7 kpc, the maximum gas surface density exceeds that of Ho I by approximately pc-2 (see Fig.8, the solid line). At the same time, the width of the modelled ring is smaller than that of the observed ring. This is most probably due to the two-dimensional axisymmetric nature of our simulations attempting to reproduce a moderately non-axisymmetric structure, or azimuthal averaging of the inclined ring with vertical walls. Three-dimensional non-axisymmetric modelling of Ho I is required for a fine tuning of the model radial gas distribution.
There are a few assumptions inherent to the model that need further justification:
The assumed cooling function. The cooling function below K
depends on the degree of ionization of the gas. We made a few test runs with
the cooling function of Spaans & Norman (Spaans (1997)) truncated at
the lower temperatures, i.e. the cooling was
set to zero at K, and found that the influence of the cooling
at K on our results was minimal, which is due to the
fact that thermal energy of the shell is mostly lost at higher
temperatures as mentioned earlier.
Injection of energy by supernova explosions. In the present simulations
we use a constant wind approximation (Mac Low & Ferrara MF (1999)).
However, our simulations have shown that
the injection of thermal energy due to discrete
SN explosions produce similar results. Indeed, the frequency
of SN explosions in an instantaneously born stellar cluster remains
nearly constant, if a Salpeter initial mass function
and an upper stellar mass of are assumed. This finding
was also confirmed in numerical simulations of
Mac Low & McCray (MM (1988)).
Star formation history. In the present simulations we have assumed
a single starburst localized in the central region of Ho I
that provides the energy for 30 Myr.
Constant star formation in Ho I can be ruled out because of
the low total luminosity of ergs s-1
(Miller & Hodge Miller (1996)), which implies a SFR of only yr-1.
Indeed, assuming the constant SFR
of yr-1 and an age of Ho I of 10 Gyr, one obtains an
estimate on the total stellar mass of , which is
2.5 times lower than that actually measured for Ho I (Ott et al. Ott (2001)).
Variable star formation is plausible. However, in dIrr’s variations have
a burst-like nature (see e.g. Searle et al. Searle (1973)).
Our model corresponds to an explosive energy input following
evolution of a single OB association
with a total mass of .
A comparison of the photometry presented in Ott et al. (Ott (2001))
with the STARBURST99 synthesis
models (Leitherer et al. Star (1999)) shows that the B-band
magnitude as well as the UB color of the optical emission within
the giant HI hole is in agreement with a stellar cluster 55 Myr of age
(predicted by model 1) and a mass of
(Salpeter IMF, Z=0.004 metallicity, upper and lower mass cutoff: and , respectively). Such a stellar population
can easily provide the mechanical energy input to Ho I needed to
satisfy model 1. The discrepancy of the observed stellar mass with our
simulations (about 1 order of magnitude) is most likely due to
confusion with older stellar populations.

Nevertheless, we examine if variable star formation can affect our conclusions.
We assume that the mechanical luminosity produced by SN explosions
is time-dependent, for instance with a Gaussian shape.
Its maximum is centered at 15 Myr after the beginning of the energy input phase,
with a FWHM of 8.5 Myr.
This time-dependent mechanical luminosity is supposed to mimic
the energy input from successively born stellar clusters within a single stellar
association. To be consistent with the simulations in Sect. 4,
we set the energy input phase to last for 30 Myr and the total energy input
equivalent to 300 and 150 SNe for model 1 and model 2, respectively.
Figure 11 shows the azimuthally averaged gas distributions obtained
at the same phases of the shell expansion as in Figs. 8 and 10.
As is obviously seen, model 1 with variable star formation reproduces
the observed distribution and the contrast in
between the central depression and the ring (the solid line, Fig. 11a)
even better than
the same model with a single starburst approximation (the solid line, Fig. 8).
Model 2 clearly fails to reproduce the measured contrast in for
both star formation frameworks.
Our simulations also show that multiple, successively born smaller clusters
are less effective in creating a bubble structure than a single starburst
with the same total ejected energy.
Numerical resolution.
We made a few test runs with a higher resolution of 5 pc. Although the higher
resolution simulations provide more details on the gas flow dynamics and
the development of Rayleigh-Taylor and Kelvin-Helmholtz instabilities
(Figs.4 and 9), the integrated images such as the HI spectrum,
the channel maps, and
the radial gas distributions (Figs. 8, 10, and 11)
remain very similar to those derived with a lower resolution of 10 pc.
6 Summary
Numerical hydrodynamical modelling of the SN-driven shell formation is
performed with the aim to reproduce the ring-like morphology of HI in
the dIrr Ho I. Two models of Ho I are considered: a fast rotating galaxy
with a massive halo of (model 1), and a slowly
rotating galaxy with a small halo of (model 2).
Simulations reveal the following differences between the two models:
1. The mechanical energy to create the ring of 1.7 kpc
diameter in model 1, ergs or
Type II SNe, is a factor of 2 higher than in model 2. This is mainly due
to the smaller gas volume density and weaker gravitational potential in
model 2 as compared to model 1.
2. In model 1 the shell breaks out of the disk before it expands out to its present size of 1.7 kpc. On the contrary, in model 2 the shell never breaks out of the disk, mostly due to the thicker vertical gas distribution and lower energy input. As a consequence, both the measured contrast () in gas surface density between the central depression as well as the ring and the lack of gas expansion in the center of the ring are better reproduced in a model with a massive () dark matter halo.
3. Within model 1 an upper (i = 20°) and lower (i = 15°) limit to the inclination of Ho I can be set from the modelled HI spectrum and the channel maps, respectively. This is probably the only handle to assess the inclination of gas-rich, nearly face-on dwarf galaxies.
Our numerical hydrodynamical simulations suggest that Ho I was initially a halo-dominated dIrr with an exponentially declining radial gas distribution. Approximately 60 Myr ago a stellar cluster was born near the dynamical center of the galaxy from a parent gas cloud of . Subsequent SN explosions created an expanding shell filled with the hot SN ejecta. About 15 Myr ago the shell broke out of the disk pumping the hot gas into the halo. The fraction of the total gas mass of Ho I lost in a blow-out is low, within . At present the shell has attained its biggest size of 1.7 kpc. In another 20 Myr the central hole would fill in and Ho I would appear as a dIrr, with a wave-like declining radial gas distribution.
Acknowledgements.
The authors are thankful to M. Spaans and C. Norman for providing their cooling curves. This work was done under the INTAS grant YSF-2002-33. EV is grateful to the staff of the Radioastronomisches Institut der Universität Bonn for their hospitality and help with data processing. YS acknowledges partial support from the German Science Foundation, DFG (project SFB 591, TP A6). We are thankful to the anonymous referee for valuable criticism.References
- (1) Binney, J., & Merrifield, M. 1998, in Galactic Astronomy, eds. P. Ostriker and D.N. Spergel, Princeton University Press, 442
- (2) Binney, J., & Tremaine, S. 1987, Galactic Dynamics (Princeton: Princeton Univ. Press)
- (3) Buta, R. 1986, ApJS, 61, 609
- (4) Chevalier, R. A., 1974, ApJ, 188, 501
- (5) Efremov, Y. N., Elmegreen, B. G., & Hodge, P. W. 1998, ApJ, 501, L163
- (6) Leitherer, C., Schaerer, D., Goldader, J. D., et al. 1999, ApJS, 123, 3
- (7) Lynds, R., & Toomre, A. 1976, ApJ, 209, 382
- (8) Mac Low, M.-M., & Ferrara, A. 1999, ApJ, 513, 142
- (9) Mac Low, M.-M., McCray, R. 1988, ApJ, 324, 776
- (10) Mac Low, M.-M., McCray, R., & Norman, M. L. 1989, ApJ, 337, 141
- (11) Miller, B. W., & Hodge, P. 1996, ApJ, 458, 467
- (12) Murakami, T., & Babul, A., 1999, MN, 309, 161
- (13) Ott, J. 1999, Diploma thesis, University of Bonn
- (14) Ott, J., Walter, F., Brinks, E., Van Dyk, S.D., Dirsch, B., & Klein, U. 2001, AJ, 122, 3070
- (15) Puche, D., Westphal, D., Brinks, E., & Roy, J.-R. 1992, AJ, 103, 1841
- (16) Scoville, N. Z. & Sanders, D. B. 1987, in Interstellar Processes, ed. D. J. Hollenbach and H. A. Thronson, Jr. (Dordrecht: Reidel), 21
- (17) Searle, L., Sargent, W. L., & Bagnuolo, W. G. 1973, ApJ, 179, 427
- (18) Silich, S., & Tenorio-Tagle, G. 2001, ApJ, 552, 91
- (19) Spaans, M., & Norman C. 1997, ApJ, 483, 87
- (20) Stone, J. M., & Norman, M. L. 1992, ApJSS, 80, 753
- (21) Taylor, C., Brinks, E., Pogge, R. W., & Skillman, E. D. 1994, AJ, 107, 971
- (22) Tenorio-Tagle, G., Franco, J., Bodenheimer, P., & Rozyczka, M. 1987, A& A, 179,219
- (23) Yabe, T., & Xiao, F. 1993, J. Phys. Soc. Japan, 62, 2537
- (24) Wada, K., & Norman, C., 2001, ApJ, 547, 172
- (25) Wilcots, E. M., & Miller, B. W. 1998, AJ, 116, 2363